

Public health surveillance of multidrug-resistant clones of Neisseria gonorrhoeae in Europe: a genomic survey
- PMID: 29776807
- PMCID: PMC6010626
- DOI: 10.1016/S1473-3099(18)30225-1
Public health surveillance of multidrug-resistant clones of Neisseria gonorrhoeae in Europe: a genomic survey
Abstract
Background: Traditional methods for molecular epidemiology of Neisseria gonorrhoeae are suboptimal. Whole-genome sequencing (WGS) offers ideal resolution to describe population dynamics and to predict and infer transmission of antimicrobial resistance, and can enhance infection control through linkage with epidemiological data. We used WGS, in conjunction with linked epidemiological and phenotypic data, to describe the gonococcal population in 20 European countries. We aimed to detail changes in phenotypic antimicrobial resistance levels (and the reasons for these changes) and strain distribution (with a focus on antimicrobial resistance strains in risk groups), and to predict antimicrobial resistance from WGS data.
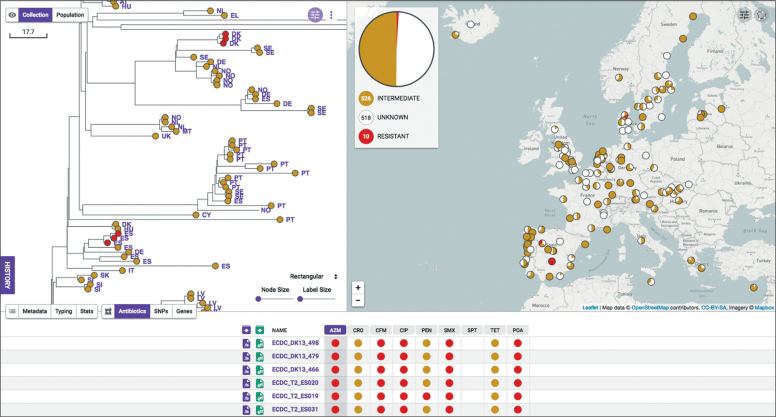
Methods: We carried out an observational study, in which we sequenced isolates taken from patients with gonorrhoea from the European Gonococcal Antimicrobial Surveillance Programme in 20 countries from September to November, 2013. We also developed a web platform that we used for automated antimicrobial resistance prediction, molecular typing (N gonorrhoeae multi-antigen sequence typing [NG-MAST] and multilocus sequence typing), and phylogenetic clustering in conjunction with epidemiological and phenotypic data.
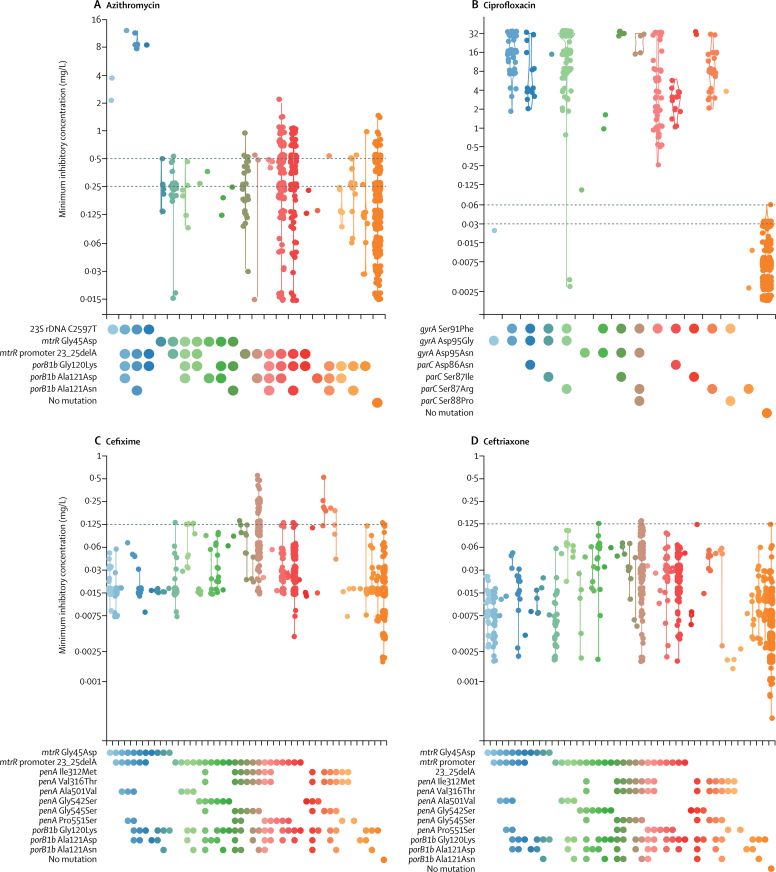
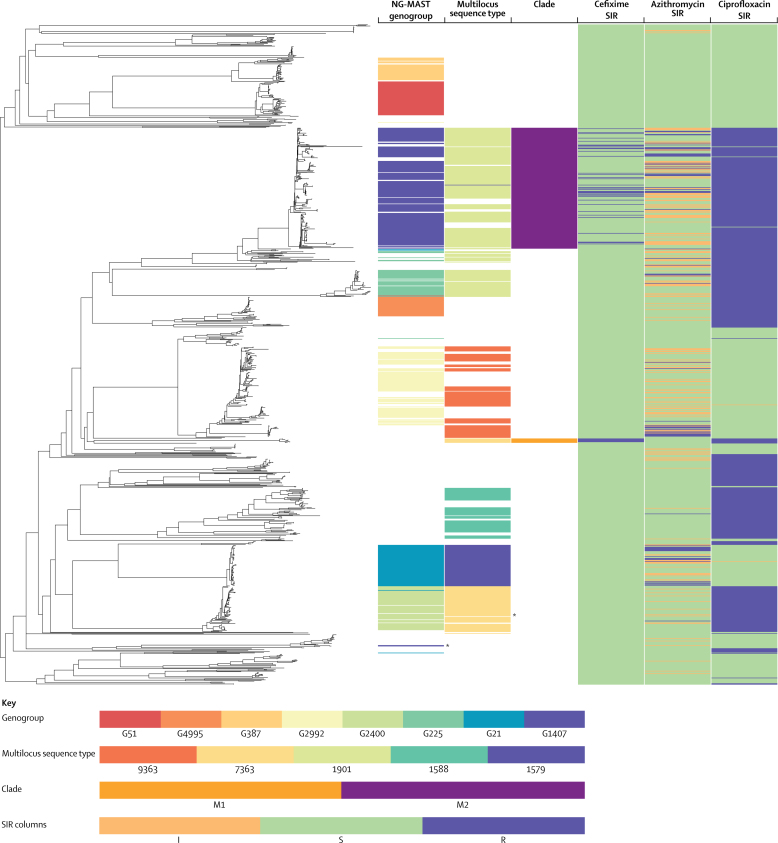
Findings: The multidrug-resistant NG-MAST genogroup G1407 was predominant and accounted for the most cephalosporin resistance, but the prevalence of this genogroup decreased from 248 (23%) of 1066 isolates in a previous study from 2009-10 to 174 (17%) of 1054 isolates in this survey in 2013. This genogroup previously showed an association with men who have sex with men, but changed to an association with heterosexual people (odds ratio=4·29). WGS provided substantially improved resolution and accuracy over NG-MAST and multilocus sequence typing, predicted antimicrobial resistance relatively well, and identified discrepant isolates, mixed infections or contaminants, and multidrug-resistant clades linked to risk groups.
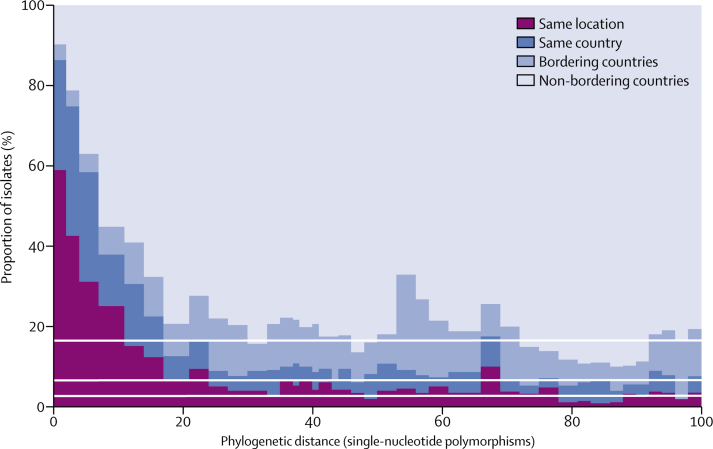
Interpretation: To our knowledge, we provide the first use of joint analysis of WGS and epidemiological data in an international programme for regional surveillance of sexually transmitted infections. WGS provided enhanced understanding of the distribution of antimicrobial resistance clones, including replacement with clones that were more susceptible to antimicrobials, in several risk groups nationally and regionally. We provide a framework for genomic surveillance of gonococci through standardised sampling, use of WGS, and a shared information architecture for interpretation and dissemination by use of open access software.
Funding: The European Centre for Disease Prevention and Control, The Centre for Genomic Pathogen Surveillance, Örebro University Hospital, and Wellcome.
Copyright © 2018 The Author(s). Published by Elsevier Ltd. This is an Open Access article under the CC BY 4.0 license. Published by Elsevier Ltd.. All rights reserved.
Figures
Comment in
-
Resistant gonorrhoea: east meets west.Lancet Infect Dis. 2018 Jul;18(7):702-703. doi: 10.1016/S1473-3099(18)30276-7. Epub 2018 May 15. Lancet Infect Dis. 2018. PMID: 29776806 No abstract available.
References
-
- European Centre for Disease Prevention and Control Gonococcal antimicrobial susceptibility surveillance in Europe 2013. July, 2015. https://ecdc.europa.eu/sites/portal/files/media/en/publications/Publicat...
-
- WHO Global action plan to control the spread and impact of antimicrobial resistance in Neisseria gonorrhoeae. 2012. http://apps.who.int/iris/bitstream/10665/44863/1/9789241503501_eng.pdf
Publication types
MeSH terms
Substances
Grants and funding
LinkOut - more resources
Full Text Sources
Other Literature Sources
Medical
