. 2018 Jul;29(7):1859-1873.
doi: 10.1681/ASN.2018020138. Epub 2018 May 18.

Cellular Origin and Functional Relevance of Collagen I Production in the Kidney

Affiliations

Cellular Origin and Functional Relevance of Collagen I Production in the Kidney

Simone Buchtler et al. J Am Soc Nephrol. 2018 Jul.

Abstract

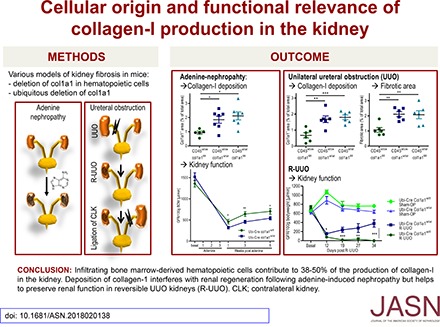
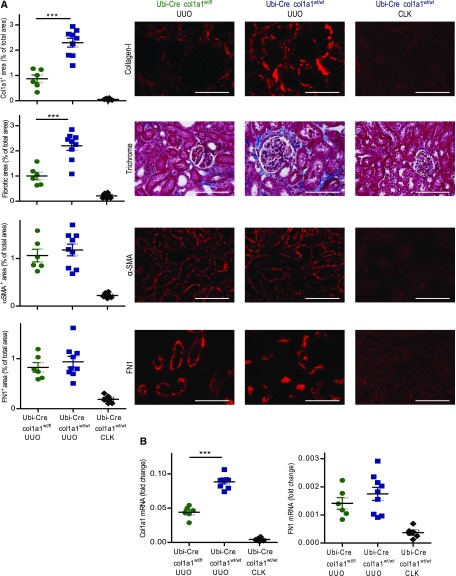
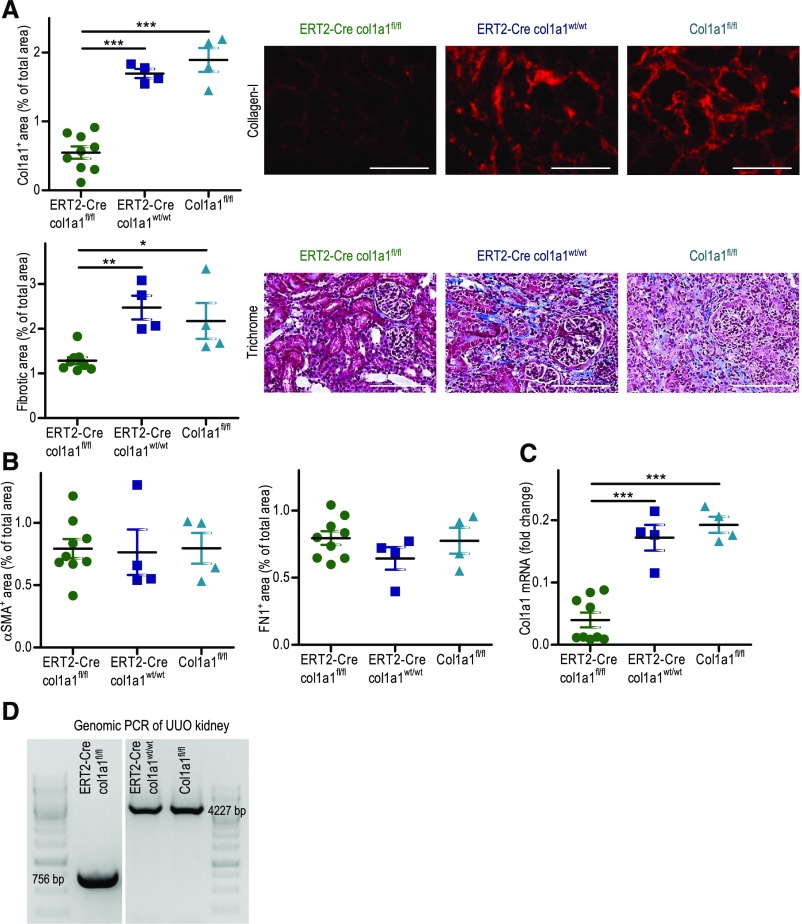
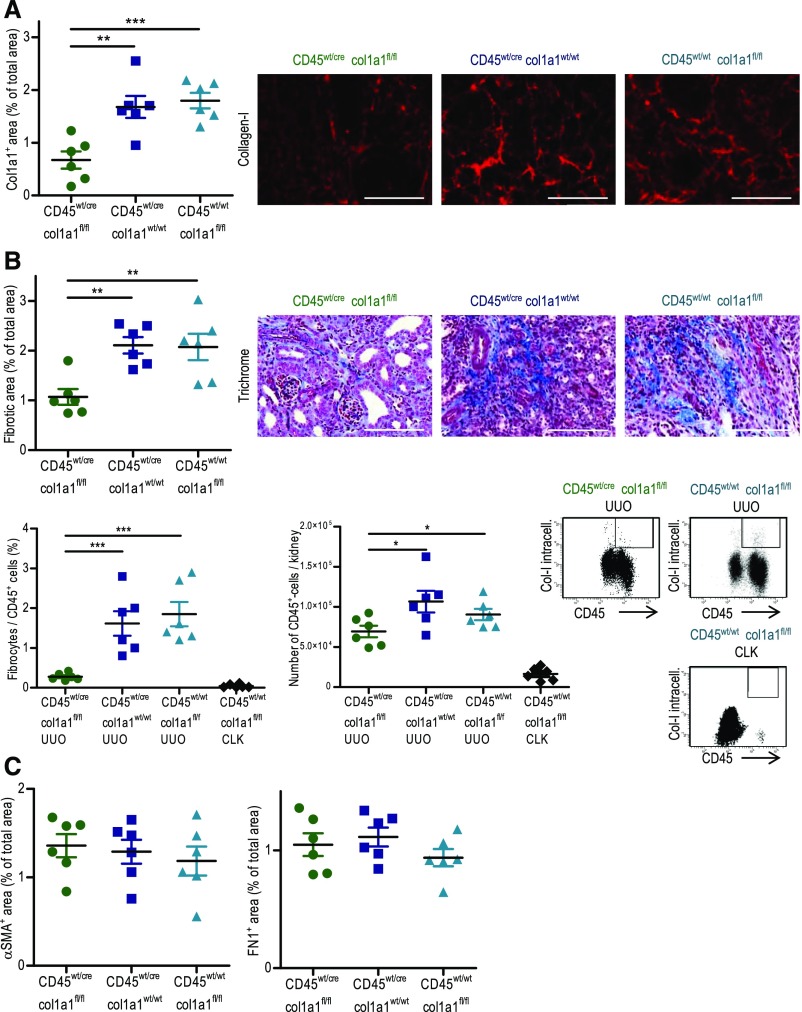
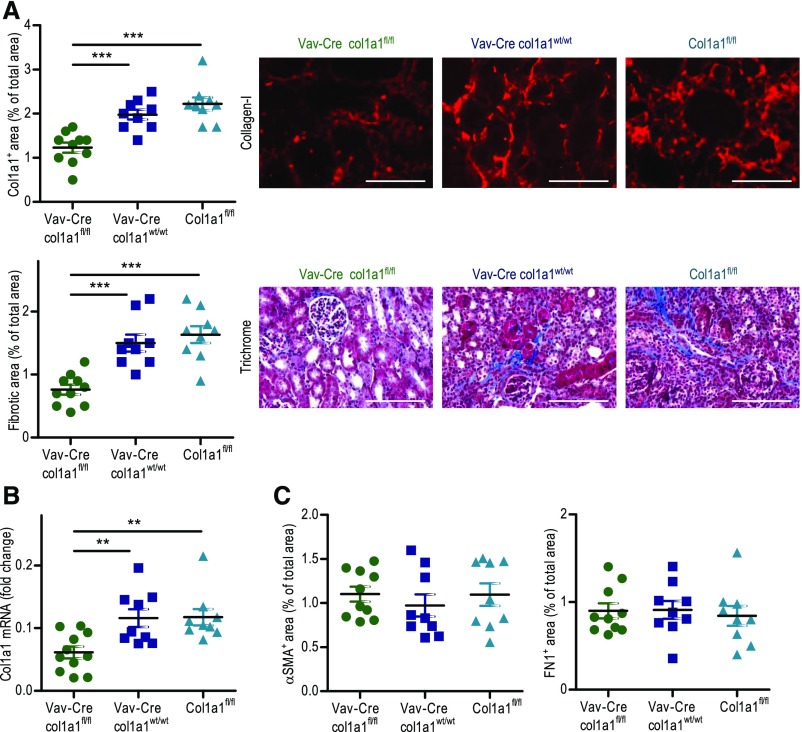
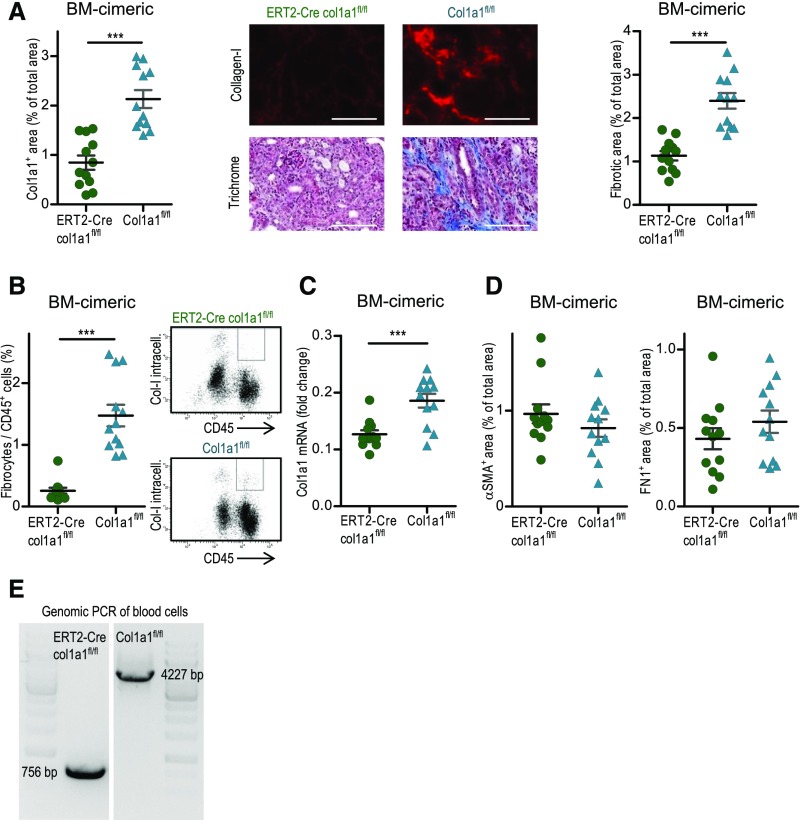
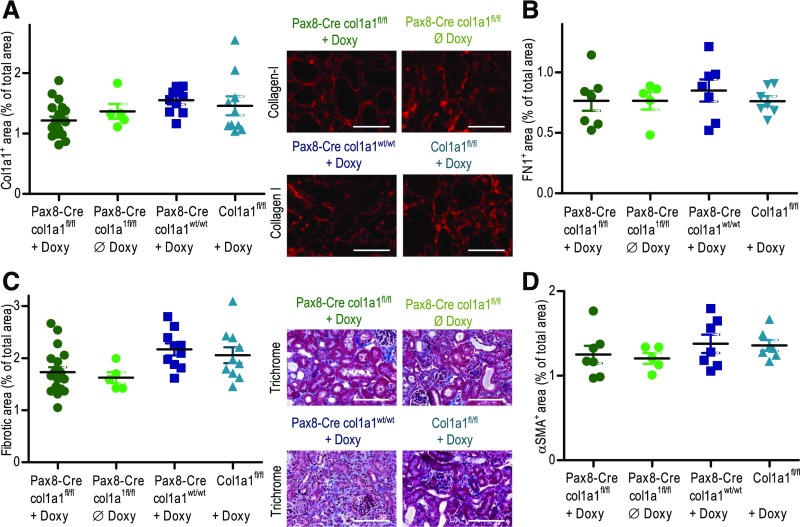
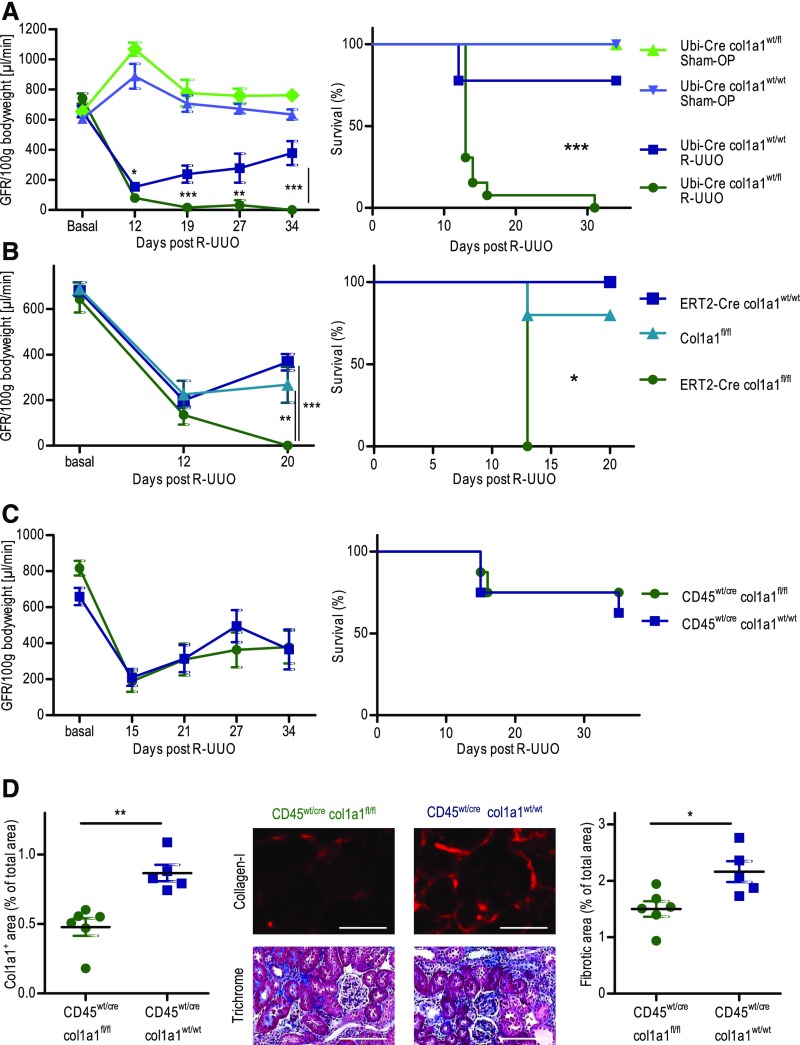
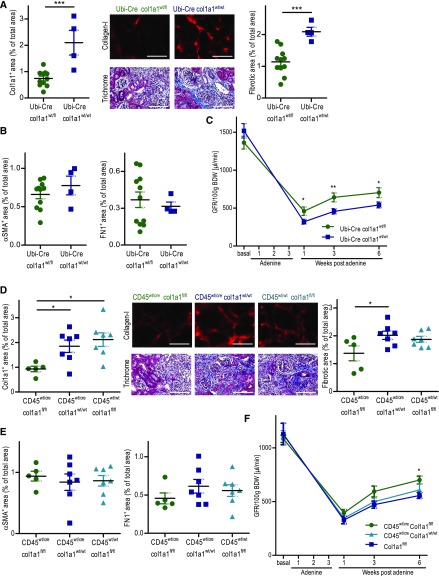
Background Interstitial fibrosis is associated with chronic renal failure. In addition to fibroblasts, bone marrow-derived cells and tubular epithelial cells have the capacity to produce collagen. However, the amount of collagen produced by each of these cell types and the relevance of fibrosis to renal function are unclear.Methods We generated conditional cell type-specific collagen I knockout mice and used (reversible) unilateral ureteral obstruction and adenine-induced nephropathy to study renal fibrosis and function.Results In these mouse models, hematopoietic, bone marrow-derived cells contributed to 38%-50% of the overall deposition of collagen I in the kidney. The influence of fibrosis on renal function was dependent on the type of damage. In unilateral ureteral obstruction, collagen production by resident fibroblasts was essential to preserve renal function, whereas in the chronic model of adenine-induced nephropathy, collagen production was detrimental to renal function.Conclusions Our data show that hematopoietic cells are a major source of collagen and that antifibrotic therapies need to be carefully considered depending on the type of disease and the underlying cause of fibrosis.

Keywords: chronic kidney disease; chronic renal failure; fibrosis; immunology; interstitial fibrosis.


Figures

None
Graphical abstract
Figure 1.
Figure 1.
Reduced fibrosis in 14-day unilateral ureteral obstruction (UUO) kidneys of mice with heterozygous ubiquitous deletion of col1a1. Nonobstructed contralateral kidneys (CLK) served as internal control. (A) Quantification of collagen I by immunofluorescence, overall fibrosis (fibrotic area) by Masson Trichrome staining, αSMA and fibronectin (FN1) by immunofluorescence, and (B) col1a1 and fibronectin mRNA expression (referred to as the housekeeping gene β-actin) by real-time RT-PCR in UUO kidneys of Ubi-Cre×col1a1wt/fl heterozygous mice (n=6) and UUO (n=9) and CLK (n=6) kidneys of Ubi-Cre×col1a1wt/wt controls. (A) Representative visual fields of renal tissue from one mouse per group are depicted. (A and B) Data are represented as mean±SEM. Unpaired two-sided t test. Scale bars, 100 μm. ***P<0.001.
Figure 2.
Figure 2.
Reduced fibrosis in 14-day unilateral ureteral obstruction (UUO) kidneys of mice with tamoxifen-inducible ubiquitous deletion of col1a1. For induction of Cre expression in ERT2-Cre mice, the mice were fed with tamoxifen-supplemented food for 5 weeks. After a washout of 2 weeks, UUO was performed. (A) Quantification of collagen I by immunofluorescence and overall fibrosis (fibrotic area) by Masson Trichrome staining with representative visual fields of renal tissue. (B) Analysis of αSMA and fibronectin by immunofluorescence and (C) col1a1 mRNA expression (referred to as the housekeeping gene β-actin) by real-time RT-PCR in ERT2-Cre×col1a1fl/fl (n=9), ERT2-Cre×col1a1wt/wt (n=4), and col1a1fl/fl (n=4) mice, which were all treated with tamoxifen. (D) Deletion of col1a1 in tamoxifen-induced ERT2-Cre×col1a1fl/fl mice shown by PCR of genomic DNA from UUO kidneys. (A) Representative visual fields of renal tissue from one mouse per group are depicted. (A–C) Data are represented as mean±SEM. One-way ANOVA. Scale bars, 100 μm. *P<0.05; **P<0.01; ***P<0.001.
Figure 3.
Figure 3.
Reduced fibrosis in 14-day unilateral ureteral obstruction (UUO) kidneys of mice with leukocyte (CD45)–specific homozygous deletion of col1a1. (A) Quantification of collagen I by immunofluorescence and overall fibrosis (fibrotic area) by Masson Trichrome staining with representative visual fields of renal tissue. (B) Analysis of CD45+ collagen I+ fibrocytes related to CD45+ cells and analysis of CD45+ cells per kidney by flow cytometry with representative dot plots of UUO kidneys and nonobstructed contralateral kidneys (CLKs). (C) Quantification of αSMA and fibronectin by immunofluorescence in cd45wt/cre×col1a1fl/fl (n=6), cd45wt/cre×col1a1wt/wt (n=6), and cd45wt/wt×col1a1fl/fl (n=6) mice. (A) Representative visual fields of renal tissue from one mouse per group are depicted. (A–C) Data are represented as mean±SEM. One-way ANOVA (A–C). Scale bars, 100 μm. *P<0.05; **P<0.01; ***P<0.001.
Figure 4.
Figure 4.
Reduced fibrosis in 14-day unilateral ureteral obstruction kidneys of mice with leukocyte (Vav)–specific homozygous deletion of col1a1. (A) Quantification of collagen I by immunofluorescence and overall fibrosis (fibrotic area) by Masson Trichrome staining with representative visual fields of renal tissue. (B) Analysis of col1a1 mRNA expression (referred to as the housekeeping gene β-actin) by real-time RT-PCR. (C) Quantification of αSMA and fibronectin by immunofluorescence in Vav-Cre×col1a1fl/fl (n=10 for histology and n=11 for RT-PCR), Vav-Cre×col1a1wt/wt (n=9), and col1a1fl/fl (n=9) mice. (A) Representative visual fields of renal tissue from one mouse per group are depicted. Data are represented as mean±SEM. (A) Mann–Whitney and (B and C) unpaired two-sided t tests. Scale bars, 100 μm. **P<0.01; ***P<0.001.
Figure 5.
Figure 5.
Reduced fibrosis in 14-day unilateral ureteral obstruction (UUO) kidneys of bone marrow chimeric mice with tamoxifen-induced homozygous deletion of col1a1 in hematopoietic stem cells. Lethally irradiated C56BL/6 mice were reconstituted with bone marrow from tamoxifen-induced ERT2-Cre×col1a1fl/fl (n=12) or col1a1fl/fl (n=12) mice. (A) Quantification of collagen I by immunofluorescence and overall fibrosis (fibrotic area) by Masson Trichrome staining with representative visual fields of renal tissue. (B) CD45+ collagen I+ fibrocytes analyzed by flow cytometry. (C) αSMA and fibronectin quantified by immunofluorescence and (D) col1a1 mRNA expression (referred to as the housekeeping gene β-actin) quantified by real-time RT-PCR. (E) Deletion of col1a1 shown by genomic PCR of peripheral blood cells of one representative mouse per group after 14-day UUO. (A) Representative visual fields of renal tissue from one mouse per group are depicted. Data are represented as mean±SEM. (A and C) Unpaired two-sided t test and (B) Mann–Whitney test. BM, bone marrow. Scale bars, 100 μm. ***P<0.001.
Figure 6.
Figure 6.
Cell type–specific deletion of col1a1 in tubular epithelial cells does not reduce fibrosis in 14-day unilateral ureteral obstruction (UUO) kidneys. To induce Cre expression in Pax8-Cre mice, doxycycline was given for 2 weeks in the drinking water. UUO was performed after a washout of 4 days. Pax8-Cre×col1a1fl/fl induced with doxycycline (n=20; knockout), Pax8-Cre×col1a1fl/fl not induced with doxycycline (n=5; control), col1a1fl/fl induced with doxycycline (n=10; control), and Pax8-Cre×col1a1wt/wt induced with doxycycline (n=10; control) were analyzed for (A) deposition of collagen I, (B) fibronectin, (C) overall fibrosis (fibrotic area), and (D) αSMA. (A and C) Representative visual fields of renal tissue from one mouse per group are depicted. Data are represented as mean±SEM. One-way ANOVA test. Scale bars, 100 μm.
Figure 7.
Figure 7.
Ubiquitous deletion of collagen I but not cell type specific deletion of collagen I in hematopoietic cells impairs renal function and survival of mice with a reversible unilateral ureteral obstruction (R-UUO). (A–C) Measurement of GFR (one kidney) per 100 g body wt and survival in various strains of mice. R-UUO was performed on day 0, obstruction was relieved on day 6, and the contralateral kidney was irreversibly obstructed on day 11. (A) GFR (one kidney) per 100 g body wt and survival in Ubi-Cre×col1a1wt/fl heterozygous mice (n=13) and Ubi-Cre×col1a1wt/wt controls (n=9). Sham operations (Sham-OP) included all procedures except R-UUO, and they were performed in Ubi-Cre×col1a1wt/fl mice (n=5) and Ubi-Cre×col1a1wt/wt controls (n=4). (B) GFR (one kidney) per 100 g body wt and survival in ERT2-Cre×col1a1fl/fl (n=5), ERT2-Cre×col1a1wt/wt (n=5), and col1a1fl/fl (n=5) mice. (C) GFR (one kidney) per 100 g body wt and survival in cd45wt/cre×col1a1fl/fl (n=8) and cd45wt/cre×col1a1wt/wt (n=8). (D) Deposition of collagen I and overall fibrosis (fibrotic area) in the R-UUO kidneys on day 35 after R-UUO with representative visual fields of renal tissue from one mouse per group. All mice were treated with tamoxifen from week −7 to −2 before R-UUO. (D) Representative visual fields of renal tissue from one mouse per group are depicted. Data are represented as mean or mean±SEM. (A and D) Unpaired two-sided t test, (B) one-way ANOVA, and log rank (Mantel–Cox) test for survival. Scale bars, 100 μm. *P<0.05; **P<0.01; ***P<0.001.
Figure 8.
Figure 8.
Ubiquitous and cell type specific deletion of collagen I in hematopoietic cells reduces renal fibrosis and improves renal function in the model of adenine-induced nephropathy. Various strains of mice were fed for 3 weeks with an adenine-rich diet. Six weeks after termination of adenine feeding, histology was performed. (A) Quantification of collagen I and overall fibrosis (fibrotic area) with representative visual fields of renal tissue, (B) αSMA, and fibronectin in the kidneys of Ubi-Cre×col1a1wt/fl heterozygous mice (n=11) and Ubi-Cre×col1a1wt/wt controls (n=4). (C) GFR per 100 g body wt (BDW) was measured before and 1, 3, and 6 weeks after termination of adenine feeding in Ubi-Cre×col1a1wt/fl heterozygous mice (n=7) and Ubi-Cre×col1a1wt/wt controls (n=7). (D) Quantification of collagen I, overall fibrosis (fibrotic area) with representative visual fields of renal tissue, (E) αSMA, and fibronectin of cd45wt/cre×col1a1fl/fl (n=5), cd45wt/cre×col1a1wt/wt (n=7), and cd45wt/wt×col1a1fl/fl (n=7) mice. (F) GFR per 100 g BDW was measured before and 1, 3, and 6 weeks after adenine feeding in cd45wt/cre×col1a1fl/fl (n=5), cd45wt/cre×col1a1wt/wt (n=5), and cd45wt/wt×col1a1fl/fl (n=4) mice. (A and D) Representative visual fields of renal tissue from one mouse per group are depicted. Data are represented as mean±SEM. (A–C and F) Unpaired two-sided t test, and (D and E) one-way ANOVA. Scale bars, 100 μm. *P<0.05; **P<0.01; ***P<0.001.

References

    1. Menn-Josephy H, Lee CS, Nolin A, Christov M, Rybin DV, Weinberg JM, et al. .: Renal interstitial fibrosis: An imperfect predictor of kidney disease progression in some patient cohorts. Am J Nephrol 44: 289–299, 2016 - PMC - PubMed
    1. Nangaku M: Chronic hypoxia and tubulointerstitial injury: A final common pathway to end-stage renal failure. J Am Soc Nephrol 17: 17–25, 2006 - PubMed
    1. Chang HY, Chi JT, Dudoit S, Bondre C, van de Rijn M, Botstein D, et al. .: Diversity, topographic differentiation, and positional memory in human fibroblasts. Proc Natl Acad Sci U S A 99: 12877–12882, 2002 - PMC - PubMed
    1. Humphreys BD, Lin SL, Kobayashi A, Hudson TE, Nowlin BT, Bonventre JV, et al. .: Fate tracing reveals the pericyte and not epithelial origin of myofibroblasts in kidney fibrosis. Am J Pathol 176: 85–97, 2010 - PMC - PubMed
    1. LeBleu VS, Taduri G, O’Connell J, Teng Y, Cooke VG, Woda C, et al. .: Origin and function of myofibroblasts in kidney fibrosis. Nat Med 19: 1047–1053, 2013 - PMC - PubMed

Publication types

MeSH terms

LinkOut - more resources