. 2018 Jul 1;201(1):19-30.
doi: 10.4049/jimmunol.1800295. Epub 2018 May 18.

CD4 T Cell Affinity Diversity Is Equally Maintained during Acute and Chronic Infection

Affiliations

CD4 T Cell Affinity Diversity Is Equally Maintained during Acute and Chronic Infection

Rakieb Andargachew et al. J Immunol. .

Abstract

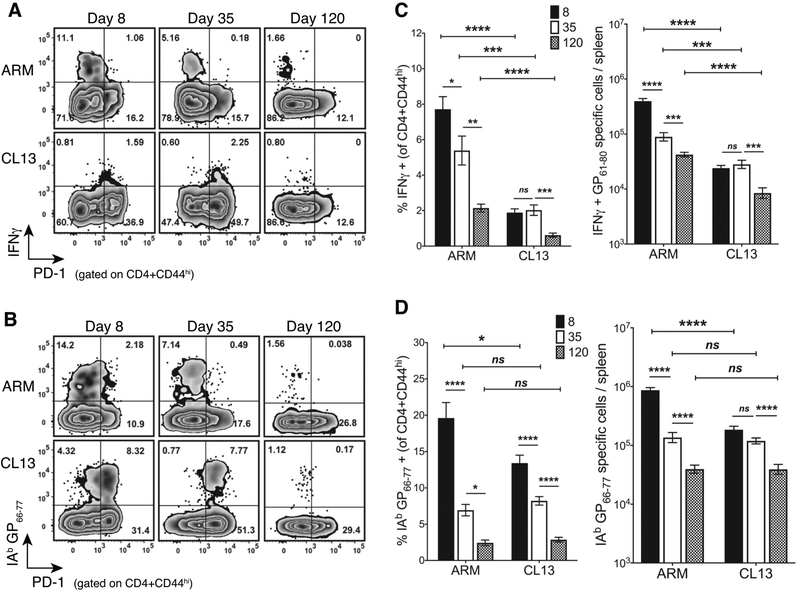
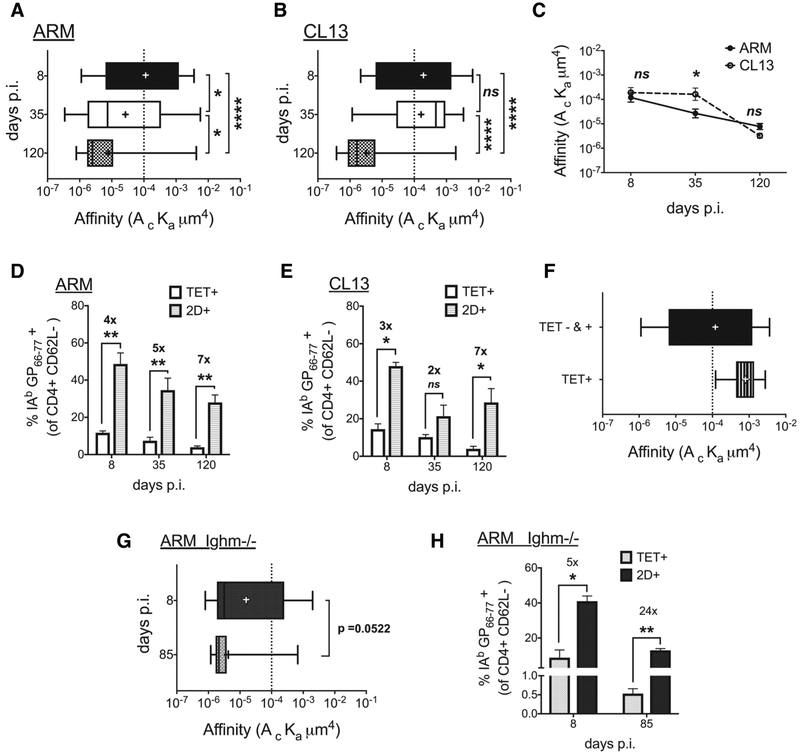
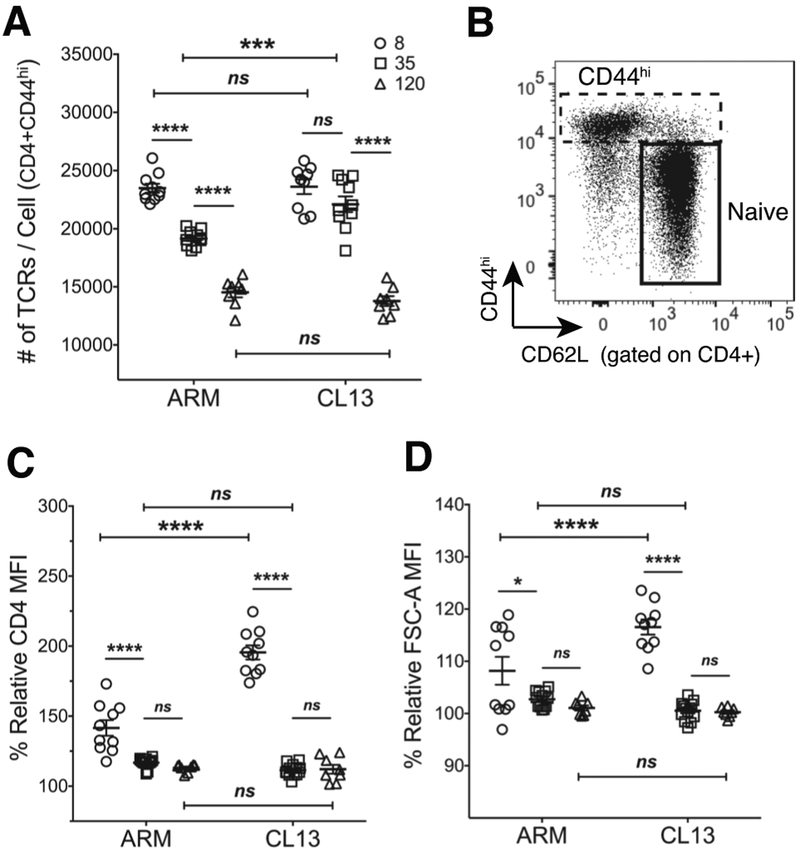
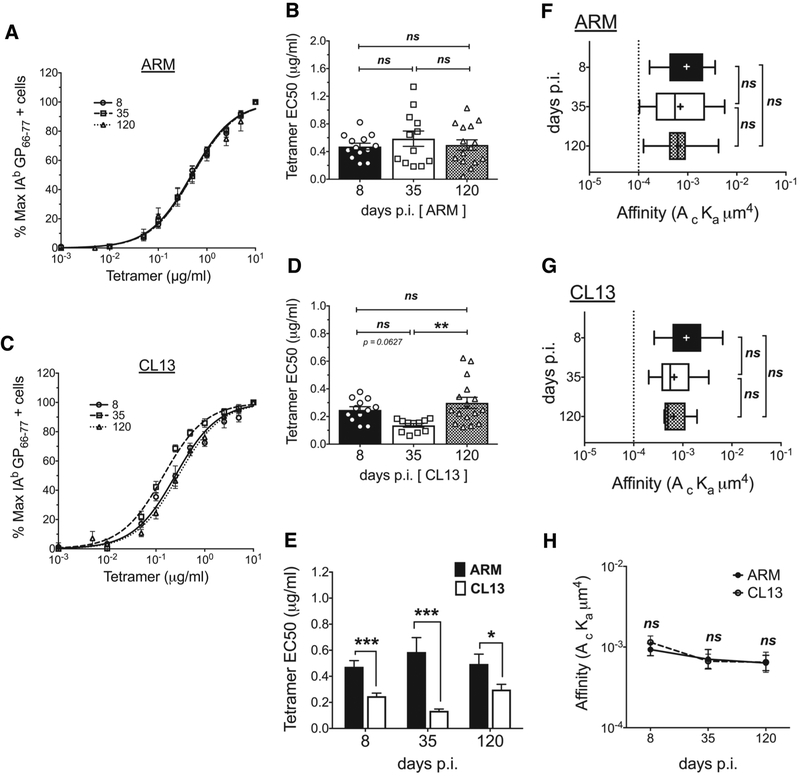
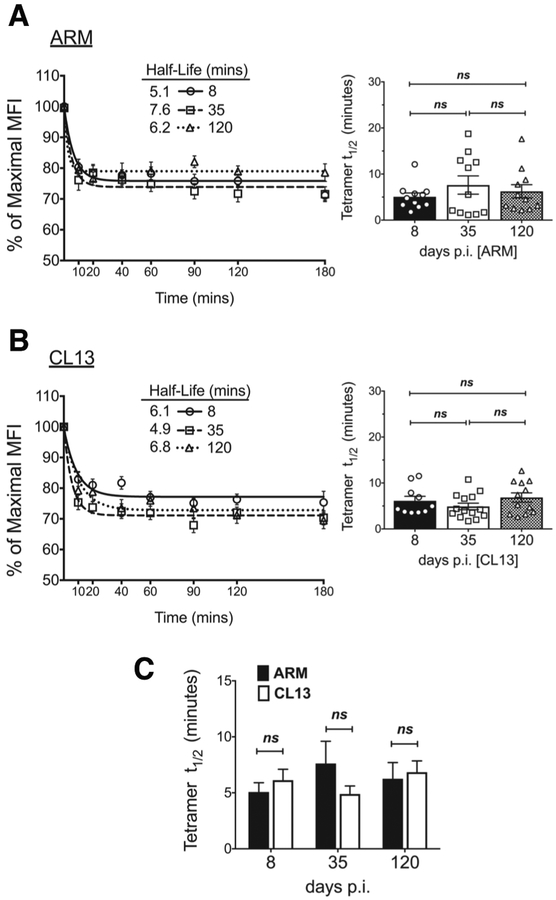
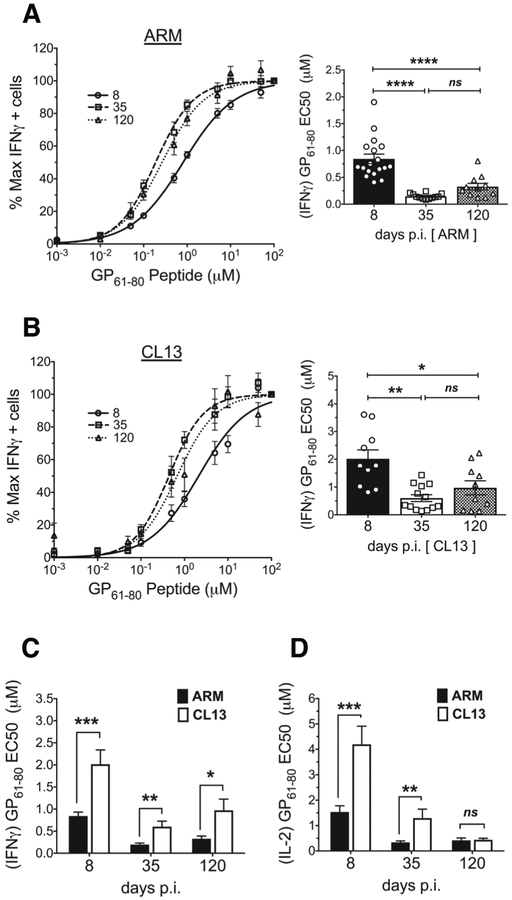
TCR affinity for peptide MHC dictates the functional efficiency of T cells and their propensity to differentiate into effectors and form memory. However, in the context of chronic infections, it is unclear what the overall profile of TCR affinity for Ag is and if it differs from acute infections. Using the comprehensive affinity analysis provided by the two-dimensional micropipette adhesion frequency assay and the common indirect affinity evaluation methods of MHC class II tetramer and functional avidity, we tracked IAb GP61-80-specific cells in the mouse model of acute (Armstrong) and chronic (clone 13) lymphocytic choriomeningitis virus infection. In each response, we show CD4 T cell population affinity peaks at the effector phase and declines with memory. Of interest, the range and average relative two-dimensional affinity was equivalent between acute and chronic infection, indicating chronic Ag exposure did not skew TCR affinity. In contrast, functional and tetramer avidity measurements revealed divergent results and lacked a consistent correlation with TCR affinity. Our findings highlight that the immune system maintains a diverse range in TCR affinity even under the pressures of chronic Ag stimulation.


Figures

Figure 1.
Figure 1.. Chronic antigen stimulation leads to T cell dysfunction but maintains tetramer positive cells at a number comparable to the acute response.
(A) A representative flow plot with the frequency of IFNγ and PD-1 expressing cells in ARM and CL13 at the indicated days post infection (dpi) gated on CD4+CD44hi splenocytes. (B) A representative flow plot with the frequency of IAb GP66–77 tetramer+ and PD-1 expressing cells under the conditions mentioned in (A). (C) Frequency (left) and log transformed absolute numbers (right) of IFNγ producing cells at the time points and infections represented in the flow plot in (A). (D) Frequency (left) and log transformed absolute numbers (right) of IAb GP66–77 tetramer+ T cells represented in (B). (C,D) Cumulative data with 3–5 independent experiments and a total n = 7–19 mice/group at n=2–5 mice/experiment/group. Bar graphs with Mean ± SEM. Statistical significance, ns = no significance, * P > 0.05, ** P > 0.01, *** P > 0.001, **** P > 0.0001, Student t-test (ARM vs CL13), Ordinary one-way ANOVA Tukey’s multiple comparison test (between dpi - individual infections).
Figure 2.
Figure 2.. CD4 T cell affinity peaks at effector phase and declines equally with memory in acute and chronic infection.
(A, B) 2D affinity of IAb GP66–77 specific cells in CD4+CD62L- enriched samples from ARM (A) and CL13 (B) infected splenocytes and a comparison of the two infections (C) at the designated days. (D,E) A comparison of tetramer and 2D detected frequency of IAb GP66–77 specific cells in above-mentioned samples from (D) ARM and (E) CL13. (F) 2D affinity of sorted tetramer+ and total (tet+ and tet-) CD4+CD62L- cells from d7 ARM infected splenocytes. (G) 2D affinity of IAb GP66–77 specific CD4+CD62L- T cells from ARM infected B-cell deficient (Ighm−/−) mice at d8 and d85 dpi with p-value (0.0522). (H) Comparison of tetramer and 2D frequency in samples from (G). All data representative of 2–3 independent experiments with splenocytes from 2–3 mice pooled pre-CD4+CD62L- enrichment per time point and per infection. Affinity data log transformed with (+) sign depicting mean affinity in box and whisker graphs with min to max range of measured single cell affinities. Tetramer + high affinity cell cutoff as a dotted line at 1 × 10⁻⁴. Mean + SEM in bar graphs. Statistical significance, ns = no significance, * P > 0.05, ** P > 0.01, *** P > 0.001, **** P > 0.0001, (A,B) Ordinary one-way ANOVA Tukey’s multiple comparison test, (C) Sidak’s multiple comparison test, (D, E, G, H) Student t-test.
Figure 3.
Figure 3.. TCR expression higher in CL13 infection.
(A) TCRβ per cell numbers for CD44hi CD4 T cells from ARM and CL13 infected splenocytes at the designated days using PE quantification beads. (B) A representative flow plot showing the gating strategy for naïve (CD44loCD62L+) and antigen experienced (CD44hi) cells from total CD4 T cells. (C) % CD4 MFI and (D) % FSC-A MFI of CD44hi cells normalized to naïve MFIs. (A,C,D) Points representing individual mice (n=7–10 mice with n=2–5 mice/experiment/group). MFI of CD44hi cells divided by MFI of naïve cells and multiplied by hundred to get % relative MFI. Mean ± SEM. Statistical significance, ns = no significance, ** P > 0.01, *** P > 0.001, **** P > 0.0001, Ordinary one-way ANOVA Tukey’s multiple comparison test (between dpi - individual infections), Sidak’s multiple comparison test (ARM vs CL13).
Figure 4.
Figure 4.. Tetramer avidity changes in chronic infection in the absence of TCR affinity differences.
Tetramer avidity curves showing % maximum tetramer+ cells at the different tetramer concentrations used to stain splenocytes from (A) ARM and (C) CL13 infected mice at the different dpi. The frequency of tetramer+ cells at the different doses was divided by the frequency at the highest concentration (10ug/ml) to calculate % maximum tetramer binders. Curves fitted to a non-linear regression (normalized frequency x log concentration - dose response curve with a variable slope). EC50 tetramer concentrations obtained from the dose response curves for individual mice from (B) ARM and (D) CL13 infections. (E) Comparison of EC50 values between ARM and CL13 at the different dpi. 2D affinity of antigen specific cells that fall above the tetramer staining affinity cutoff (F) ARM and (G) CL13 infection and (H) a comparison of the two responses. (A,C) Curves represent the Mean ± SEM of n = 12–16 mice. (B,D,E) Mean ± SEM in bar graphs with n=8–12 mice with each symbol representing individual mice. (F,G,H) pooled sample from 2–3 mice, affinity data log transformed with (+) sign depicting mean affinity in box and whisker graphs with min to max range of measured single cell affinities. Tetramer + high affinity cell cutoff as a dotted line at 1 × 10⁻⁴. All data representative of 3–5 independent experiments at n=2–5 mice/experiment/group. Statistical significance, ns = no significance, * P > 0.05, ** P > 0.01, *** P > 0.001, **** P > 0.0001, (B, D, F, G) Ordinary one-way ANOVA Tukey’s multiple comparison test (between dpi - individual infections), (E) Student t-test, (H) Sidak’s multiple comparison test (ARM vs CL13).
Figure 5.
Figure 5.. Tetramer half-life similar between memory and exhausted CD4 T cells.
Tetramer decay curves (left) and bar graphs of half-lives (right) for CD4 T cells from (A) ARM and (B) CL13 infected splenocytes and (C) a comparison of the two shown for the different dpi. (A, B left) Tetramer MFI at decay time points was normalized to time 0 MFI and the % MFI fitted to a one-phase exponential decay curve. (A,B right) Half-lives derived from curves for individual mice in bar graphs with symbols representing each mouse. Mean ± SEM representative of n = 13–14 mice, 3–5 independent experiments at n=3–5 mice/experiment/group. Statistical significance, ns = no significance. (A,B) Ordinary one-way ANOVA Tukey’s multiple comparison test (between dpi - individual infections), (C) Student t-test (ARM vs CL13).
Figure 6.
Figure 6.. Exhausted CD4 T cells have a lower functional avidity compared to memory cells.
Functional avidity dose response curves showing % of maximal IFNγ producers at the different doses of GP61–80 peptide used for ex-vivo stimulation of splenocytes from (A, left) ARM and (B, left) CL13 infected mice at the different dpi. The frequency of IFNγ producers at the different doses was divided by the frequency of producers at the highest peptide dose (100uM) to calculate % maximal producers. Curves fitted to a non-linear regression (normalized frequency x log concentration - dose response curve with a variable slope). EC50 peptide concentrations derived from the dose response curves for individual mice represented in bar graphs with each symbol representing a mouse for (A, right) ARM and (B, right) CL13. (C) Comparison of IFNγ and (D) IL-2 EC50 values between ARM and CL13 at the different dpi. Mean ± SEM (A,B,C) representative of n = 9–18 mice and (D) n=7–10 mice. 3–5 independent experiments at n=2–5 mice/experiment/group. Statistical significance, ns = no significance, * P > 0.05, ** P > 0.01, *** P > 0.001, **** P > 0.0001, (A,B right) Ordinary one-way ANOVA Tukey’s multiple comparison test (between dpi - individual infections), (C, D) Student t-test (ARM vs CL13).

References

    1. Matsui K, Boniface JJ, Steffner P, Reay PA, and Davis MM. 1994. Kinetics of T-cell receptor binding to peptide/I-Ek complexes: correlation of the dissociation rate with T-cell responsiveness. Proc. Natl. Acad. Sci. U. S. A 91: 12862–12866. - PMC - PubMed
    1. Corr M, Slanetz AE, Boyd LF, Jelonek MT, Khilko S, al-Ramadi BK, Kim YS, Maher SE, Bothwell AL, and Margulies DH. 1994. T cell receptor-MHC class I peptide interactions: affinity, kinetics, and specificity. Science 265: 946–949. - PubMed
    1. Zehn D, Lee SY, and Bevan MJ. 2009. Complete but curtailed T-cell response to very low-affinity antigen. Nature 458: 211–214. - PMC - PubMed
    1. Daniels MA, Teixeiro E, Gill J, Hausmann B, Roubaty D, Holmberg K, Werlen G, Holländer GA, Gascoigne NR, and Palmer E. 2006. Thymic selection threshold defined by compartmentalization of Ras/MAPK signalling. Nature 444: 724–729. - PubMed
    1. Stone JD, Chervin AS, and Kranz DM. 2009. T-cell receptor binding affinities and kinetics: impact on T-cell activity and specificity. Immunology 126: 165–176. - PMC - PubMed

Publication types

MeSH terms

Substances