. 2018 Jun;19(6):625-635.
doi: 10.1038/s41590-018-0111-5. Epub 2018 May 18.

Progression of whole-blood transcriptional signatures from interferon-induced to neutrophil-associated patterns in severe influenza

Collaborators, Affiliations

Progression of whole-blood transcriptional signatures from interferon-induced to neutrophil-associated patterns in severe influenza

Jake Dunning et al. Nat Immunol. 2018 Jun.

Erratum in

Abstract

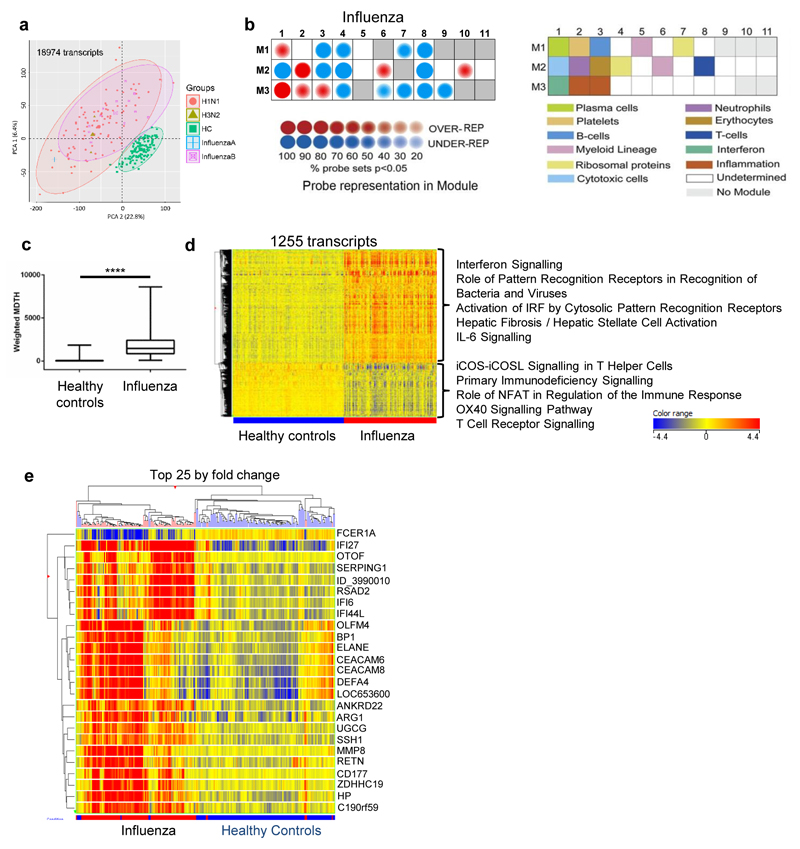
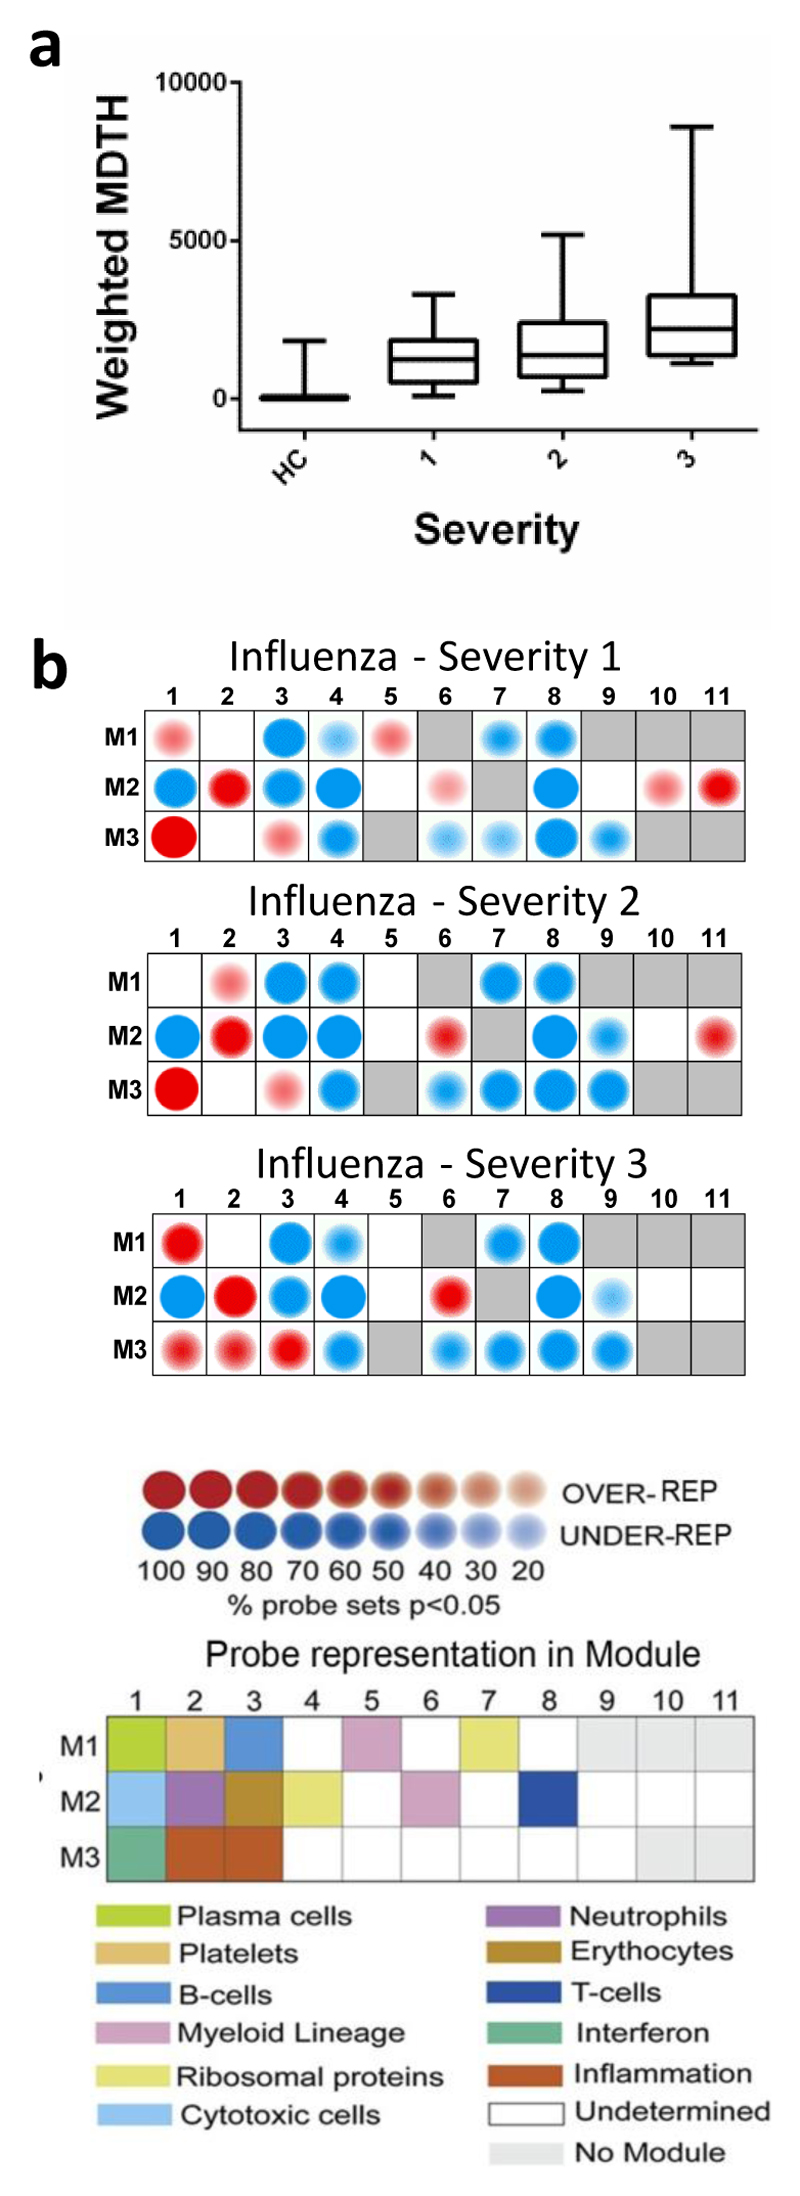
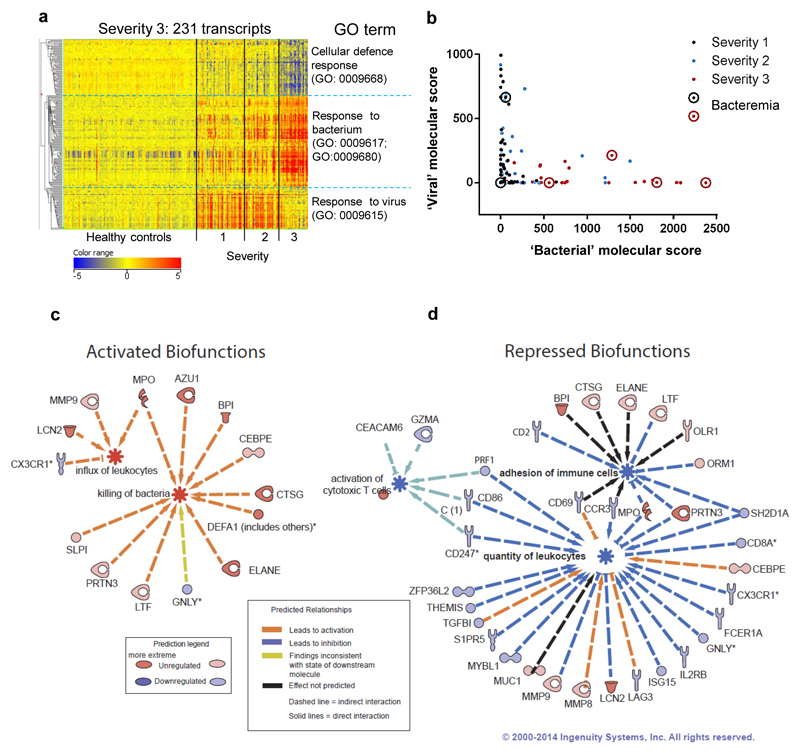
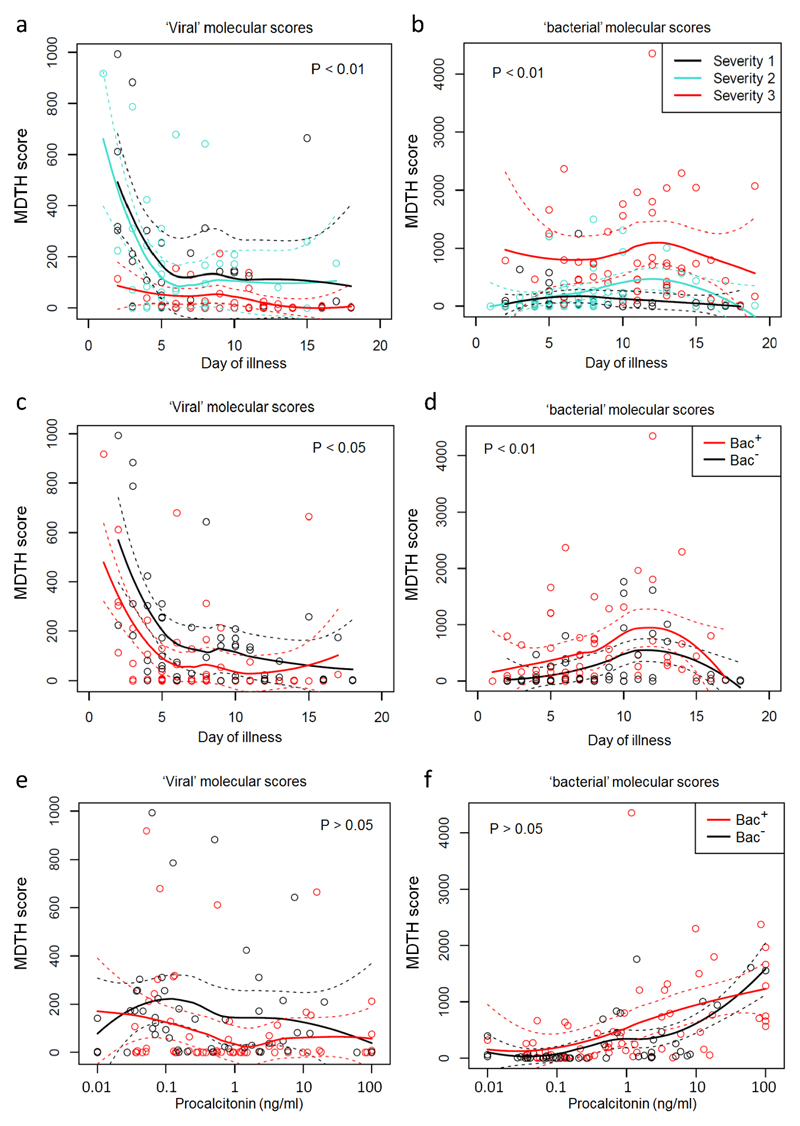
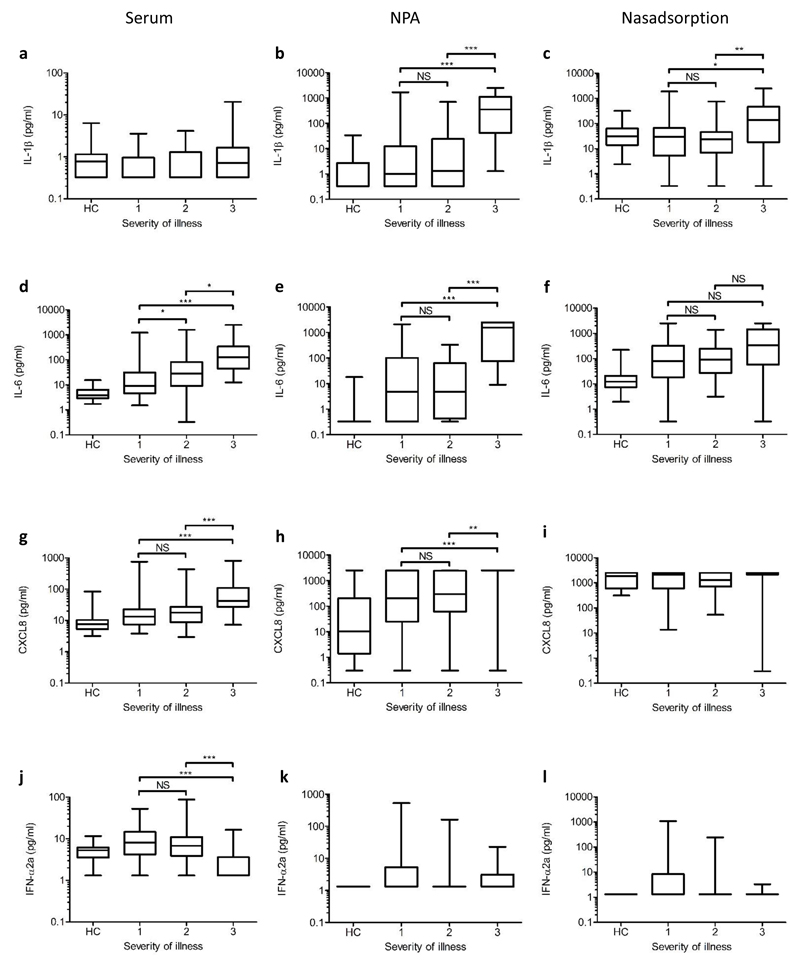
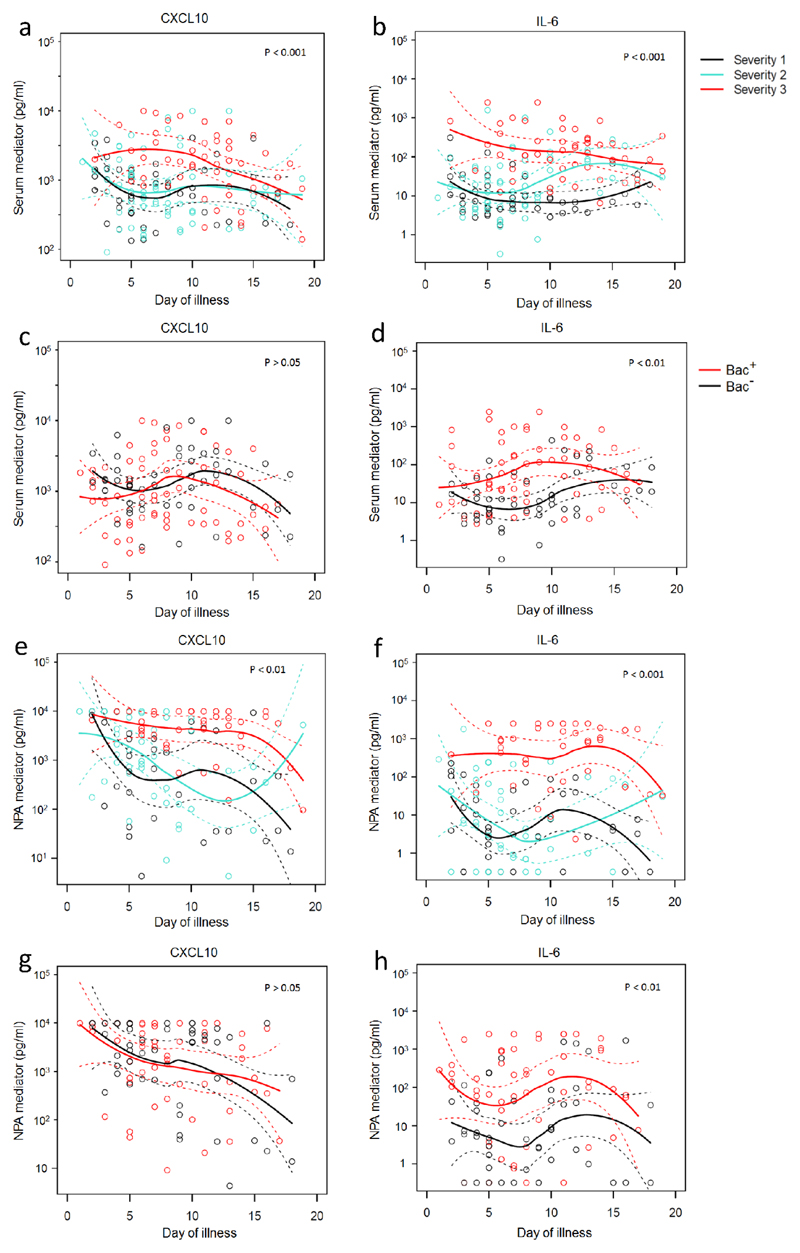
Transcriptional profiles and host-response biomarkers are used increasingly to investigate the severity, subtype and pathogenesis of disease. We now describe whole-blood mRNA signatures and concentrations of local and systemic immunological mediators in 131 adults hospitalized with influenza, from whom extensive clinical and investigational data were obtained by MOSAIC investigators. Signatures reflective of interferon-related antiviral pathways were common up to day 4 of symptoms in patients who did not require mechanical ventilator support; in those who needed mechanical ventilation, an inflammatory, activated-neutrophil and cell-stress or death ('bacterial') pattern was seen, even early in disease. Identifiable bacterial co-infection was not necessary for this 'bacterial' signature but was able to enhance its development while attenuating the early 'viral' signature. Our findings emphasize the importance of timing and severity in the interpretation of host responses to acute viral infection and identify specific patterns of immune-system activation that might enable the development of novel diagnostic and therapeutic tools for severe influenza.


Conflict of interest statement

Competing Financial Interests

The authors declare no competing financial interests.

Figures

Figure 1
Figure 1. Transcriptional signature of influenza compared to healthy controls.
(a) Principal component analysis of all transcripts significantly above background in at least 10% of samples (130 healthy controls (green squares), 97 influenza A (red circles: H1N1; green triangles, H3N2), and 12 influenza B (purple squares); all from 2010/11). (b) Modular analysis of 2010/11 influenza patients relative to healthy controls. The expression of the modules is shown on the left according to the colour intensity display; the corresponding modules are identified in the key to the right. (c) Weighted ‘molecular distance to health’ (MDTH24) of 2010/11 influenza patients compared to healthy controls, undertaken on 4526 transcripts that were significantly detected above background, filtered for low expression (transcripts retained if >2 fold-change (FC) from median normalised intensity value in more than 10% of all samples). Box whisker plot with min/max lines; statistical test: Mann-Whitney P<0.0001. (d) Heat-map of 1255 normalised intensity value transcripts, filtered for low expression then statistically filtered (Mann-Whitney with Bonferroni multiple testing correction P<0.01) followed by fold change filter between groups (transcripts retained if >2FC between any 2 groups). Listed next to the heat-map are the top five IPA canonical pathways (by significance; P<0.05, Fisher’s Exact test) for upregulated and downregulated transcripts. (e) Heat-map of normalised intensity values of the top 25 significant transcripts by mean fold-change between healthy controls and influenza groups clustered on entities and by individuals (Pearson’s uncentered (cosine) with averaged linkage).
Figure 2
Figure 2. Severity of disease is associated with diminished expression of interferon-related modules and over-expression of inflammation modules.
(a) Weighted MDTH of 2010/11 influenza patients (n=109) grouped by severity of illness score (1: normoxic (n=47); 2: hypoxia requiring correction by mask oxygen (n=34); 3: mechanical ventilation (n=28)), compared to healthy controls (HC; n=130), based on 4526 transcripts that were significantly expressed above background and filtered for low expression (transcripts retained if >2FC from median normalised intensity value in more than 10% of all samples). Box whisker plots are shown with min/max lines. (b) Modular analysis of 2010/11 influenza patients (n=109) grouped by severity, relative to healthy controls (n=130). The colour intensity correlates with the percentage of genes in that module that are significantly differentially expressed.
Figure 3
Figure 3. Severe disease is associated with lower expression of “viral” response genes, compared to early and less severe influenza.
(a) Heat-map of 231 normalised intensity value transcripts, obtained by filtering for low expression followed by statistical filtering (Kruskal-Wallis with Bonferroni multiple testing correction P<0.01) followed by fold change filter between groups (restricted to initial T1 samples, transcripts retained if >2FC between severity 3 and severity 1&2). Listed next to the heat-map are the top GO terms for the 3 major subdivisions of the dendrogram (clustered by Pearson’s uncentered (cosine) with average linkage rule). 2010/11 cohort: severity 1, n=47; severity 2, n=34; severity 3, n=28; HC, n=130. (b) Weighted molecular score (relative to healthy controls, n=130) of the 112 ‘bacterial response’ transcripts plotted against molecular score of the 51 ‘viral response’ transcripts for the 109 influenza individuals at the T1 time point. Severity of illness is indicated by different colours of dots: severity 1, black dots; severity 2, blue dots; severity 3, red dots. Circled dots identify patients with confirmed bacteraemia. (c) IPA significantly activated (z score >2) or (d) repressed (z score <2) biofunctions, identified by analysis of 231 transcript list; selected networks of biofunctional genes are shown.
Figure 4
Figure 4. Relationship between severity of illness, bacterial infection, procalcitonin and molecular scores.
’Viral’ and ‘bacterial’ MDTH scores (according to GO terms, as described in Fig. 3) calculated for patients with confirmed influenza (2010/11 cohort, n=109) according to clinical categories at both the first and second sampling time-points (T1 and T2). Loess fitting was used to interpolate and estimate mean values non-parametrically from the data (solid lines); dashed lines show the estimated 95% confidence interval values of the mean; statistical significance of differences were calculated using Chi-squared tests to compare the deviance of generalized linear models. (a) Viral MDTH according to day of illness, for influenza patients stratified by severity of illness. (b) Bacterial MDTH according to day of illness, for influenza patients stratified by severity of illness. (c) Viral MDTH according to day of illness, for influenza patients stratified by presence (Bac+, n=39; 63 samples) or absence (Bac-, n=34; 52 samples) of clinically significant bacterial co-infections. (d) Bacterial MDTH according to day of illness, for influenza patients stratified by presence (Bac+, n=39; 63 samples) or absence (Bac-, n=34; 52 samples) of clinically significant bacterial co-infections. (e) Viral MDTH according to blood procalcitonin levels, for influenza patients stratified by presence (Bac+, n=39; 63 samples) or absence (Bac-, n=34; 52 samples) of clinically significant bacterial co-infections. (f) Bacterial MDTH according to blood procalcitonin levels, for influenza patients stratified by presence (Bac+, n=39; 63 samples) or absence (Bac-, n=34; 52 samples) of clinically significant bacterial co-infections.
Figure 5
Figure 5. Levels of selected mediators in different compartments according to severity of illness and clinical designation of probable bacterial co-infection status.
Serum, nasopharyngeal aspirate (NPA) and nasabsorption eluates were obtained from influenza patients at T1, and from adult healthy controls. Results are shown for IL-1β (a, b, c), IL-6 (d, e, f), CXCL8 (g, h, i), and IFN-α2a (j, k, l). For each mediator box plot, the central line shows the median mediator level (pg/mL, log scale) and the box margins show the interquartile range; outer bars show the range. Zero values and values below the lower limit of detection were assigned half the geometric mean lower limit of detection for display purposes. The upper limit of detection for all assays was 2500 pg/mL. Kruskal-Wallis test with Dunn’s post test was used to assess significance (*** p<0.001; ** p<0.01; * p<0.05; NS = not significant). Severity of illness at T1 is shown. HC = healthy controls. Serum samples for HCs and participants with severity 1, 2, and 3 illness (a, d, g, and j): n = 36, 58, 43, and 31, respectively. NPA samples for healthy controls and participants with severity 1, 2, and 3 illness (b, e, h and k): n = 35, 50, 32, and 27, respectively. Nasabsorption eluate samples for healthy controls and participants with severity 1, 2, and 3 illness (c, f, i and l): n = 36, 60, 43, and 30, respectively.
Figure 6
Figure 6. Relationships between severity of illness, bacterial infection, and selected mediators.
Levels (pg/ml) of CXCL10 and IL-6 in serum (a-d) and NPA (e-h) according to day of illness at both the first and second sampling time-points (T1 and T2). Patients were stratified according to severity of illness (a, b, e, f) and by presence (Bac+; 39 subjects, 63 samples) or absence (Bac-; 34 subjects, 52 samples) of proven bacterial infection (c, d, g, h). Loess fitting was used to demonstrate time trends of mean values interpolated non-parametrically from the data (solid lines); dashed lines show the estimated 95% confidence interval values of the mean. Statistical significance of differences was calculated using Chi-squared tests to compare the deviance of generalized linear models.

Comment in

  • Influenza's signature move.
    Tough DF. Tough DF. Nat Immunol. 2018 Jun;19(6):518-520. doi: 10.1038/s41590-018-0115-1. Nat Immunol. 2018. PMID: 29777225 No abstract available.

References

    1. Stöhr K. Preventing and treating influenza. BMJ. 2003;326:1223–1224. - PMC - PubMed
    1. Hayward AC, et al. Comparative community burden and severity of seasonal and pandemic influenza: results of the Flu Watch cohort study. The Lancet Respiratory medicine. 2014;2:445–454. - PMC - PubMed
    1. Dawood FS, et al. Estimated global mortality associated with the first 12 months of 2009 pandemic influenza A H1N1 virus circulation: a modelling study. The Lancet infectious diseases. 2012;12:687–695. - PubMed
    1. Bautista E, et al. Clinical aspects of pandemic 2009 influenza A (H1N1) virus infection. The New England journal of medicine. 2010;362:1708–1719. - PubMed
    1. Hui DS, Lee N, Chan PK. Clinical management of pandemic 2009 influenza A(H1N1) infection. Chest. 2010;137:916–925. - PMC - PubMed

Publication types