. 2018 Jul 5;26(7):1756-1770.
doi: 10.1016/j.ymthe.2018.04.022. Epub 2018 Apr 27.

Local Immunomodulation with Anti-inflammatory Cytokine-Encoding Lentivirus Enhances Functional Recovery after Spinal Cord Injury

Affiliations

Local Immunomodulation with Anti-inflammatory Cytokine-Encoding Lentivirus Enhances Functional Recovery after Spinal Cord Injury

Jonghyuck Park et al. Mol Ther. .

Abstract

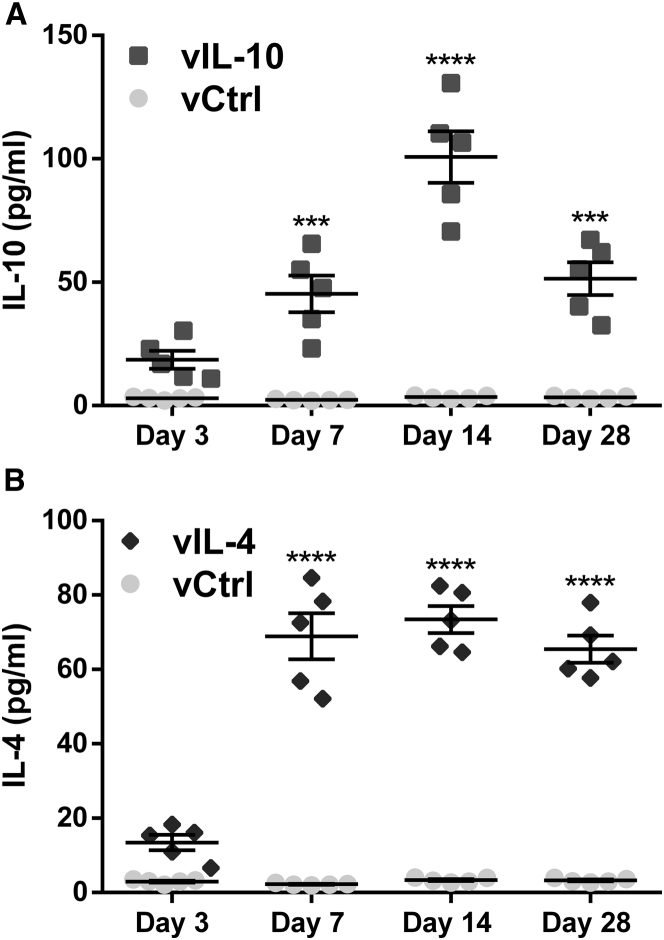
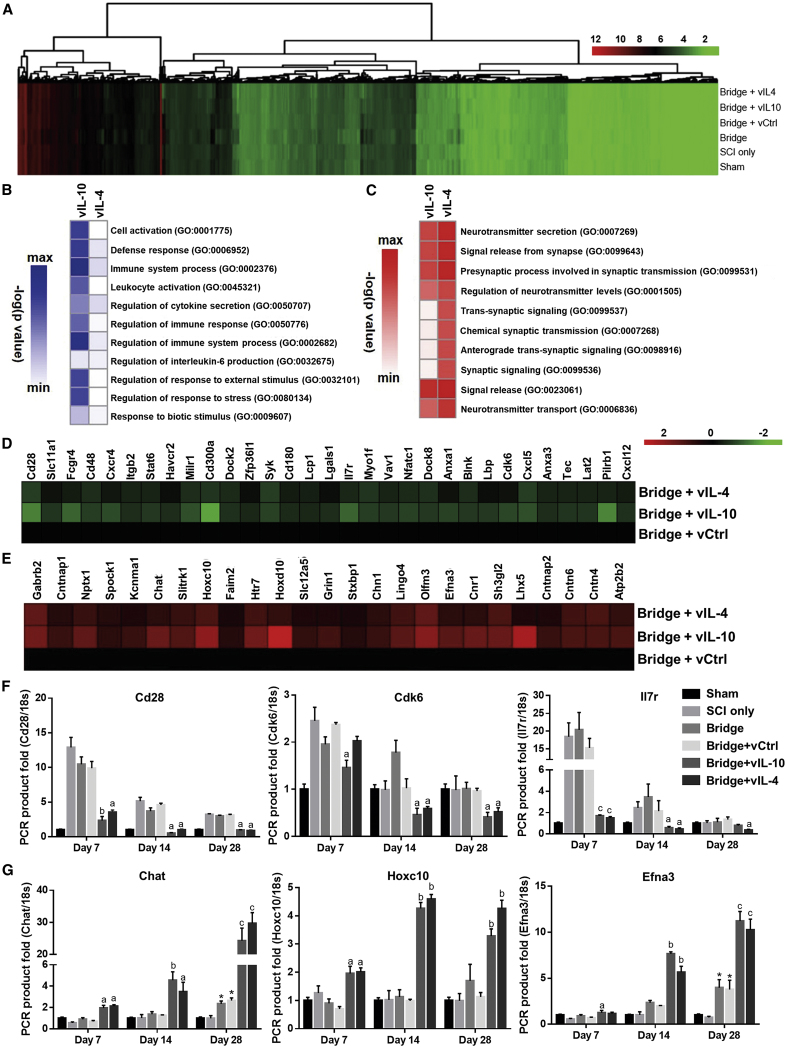
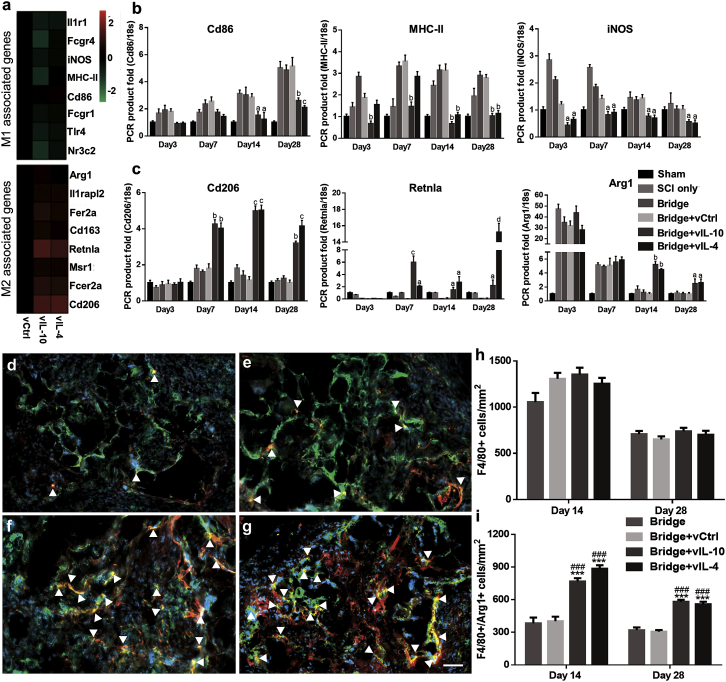
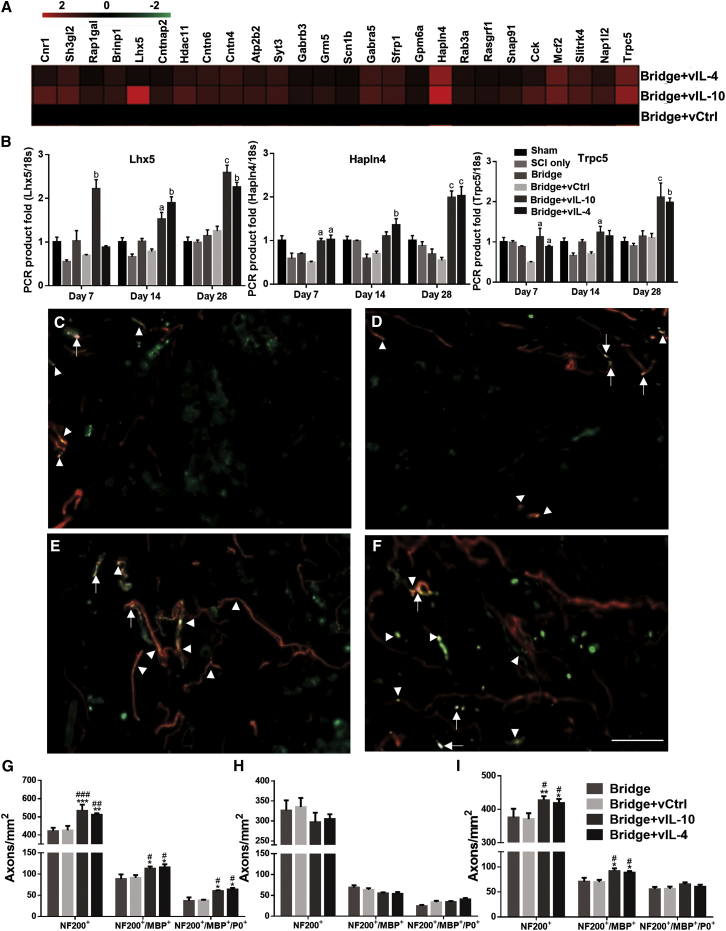
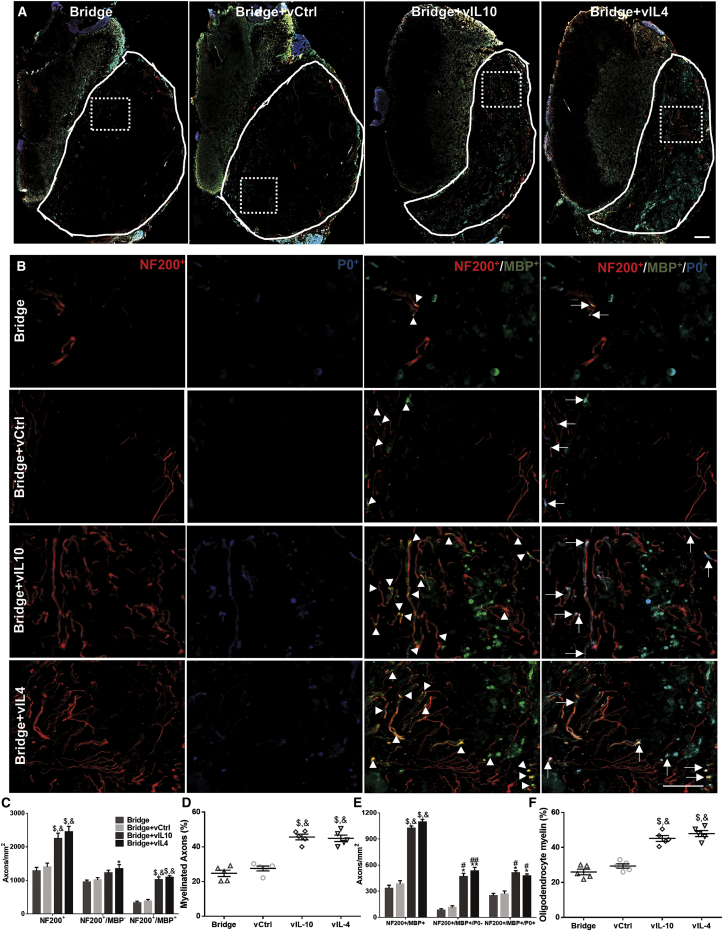
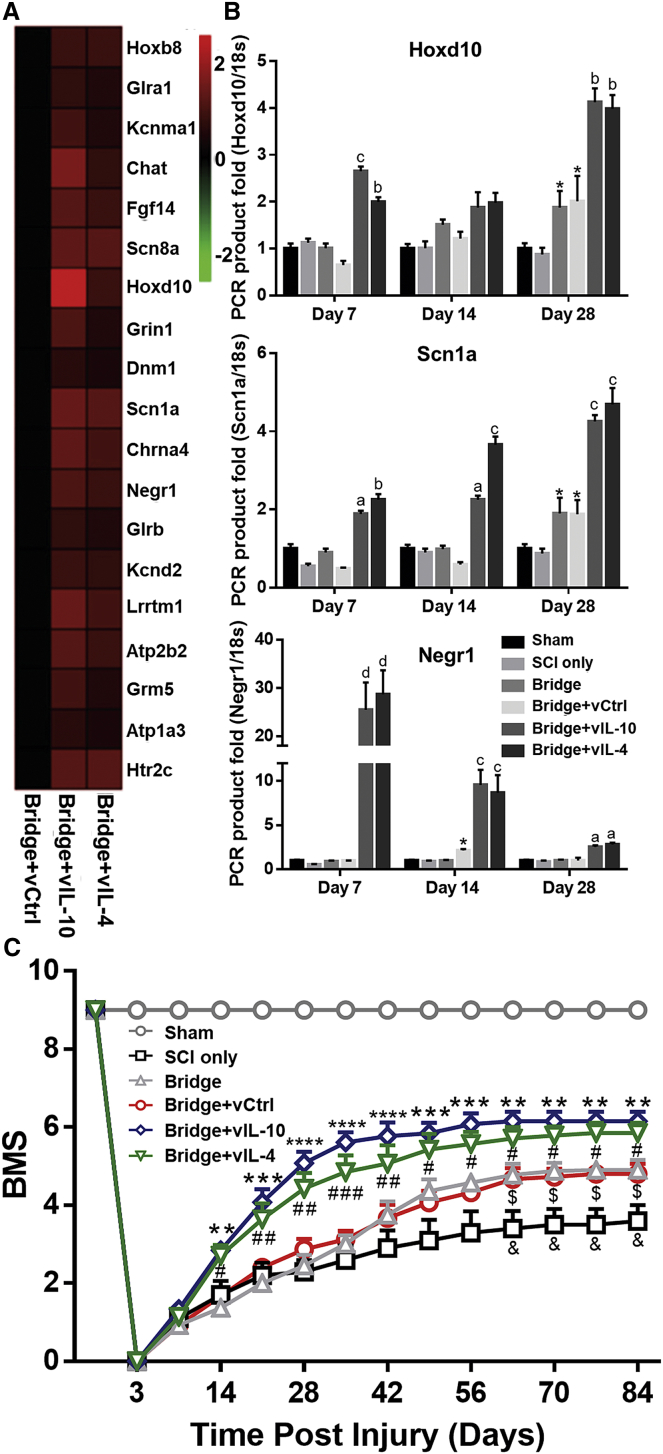
Trauma to the spinal cord and associated secondary inflammation can lead to permanent loss of sensory and motor function below the injury level, with the resulting environment serving as a barrier that limits regeneration. In this study, we investigate the localized expression of anti-inflammatory cytokines IL-10 and IL-4 via lentiviral transduction in multichannel bridges. Porous multichannel bridges provide physical guidance for axonal outgrowth with the cytokines hypothesized to modulate the neuroinflammatory microenvironment and enhance axonal regeneration. Gene expression analyses indicated that induced IL-10 and IL-4 expression decreased expression of pro-inflammatory genes and increased pro-regenerative genes relative to control. Moreover, these factors led to increased numbers of axons and myelination, with approximately 45% of axons myelinated and the number of oligodendrocyte myelinated axons significantly increased by 3- to 4-fold. Furthermore, the combination of a bridge with IL-10 and IL-4 expression improved locomotor function after injury to an average score of 6 relative to an average score of 3 for injury alone. Collectively, these studies highlight the potential for localized immunomodulation to decrease secondary inflammation and enhance regeneration that may have numerous applications.

Keywords: anti-inflammatory cytokines; immunoengineering; lentiviral gene delivery; multichannel bridge; spinal cord injury.


Figures

Figure 1
Figure 1
Delivered Anti-inflammatory Cytokines from Multichannel Bridge Transduce In Vivo Host Cells and Promote a Sustained Release of Transgenes The protein expression levels from spinal cord were quantified by ELISA as a function of time. The expression levels of protein started to increase significantly at day 7 post-SCI compared with vCtrl in both (A) vIL-10 and (B) vIL-4 delivery groups. A two-way ANOVA followed by Šidák correction for the multiple comparisons, ***p < 0.001, ****p < 0.0001, compared with vCtrl (mean±SEM, n = 5/group).
Figure 2
Figure 2
Anti-inflammatory Cytokines Modulate Microenvironment after SCI (A) Microarray data for spinal cord 7 days post-injury in all conditions. (B and C) Ten representative significant ontologies for both vIL-10 and vIL-4 from genes downregulated (B) or upregulated (C) more than 2-fold from vCtrl. Gene ontology (GO) accession numbers were also presented. As examples, (D) downregulated genes associated with immune system process (GO: 0002682) in the leukocyte activation gene ontology, and (E) upregulated genes associated with chemical synaptic transmission (GO: 0007268) ontology were presented. (F and G) Real-time qPCR for selected genes from the immune system process (F), and the chemical synaptic transmission (G) ontologies over time. A two-way ANOVA with Tukey’s post hoc test for the multiple comparisons. ap < 0.05, bp < 0.01, and cp < 0.001 compared with vCtrl, and *p < 0.05 compared with SCI only (mean±SEM, n = 5–6/group and time point).
Figure 3
Figure 3
Anti-inflammatory Cytokines Control Macrophage Activation, Differentiation, and Polarization (A) cDNA microarray heatmaps show clustering of M1- and M2-associated genes at day 7 post-SCI. (B and C) Real-time qPCR confirms increase or decrease in selected (B) M1 and (C) M2 markers as a function of time. (D–G) Immunodetection of F4/80+/arginase+/Hoechst+ macrophages (yellow, white arrowheads) in (D) empty bridge, (E) bridge+vCtrl, (F) bridge+vIL-10, and (G) bridge+vIL-4 group at day 14 post-SCI (scale bar, 50 μm). (H) The density of total F4/80+ macrophages at 14 and 28 days post-SCI within the bridge. (I) The density of M2 macrophages (F4/80+/arginase1+/Hoechst+). A two-way ANOVA followed by Tukey’s post hoc test where ap < 0.05, bp < 0.01, cp < 0.001, and dp < 0.0001 compared with vCtrl for real-time qPCR; ***p < 0.001 compared with vCtrl; and ###p < 0.001 compared with Bridge only for immunofluorescence (mean ± SEM, n = 5–6/group and time point).
Figure 4
Figure 4
Axonal Regrowth and Remyelination in the Sub-acute Phase of SCI by Anti-inflammatory Cytokines (A and B) The alterations of neural system development (GO:0007399)-associated gene expression was investigated via microarray and real-time qPCR. Tissue sections were stained using NF200 (axons), an anti-myelin basic protein (MBP) (all myelin), and myelin protein zero (P0) (Schwann cell-derived myelination). Immunofluorescence of myelinated total axons (NF200+/MBP+/P0+) with (C) empty bridge, (D) vCtrl, (E) vIL-10, or (F) vIL-4 delivery at the rostral location (scale bar, 30 μm). White arrowheads indicate all myelinated axons (NF200+/MBP+), and white arrows show myelinated axons by Schwann cells (NF200+/MBP+/P0+). (G–I) Quantification of total number of axons, myelinated axons, and Schwann cell-derived myelinated axons at 28 days post-bridge implantation from the (G) rostral (300 μm), (H) middle (900 μm), and (I) caudal (1,600 μm) regions. For the statistical analysis, a two-way ANOVA with Tukey’s post hoc test was used. ap < 0.05, bp < 0.01, and cp < 0.001 compared with vCtrl for real-time qPCR (mean±SEM, n = 5–6/group and time point); *p < 0.05, **p < 0.01, and ***p < 0.001 compared with vCtrl; and #p < 0.05, ##p < 0.01, and ###p < 0.001 relative to empty bridge for immunofluorescence (mean±SEM, n = 5/group).
Figure 5
Figure 5
Axonal Regrowth and Remyelination, and Source of Myelination in the Chronic Phase of SCI (Day 84) (A and B) Immunofluorescence of myelinated axons from the implanted area delivering empty bridge, vCtrl, vIL-10, and vIL-4 at the rostral area (scale bar, 50 μm) (A). The line indicates the implanted bridge area for quantification, and dashed line is for higher magnification area in (B). White arrowheads indicate NF200+/MBP+ axons, and white arrows show NF200+/MBP+/P0+ axons. (C) Quantification of total number of axons (NF200+), unmyelinated axons (NF200+/MBP), and myelinated axons (NF200+/MBP+) in each condition. (D) Percentage of axons that was myelinated within the bridge area. (E) Source of myelination in the chronic phase. Total quantification of oligodendrocyte-derived myelinated axons (NF200+/MBP+/P0) and Schwann cell-derived myelinated axons (NF200+/MBP+/P0+) in all conditions. (F) Percentage of axons that was myelinated by oligodendrocytes. The statistical test was completed using a one- or two-way ANOVA with Tukey’s post hoc test where *p < 0.05, **p < 0.01, and $p < 0.0001 compared with vCtrl group, and #p < 0.05, ##p < 0.01, and &p < 0.0001 compared with bridge only group; mean±SEM and n = 5/group.
Figure 6
Figure 6
Locomotor Functional Recovery after SCI (A) cDNA microarray heatmap shows that vIL-10 and vIL-4 upregulate locomotor recovery (GO:0007626)-associated gene expression relative to vCtrl. (B) Selected genes for cluster were validated via real-time qPCR over time. ap < 0.01, bp < 0.01, cp < 0.001, and dp < 0.0001 compared with vCtrl and *p < 0.05 compared with SCI only (n = 5–6/group and time point, mean±SEM, two-way ANOVA and Tukey post hoc test). (C) The ipsilateral hindlimb locomotor function was tested for the BMS weekly for 12 weeks after SCI. **p < 0.01, ***p < 0.001, and ****p < 0.0001 Bridge+vIL-10 versus Bridge+vCtrl; #p < 0.05, ##p < 0.01, and ###p < 0.001 Bridge+vIL-4 versus Bridge+vCtrl; $p < 0.05 Bridge versus SCI only; and &p < 0.05 Bridge+vCtrl versus SCI only (n = 15/group, mean±SEM, a two-way ANOVA with Dunnett’s post hoc test).

References

    1. Park J., Lim E., Back S., Na H., Park Y., Sun K. Nerve regeneration following spinal cord injury using matrix metalloproteinase-sensitive, hyaluronic acid-based biomimetic hydrogel scaffold containing brain-derived neurotrophic factor. J. Biomed. Mater. Res. A. 2010;93:1091–1099. - PubMed
    1. Blesch A., Tuszynski M.H. Spinal cord injury: plasticity, regeneration and the challenge of translational drug development. Trends Neurosci. 2009;32:41–47. - PubMed
    1. Chen Z., Park J., Butler B., Acosta G., Vega-Alvarez S., Zheng L., Tang J., McCain R., Zhang W., Ouyang Z. Mitigation of sensory and motor deficits by acrolein scavenger phenelzine in a rat model of spinal cord contusive injury. J. Neurochem. 2016;138:328–338. - PMC - PubMed
    1. Yiu G., He Z. Glial inhibition of CNS axon regeneration. Nat. Rev. Neurosci. 2006;7:617–627. - PMC - PubMed
    1. David S., López-Vales R., Wee Yong V. Harmful and beneficial effects of inflammation after spinal cord injury: potential therapeutic implications. Handb. Clin. Neurol. 2012;109:485–502. - PubMed

Publication types

MeSH terms