. 2018 May 23;6(5):555-568.e7.
doi: 10.1016/j.cels.2018.04.011. Epub 2018 May 16.

Interrogation of Mammalian Protein Complex Structure, Function, and Membership Using Genome-Scale Fitness Screens

Affiliations

Interrogation of Mammalian Protein Complex Structure, Function, and Membership Using Genome-Scale Fitness Screens

Joshua Pan et al. Cell Syst. .

Abstract

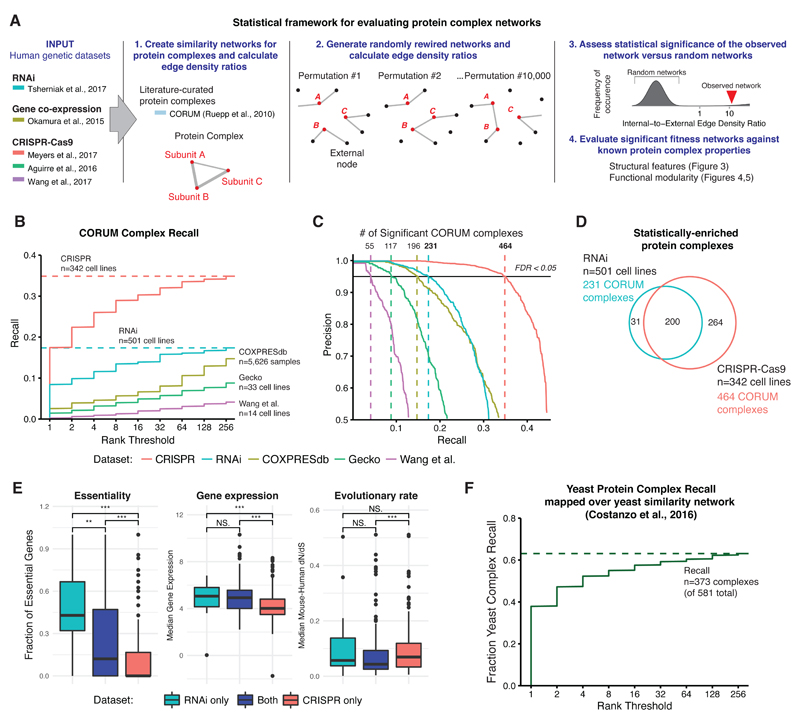
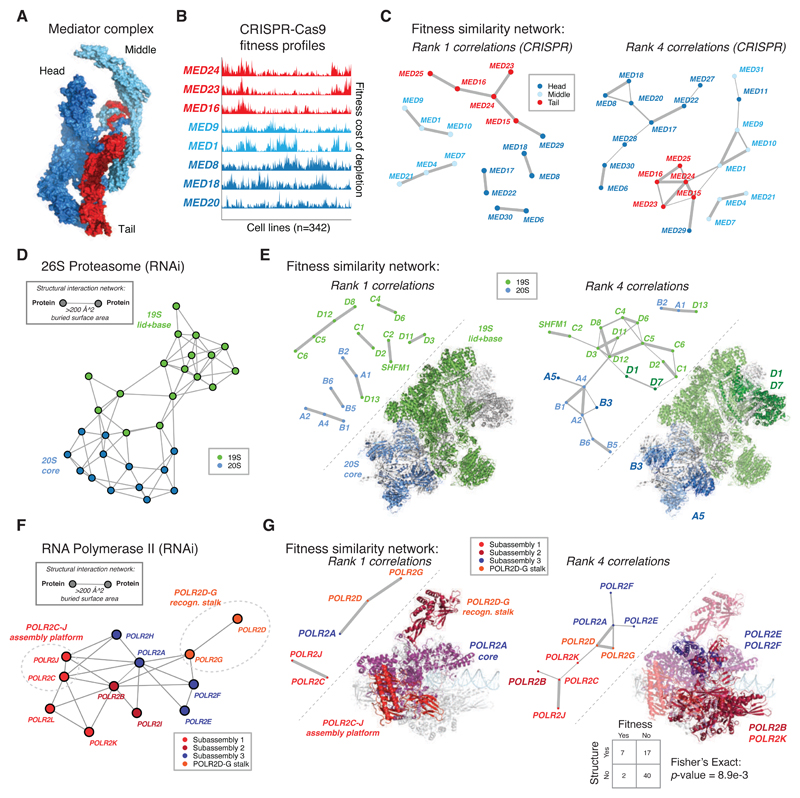
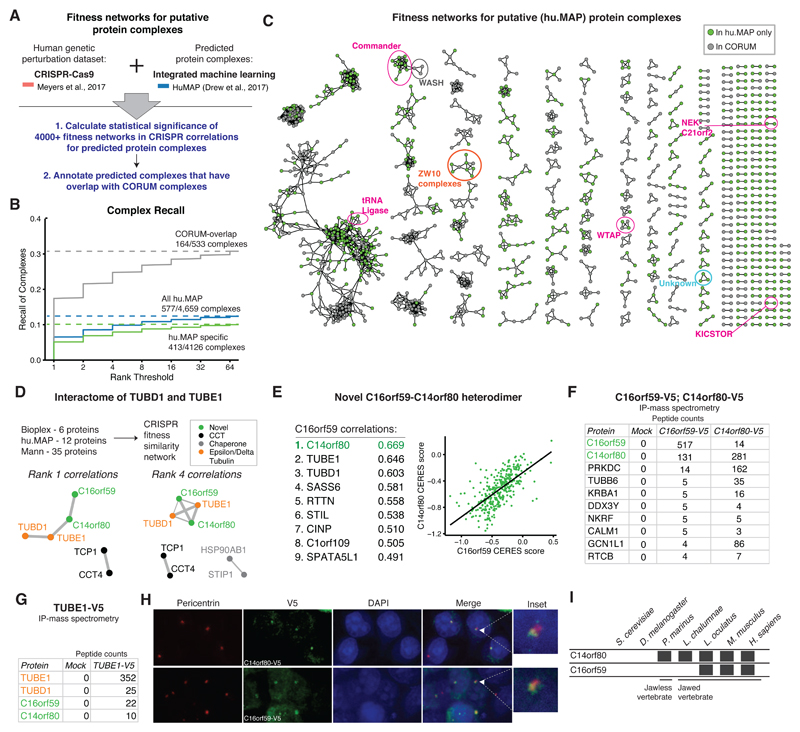
Protein complexes are assemblies of subunits that have co-evolved to execute one or many coordinated functions in the cellular environment. Functional annotation of mammalian protein complexes is critical to understanding biological processes, as well as disease mechanisms. Here, we used genetic co-essentiality derived from genome-scale RNAi- and CRISPR-Cas9-based fitness screens performed across hundreds of human cancer cell lines to assign measures of functional similarity. From these measures, we systematically built and characterized functional similarity networks that recapitulate known structural and functional features of well-studied protein complexes and resolve novel functional modules within complexes lacking structural resolution, such as the mammalian SWI/SNF complex. Finally, by integrating functional networks with large protein-protein interaction networks, we discovered novel protein complexes involving recently evolved genes of unknown function. Taken together, these findings demonstrate the utility of genetic perturbation screens alone, and in combination with large-scale biophysical data, to enhance our understanding of mammalian protein complexes in normal and disease states.

Keywords: fitness correlations; genetic perturbation screens; mammalian SWI/SNF; protein complexes; shRNA and CRISPR/Cas9-based genetic screens.


Figures

Figure 1
Figure 1. Genes encoding protein complex subunits display coordinated fitness variation across genetic screens performed in human cancer cell lines.
(A) Schematic of normal and perturbed protein complex biogenesis. (B) Fitness profiles for genes encoding subunits of five different protein complexes screened in the CRIPSR-Cas9 fitness dataset, annotated by their gene name abbreviations and cellular localization. Both rows (genes) and columns (cell lines) are hierarchically clustered. (C) Graphical representation of RNAi- and CRISPR-Cas9-based screening datasets and analysis pipelines (n=501 and n=342 cell lines, respectively; Project Achilles, Broad Institute).
Figure 2
Figure 2. A statistical framework for nominating significant protein complex fitness correlation networks.
(A) Overview of the statistical framework for identifying significant protein complex fitness correlation networks (see Figure S2). (B) Fraction of human protein complexes recalled at FDR < 0.05 in fitness correlation datasets (RNAi, CRISPR, Gecko and Wang et al.) and a gene expression correlation dataset (COXPRESdb), plotted against a log range of rank correlation thresholds. Fraction of CORUM complex recall is defined as the fraction of CORUM protein complexes (n=1286) that exhibit correlations at or below that rank threshold. (C) Precision-recall curve for the protein complexes in each dataset. (D) Venn diagram depicting overlap between CORUM protein complexes statistically enriched with top-ranked correlations in CRISPR and RNAi datasets. (E) Biologic properties of protein complexes with significant correlations in RNAi, CRISPR, or both datasets (Wilcoxon rank sum test, ** p < 1e-2, *** p < 1e-3, N.S. = not significant). (F) Statistical framework in (A) applied to a yeast correlation dataset derived from a genome-scale pairwise interaction map (Costanzo et al., 2016). A cumulative total of 373 yeast protein complexes with statistically significant fitness networks were recalled at rank 256, representing 64.2% of total yeast protein complexes.
Figure 3
Figure 3. Fitness correlation networks highlight functional modules of protein complexes with solved structures.
(A) The Mediator complex (PDB 5U0P) is a modular complex composed of functionally distinct sub-assemblies (Head, Middle and Tail modules). (B) Fitness profiles from the CRISPR-Cas9 dataset of representative subunits of the Mediator complex Head, Middle and Tail modules, colored as in (A). Both rows (genes) and columns (cell lines) are hierarchically clustered. (C) CRISPR-Cas9 fitness correlation network for Mediator complex, with subunits colored by module membership, and edges between nodes thresholded either at rank one (left) or rank four (right). (D) The 26S proteasome is composed of the 20S core and 19S regulatory particles, shown here as modules in a structural interaction network, in which each node represents a subunit and each edge represents a physical interaction (buried surface area, Å^2) between subunits in the solved structure (PDB 5GJR). (E) Fitness correlation networks in the RNAi dataset at different fitness rank thresholds reflect the sub-complex structural organization of the proteasome. Sequentially including edges across rank levels reveals edges preferentially linking genes within the same sub-complex. Proteasome subunit names are abbreviated to their shortest identifying sequence (ex: PSMA1 -> A1). (F) The RNA polymerase II complex (PDB 5FLM), represented as a structural interaction network. The protein complex is composed of four distinct subassemblies, in particular, two functionally obligate heterodimeric subunits: the assembly core (POLR2C-J) and the detachable recognition stalk (POLR2D-G). (G) The fitness correlation network for RNA Pol II in the RNAi dataset at different rank thresholds. The overlap between structural edges and functional edges present between protein complex subunits is statistically significant (Fisher’s Exact Test, p-value = 8.9e-3).
Figure 4
Figure 4. Fitness correlation mapping identifies biochemically distinct modules of mammalian SWI/SNF complexes.
(A) Schematic depicting subunits of the mammalian SWI/SNF family of ATP-dependent chromatin remodeling complexes. (B) Fitness correlation network (from RNAi dataset) between mSWI/SNF subunits resolves three functional modules: core BAF (SMARCA4, ARID1A, SMARCB1 and SMARCE1), PBAF (PBRM1, ARID2, BRD7, PHF10) and a novel functional module that contains two previously characterized subunits (SMARCD1, BRD9) and one putative subunit (GLTSCR1). (C) Hierarchical clustering performed on fitness profile correlations from the RNAi dataset groups subunits into distinct modules. (D) Density sedimentation experiments using 10-30% glycerol gradients performed on nuclear extracts from CCRF cells links two functional modules to known complexes, BAF (blue bar) and PBAF (red bar), and one to a novel assembly of distinct size and composition (green bar). (E) Rare cancers characterized by mSWI/SNF perturbations exhibit mutually exclusive loss of one of the BAF core module genes or paralog families (containing SMARCA4, ARID1A, SMARCB1, SMARCE1). SCCOHT = small cell carcinoma of the ovary, hypercalcemic type. In addition, specific intellectual disability syndromes are caused by heterozygous mutations in BAF core module genes. i
Figure 5
Figure 5. A combined physical-functional interaction map highlights validated and novel interactions.
(A) Strategy for the generation of fitness similarity networks for putative protein complexes. The statistical framework for identifying significant protein complex fitness correlation networks (Figure 2A) was applied to the hu.MAP complex dataset. Hu.MAP exhibits high level of complex enrichment within the CRISPR-Cas9 correlation dataset (Figure S1E). (B) Fraction of hu.MAP protein complexes (interactions) recalled in the CRISPR fitness correlation datasets. Of the 4,659 predicted complexes, 577 exhibit significant fitness networks. (C) Statistically significant fitness correlation networks for hu.MAP complexes. Recently discovered protein complexes consisting of genes of unknown function are highlighted in magenta, and complexes with novel components that were selected for validation are labeled in orange and blue. Proteins found in the Core CORUM set are marked in gray, while proteins unique to the hu.MAP complex list are marked in green. (D) In order to discover novel elements of the epsilon- and delta-tubulin interactome, 53 putative TUBE1 and TUBD1 interactors from three different large-scale protein-protein interaction networks were assembled and used to generate a fitness similarity network from the CRISPR-Cas9 dataset. Out of all 53 putative interactors, only two proteins, C16orf59 and C14orf80, exhibited top ranked correlations with TUBE1 and TUBD1. (E) Proteins exhibiting top ranked fitness correlations with C16orf59 are predominantly centrosomal. The top ranked correlation to C16orf59 is with another gene of unknown function, C14orf80. A scatterplot showing the correlation between CRISPR-Cas9 CERES scores of the C16orf59 and C14orf80 proteins across 300+ cell lines is shown. (F) IP/mass-spectrometry results for V5-tagged C16orf59 and C14orf80 immunoprecipitations. Total peptide counts are indicated, ranked by overall abundance in the C16orf59 purification. (G) IP/mass spectrometry of transiently transfected epsilon-tubulin (TUBE1) co-precipitates TUBD1 as well as the C16orf59-C14orf80 heterodimer. (H) Immunofluorescence performed for pericentrin (centrosomal marker) and V5 (C14orf80 and C16orf59), with DAPI nuclear stain. Both proteins exhibit centrosomal localization. Panel magnification= 60X. (I) Evolutionary history of the C14orf80 and C16orf59 genes. Both are evolutionarily recent, with C16orf80 present only after the jawless-jawed vertebrate transition, while C14orf80 is present from jawless vertebrates forward.

Similar articles

Cited by

References

    1. Aguirre AJ, Meyers RM, Weir BA, Vazquez F, Zhang CZ, Ben-David U, Cook A, Ha G, Harrington WF, Doshi MB, et al. Genomic Copy Number Dictates a Gene-Independent Cell Response to CRISPR/Cas9 Targeting. Cancer Discovery. 2016;6:914–929. - PMC - PubMed
    1. Ahnert SE, Marsh JA, Hernandez H, Robinson CV, Teichmann SA. Principles of assembly reveal a periodic table of protein complexes. Science. 2015;350:aaa2245. - PubMed
    1. Baliga NS, Björkegren J, Boeke JD, Boutros M, Crawford N, Dudley AM, Farber CR, Jones A, Levey AI, Lusis AJ, et al. The State of Systems Genetics in 2017. Cell Systems. 2017;4:7–15. - PubMed
    1. Barretina J, Caponigro G, Stransky N, Venkatesan K, Margolin AA, Kim S, Wilson CJ, Lehár J, Kryukov GV, Sonkin D, et al. The Cancer Cell Line Encyclopedia enables predictive modelling of anticancer drug sensitivity. Nature. 2012;483:603–607. - PMC - PubMed
    1. Baryshnikova A, Costanzo M, Myers CL, Andrews B, Boone C. Genetic interaction networks: toward an understanding of heritability. Annual review of genomics and human genetics. 2013;14:111–133. - PubMed

Publication types

Substances

LinkOut - more resources