. 2018 May 23;6(5):579-592.e4.
doi: 10.1016/j.cels.2018.04.010. Epub 2018 May 16.

Defining Host Responses during Systemic Bacterial Infection through Construction of a Murine Organ Proteome Atlas

Affiliations

Defining Host Responses during Systemic Bacterial Infection through Construction of a Murine Organ Proteome Atlas

John D Lapek Jr et al. Cell Syst. .

Abstract

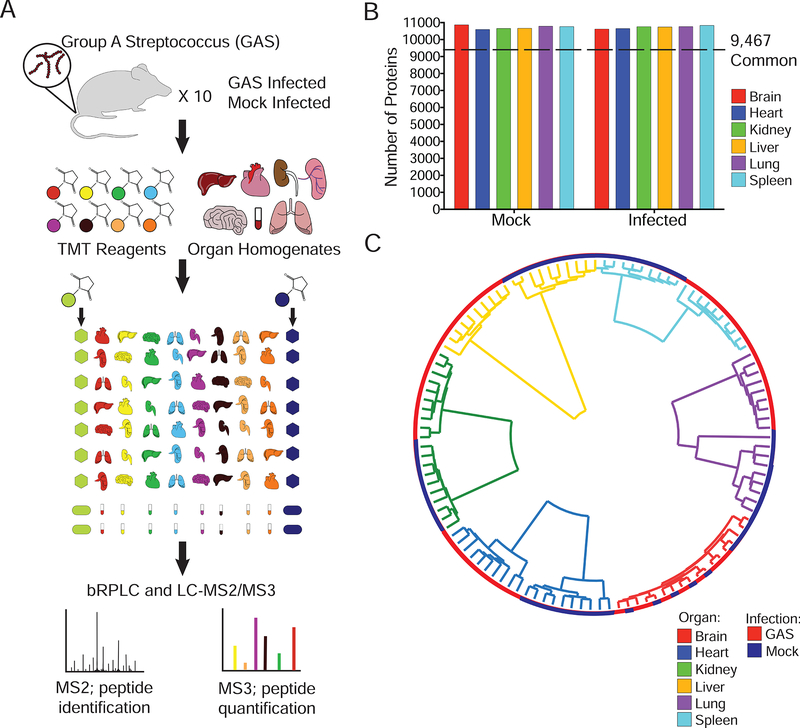
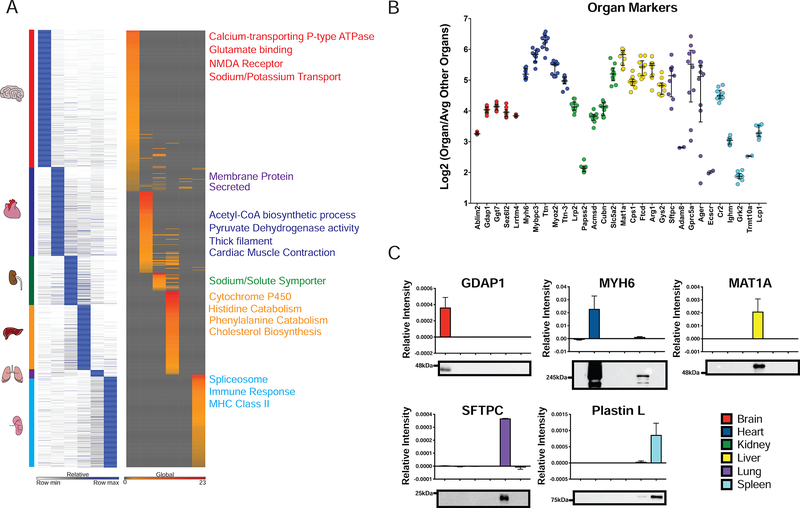
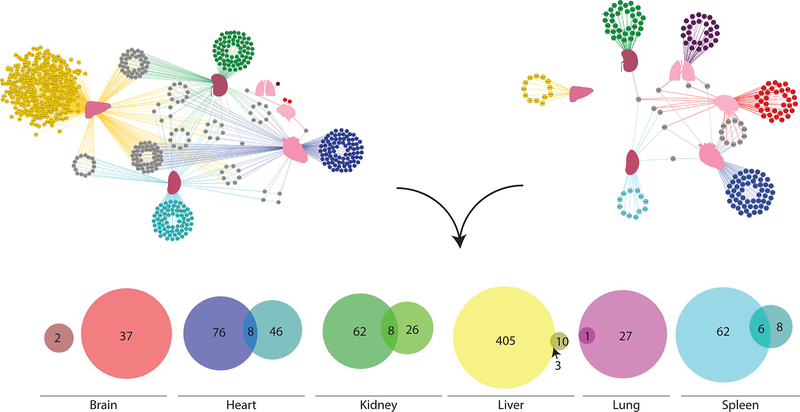
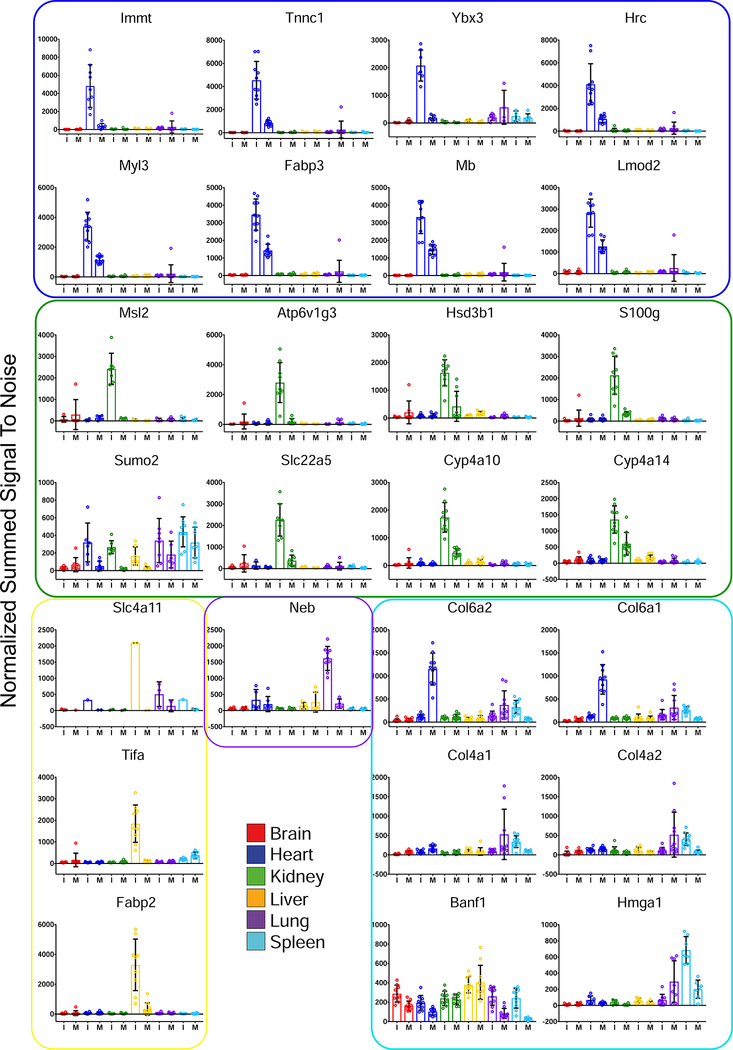
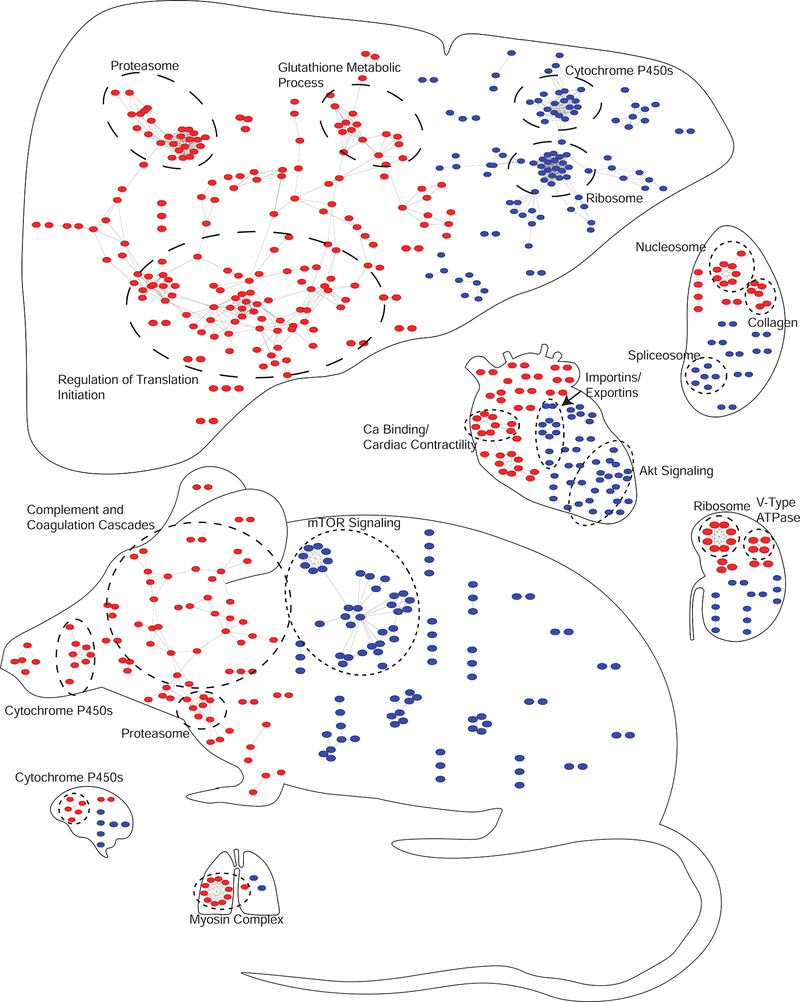
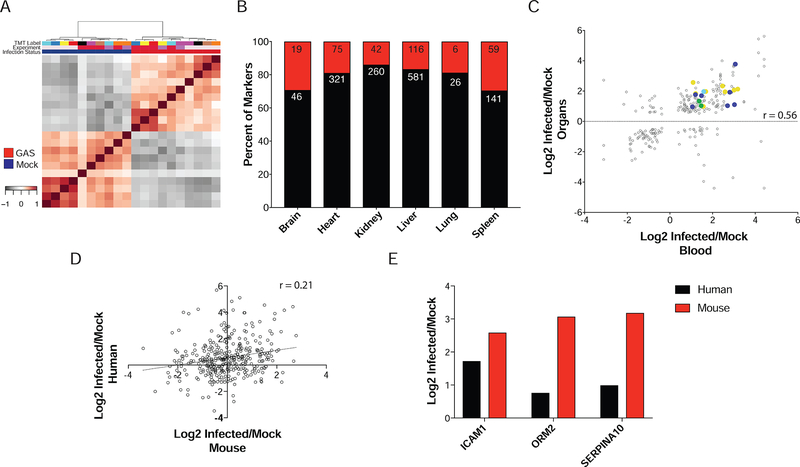
Group A Streptococcus (GAS) remains one of the top 10 deadliest human pathogens worldwide despite its sensitivity to penicillin. Although the most common GAS infection is pharyngitis (strep throat), it also causes life-threatening systemic infections. A series of complex networks between host and pathogen drive invasive infections, which have not been comprehensively mapped. Attempting to map these interactions, we examined organ-level protein dynamics using a mouse model of systemic GAS infection. We quantified over 11,000 proteins, defining organ-specific markers for all analyzed tissues. From this analysis, an atlas of dynamically regulated proteins and pathways was constructed. Through statistical methods, we narrowed organ-specific markers of infection to 34 from the defined atlas. We show these markers are trackable in blood of infected mice, and a subset has been observed in plasma samples from GAS-infected clinical patients. This proteomics-based strategy provides insight into host defense responses, establishes potentially useful targets for therapeutic intervention, and presents biomarkers for determining affected organs during bacterial infection.

Keywords: Orbitrap; S. pyogenes; Tandem Mass Tag; group A Streptococcus; multiplexed proteomics; systemic infection.


Conflict of interest statement

Declaration of Interests

All authors declare no competing interests.

Figures

Figure 1–
Figure 1–. Quantitative Proteomics of a Murine GAS Infection Model.
(A) 10 mice per group were GAS or mock infected. At 48 hours post tail vein injection, mice were sacrificed and organs (brain, liver, kidney, spleen, lungs, heart and blood) harvested. Samples were randomized for TMT labeling; blood processed separately. Bridge channels containing equal portions of each organ homogenate were used for normalization purposes. All 10plexes were subjected to MS2 peptide identification and MS3 quantification. (B) A total of 11396 proteins were quantified. Plotted is the total number of proteins per organ in mock and infected organs. A total of 9467 proteins were common to all organs and infection statuses. (C) Spearman rank correlation coefficients were used in hierarchical clustering of samples. Organ origin drives primary clustering (Inner trees). Infection status is represented by the external ring.
Figure 2–
Figure 2–. Signatures of Organs based on Protein Markers.
(A) Heatmap of OS markers. Markers were identified by calculating Log2 ratio of the specified organ/average of all other organs and ranked by π-score (α≤1×10⁻⁵) – Left panel. Heat map of GO terms associated with organ markers is plotted in the right panel. Representative GO terms are listed to the right of the GO plot. (B) Top five OS markers ranked by π-score are plotted. With log2(Organ/Average other organs) on the y-axis and whiskers represent median and interquartile range of the data. (C) Western Blot validation of indicated OS markers. Relative intensity was normalized to total protein loaded on each gel. Mean relative intensity and standard deviation are plotted (n=2), and a representative blot is shown below each plot.
Figure 3–
Figure 3–. Determination of OS Infection Markers.
Binary comparisons of infected vs mock were performed with BH FDR control at 1% and a twofold change were cut-offs for OS markers irrespective of directionality of fold-change. Markers were ranked by fold-change per organ. Proteins having a twofold change in multiple organs were considered systemic markers (protein network). Edges were colored according to organ of origin. In parallel, outlier analysis was performed for each organ, with log2 of fold-change of the organ relative to the mean of other organs plotted against the log2 of fold-change of the infected organ relative to the mean of other organs. Outliers were determined by the Tukey depth method. Proteins considered significant after BH correction were included in the analysis. Proteins having a twofold change in multiple organs were again considered systemic markers (protein network). Edges are colored according to organ of origin. Final markers were chosen based on the overlap of each statistical analysis (Venn diagrams). For simplicity, only upregulated proteins are depicted here, see Figure S5 for downregulated proteins.
Figure 4–
Figure 4–. Group A Streptococcus MSI.
Upregulated markers for infection are shown. Bars and data points are colored and grouped according to the organ of origin. Error bars represent standard deviation. Values plotted are normalized, summed signal-to-noise ratios. Proteins were defined from the overlap of the statistical methods (Figure 3). I – Infected and M – Mock.
Figure 5–
Figure 5–. Assembly of a Marker Atlas for Systemic GAS Infection.
Organs are scaled according to the number of nodes contained within each organ. Nodes contained within the mouse are systemic markers, or those common to multiple organs. Placement of the nodes in the mouse is arbitrary. Nodes present in the individual organs are specific to that organ. Nodes represent proteins from the union of the outlier and binary comparison analyses that were significant and exhibited at least a twofold up (red) or down (blue) change. String analysis was performed with up and downregulated proteins independently. Only proteins with multiple connections are shown (significance > 0.7, no missing partners). GO functionally enriched clusters are circled and labeled accordingly.
Figure 6–
Figure 6–. Proteome Analysis of Blood Reveals Traceability of Organ Markers.
(A) Spearman’s Correlation clustering stratifies samples into mock and GAS infected subtypes. No obvious batch effects were observed. (B) SignalP analysis of infection markers derived from organs shows approximately equal percentages of proteins containing secretion signals. Red are those containing signal peptides and black those without. The numbers in each section of the bar indicate the raw counts of proteins in each category. (C) Correlation between blood levels and organ levels for infection markers. Overall Pearson correlation coefficient was 0.56, with a total of 19 infection markers traceable in blood. Spots are colored by tissue of specificity. (D) General discordance between GAS infected human and mouse blood proteomes. Pearson correlation coefficient=0.21, (E) Highlighted markers observed in blood from patients with GAS infection.

Comment in

Similar articles

Cited by

References

    1. ABDILLAHI SM, BALVANOVIC S, BAUMGARTEN M & MORGELIN M (2012). Collagen VI encodes antimicrobial activity: novel innate host defense properties of the extracellular matrix. J Innate Immun, 4, 371–6. - PMC - PubMed
    1. AMMANN P, FEHR T, MINDER EI, GUNTER C & BERTEL O (2001). Elevation of troponin I in sepsis and septic shock. Intensive Care Med, 27, 965–9. - PubMed
    1. AQUILANO K, BALDELLI S & CIRIOLO MR (2014). Glutathione: new roles in redox signaling for an old antioxidant. Front Pharmacol, 5, 196. - PMC - PubMed
    1. ASHBAUGH CD, MOSER TJ, SHEARER MH, WHITE GL, KENNEDY RC & WESSELS MR (2000). Bacterial determinants of persistent throat colonization and the associated immune response in a primate model of human group A streptococcal pharyngeal infection. Cell Microbiol, 2, 283–92. - PubMed
    1. BABUIN L & JAFFE AS (2005). Troponin: the biomarker of choice for the detection of cardiac injury. CMAJ, 173, 1191–202. - PMC - PubMed

Publication types