. 2018 Sep:117:1-14.
doi: 10.1016/j.nbd.2018.05.008. Epub 2018 May 18.

Hereditary sensory neuropathy type 1-associated deoxysphingolipids cause neurotoxicity, acute calcium handling abnormalities and mitochondrial dysfunction in vitro

Affiliations

Hereditary sensory neuropathy type 1-associated deoxysphingolipids cause neurotoxicity, acute calcium handling abnormalities and mitochondrial dysfunction in vitro

Emma R Wilson et al. Neurobiol Dis. 2018 Sep.

Abstract

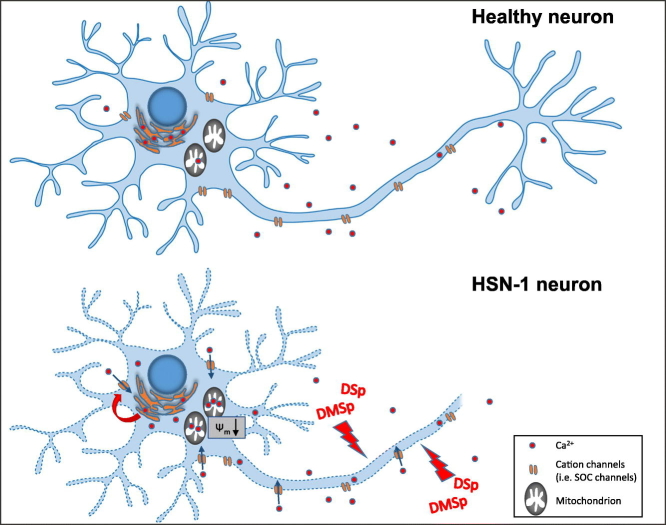
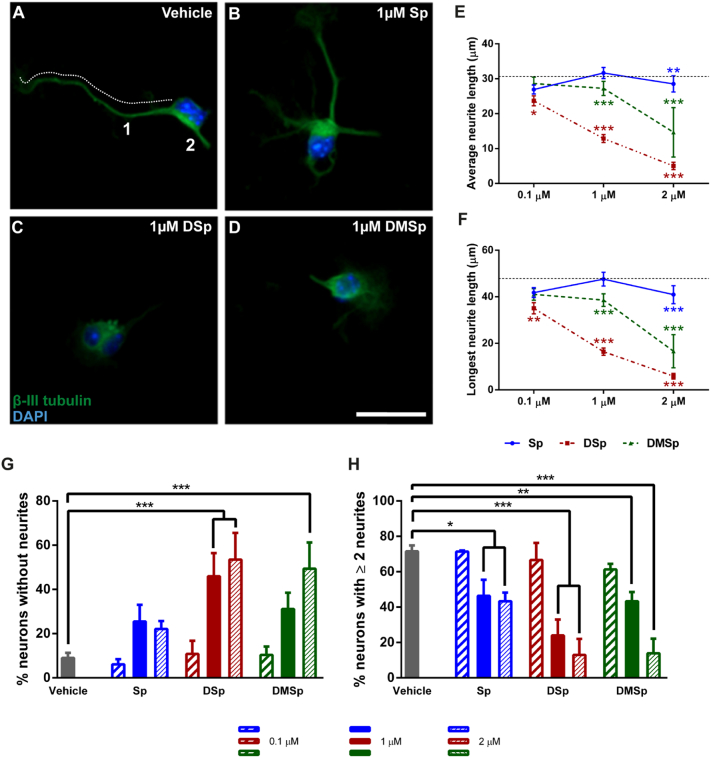
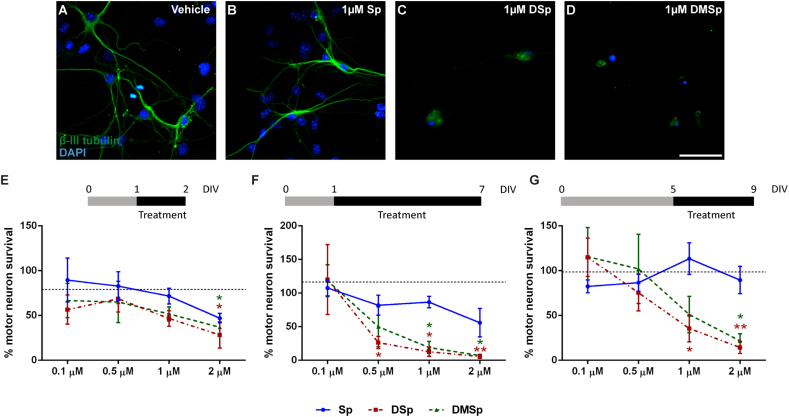
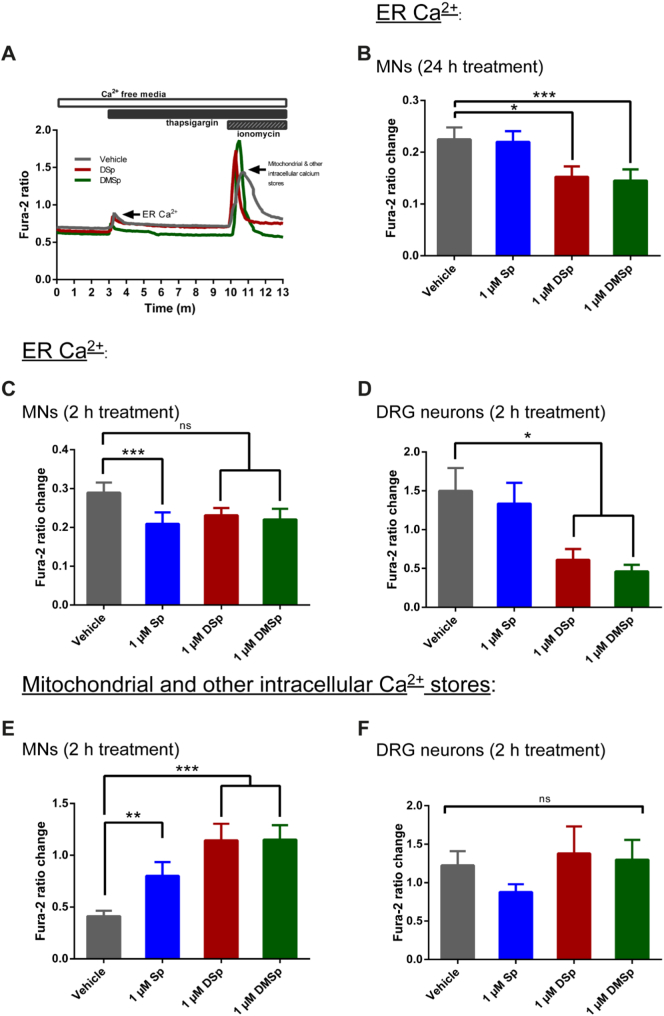
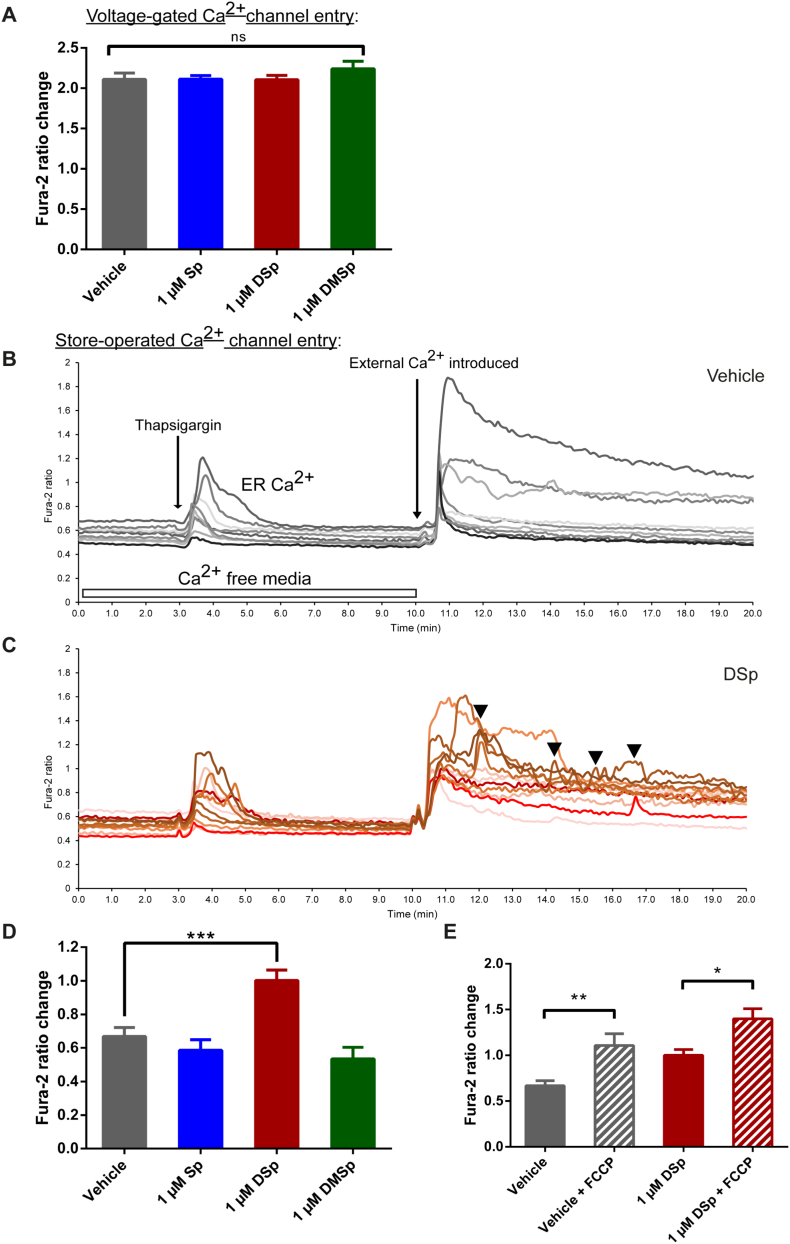
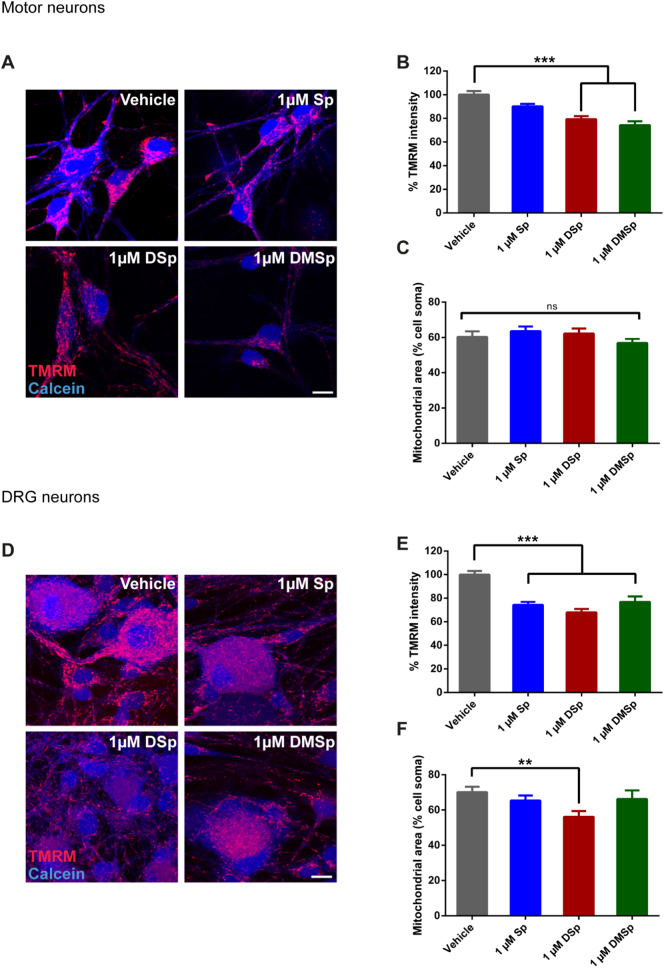
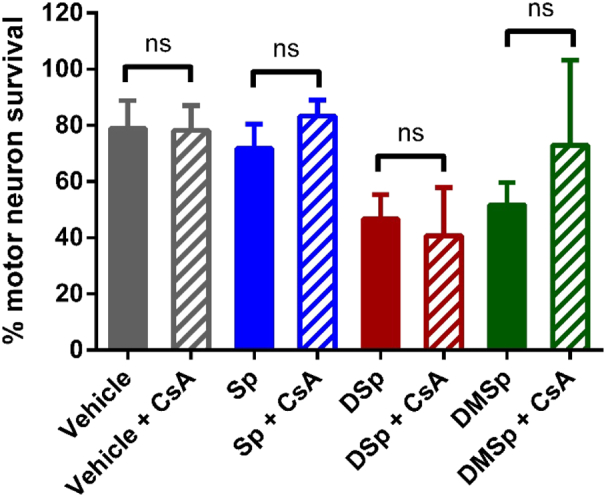
Hereditary sensory neuropathy type 1 (HSN-1) is a peripheral neuropathy most frequently caused by mutations in the SPTLC1 or SPTLC2 genes, which code for two subunits of the enzyme serine palmitoyltransferase (SPT). SPT catalyzes the first step of de novo sphingolipid synthesis. Mutations in SPT result in a change in enzyme substrate specificity, which causes the production of atypical deoxysphinganine and deoxymethylsphinganine, rather than the normal enzyme product, sphinganine. Levels of these abnormal compounds are elevated in blood of HSN-1 patients and this is thought to cause the peripheral motor and sensory nerve damage that is characteristic of the disease, by a largely unresolved mechanism. In this study, we show that exogenous application of these deoxysphingoid bases causes dose- and time-dependent neurotoxicity in primary mammalian neurons, as determined by analysis of cell survival and neurite length. Acutely, deoxysphingoid base neurotoxicity manifests in abnormal Ca2+ handling by the endoplasmic reticulum (ER) and mitochondria as well as dysregulation of cell membrane store-operated Ca2+ channels. The changes in intracellular Ca2+ handling are accompanied by an early loss of mitochondrial membrane potential in deoxysphingoid base-treated motor and sensory neurons. Thus, these results suggest that exogenous deoxysphingoid base application causes neuronal mitochondrial dysfunction and Ca2+ handling deficits, which may play a critical role in the pathogenesis of HSN-1.

Keywords: Deoxysphingolipid; ES-285; Endoplasmic reticulum; Mitochondria; Neuron; Peripheral neuropathy; Sphingolipid.


Figures

Unlabelled Image
Graphical abstract
Fig. 1
Fig. 1
Treatment with deoxysphingoid bases reduce neurite outgrowth in primary motor neurons, in a dose-dependent manner. (A-D) Primary MNs were grown for 24 h and then treated with either vehicle (ethanol) or with sphingoid bases. The number of neurites per neuron was counted as indicated and neurite length was measured by tracing neurites, as illustrated by the dotted line in (A). The cells were stained for DAPI (blue) and immunostained for β-III tubulin (green). Scale bar = 25 μm. Treatment with the deoxysphingoid bases reduces (E) the average neurite length, and (F) the average length of the longest neurite, in a dose-dependent manner. In E and F the black dotted line indicates the average or average longest neurite length of MNs treated with an ethanol vehicle control. These data are not normally distributed and thus displayed statistics indicate comparisons to vehicle control using Kruskal-Wallis (P < 0.001) and Dunn's multiple comparisons tests. Two-way ANOVA was also performed on the average neurite length (P < 0.001, concentration, P < 0.001, treatment, P < 0.001, interaction) and longest neurite length (P < 0.001, concentration, P < 0.001, treatment, P < 0.001, interaction). (G) The percentage of MNs with no neurite outgrowth following treatment with the sphingoid bases at a range of concentrations. The percentages of neurons with no neurite outgrowth were compared to vehicle controls using two-way ANOVA and Dunnett's multiple comparison test: P < 0.001, concentration, P < 0.001, treatment, P < 0.05, interaction. (H) The percentage of MNs with 2 or more neurites following treatment with the sphingoid bases at a range of concentrations. The percentages of neurons with no neurite outgrowth were compared to vehicle controls using two-way ANOVA and Dunnett's multiple comparison test: P < 0.001, concentration, P < 0.001, treatment, P < 0.001, interaction. Error bars represent S.E.M. P values: * < 0.05; ** < 0.01; *** < 0.001. n = 18–383 cells per condition, from 3 to 5 independent experiments.
Fig. 2
Fig. 2
Treatments with deoxysphingoid bases reduce survival of primary motor neurons, in a dose-dependent manner. (A-D) Representative images of primary MNs grown for 24 h before being treated with either (A) vehicle (ethanol) control, (B) Sp, (C) DSp or (D) DMSp. MNs were fixed and stained with DAPI (blue) and immunostained for β-III tubulin (green) 6 days following treatment, at 7 DIV. Scale bar = 50 μm. (E) MN survival following treatment at 1 DIV for 24 h, with different doses of sphingoid bases, expressed as a percentage relative to control. MN survival was compared to survival in vehicle treated cultures using two-way ANOVA and Dunnett's multiple comparison test: P < 0.05, concentration, P < 0.01, treatment, P = 0.792, interaction. (F) MN survival following treatment at 1 DIV for 6 days, with different doses of sphingoid bases, expressed as a percentage relative to the untreated control. MN survival was compared to survival in vehicle treated cultures using two-way ANOVA and Dunnett's multiple comparison test: P < 0.01, concentration, P < 0.001, treatment, P = 0.393, interaction. (G) MN survival following treatment at 5 DIV for 4 days, with different doses of sphingoid bases, expressed as a percentage relative to the untreated control. MN survival was compared to survival in vehicle treated cultures using two-way ANOVA and Dunnett's multiple comparison test: P < 0.01, concentration, P < 0.05, treatment, P < 0.05, interaction. The black dotted lines in E-G represent MN survival in vehicle treated cultures. Error bars represent S.E.M. P values: * < 0.05; ** < 0.01. n = 4–6 independent experiments per condition.
Fig. 3
Fig. 3
Treatments with deoxysphingoid bases cause depletion of ER Ca2+ and mitochondrial Ca2+ loading in neurons. (A) A typical trace (from a MN culture) indicating how thapsigargin and ionomycin were used to estimate ER and mitochondrial Ca2+ levels. (B) At 5–8 DIV, MNs were treated with either vehicle control (ethanol) or the sphingoid bases for 24 h prior to live cell imaging. Thapsigargin was used to estimate ER Ca2+. Average ER Ca2+ was established from 42 to 55 cells per condition, from 4 to 5 independent experiments. (P < 0.001, Kruskal-Wallis). (C) At 5–8 DIV, MNs were treated with either vehicle (ethanol) or the sphingoid bases for 2 h prior to live cell imaging, and as above, thapsigargin used to estimate the ER Ca2+. Average ER Ca2+ was established from 94 to 184 cells, from 11 to 16 independent experiments. (P = 0.003, Kruskal-Wallis). (D) At 3–5 DIV, DRG neurons were treated for 2 h with either vehicle control (ethanol) or the sphingoid bases for 24 h prior to live cell imaging. Thapsigargin was used to estimate ER Ca2+ and average ER Ca2+ was established from 28 to 38 cells, from 3 to 4 independent experiments. (P < 0.001, Kruskal-Wallis). (E) At 5–8 DIV, MNs were treated for 2 h prior to live cell imaging. Thapsigargin and ionomycin were used to estimate mitochondrial Ca2+. Average mitochondrial Ca2+ was established from 36 to 44 cells per condition, from 4 to 5 independent experiments. (P < 0.001, Kruskal-Wallis). (F) At 3–5 DIV, DRG cultures were treated with either vehicle control (ethanol) or the sphingoid bases for 2 h prior to live cell imaging. Mitochondrial Ca2+ was estimated as above, and average mitochondrial Ca2+ was established from 32 to 41 cells per condition, from 4 independent experiments. (P = 0.063, Kruskal-Wallis). Error bars represent S.E.M. For statistical comparison, each treatment group was compared to vehicle control using Kruskal-Wallis and Dunn's multiple comparisons tests. P values: * < 0.05; ** < 0.01; *** < 0.001.
Fig. 4
Fig. 4
Deoxysphingaine causes dysregulation of store-operated Ca2+ (SOC) channels. (A-E) At 5–8 DIV, MNs were treated with vehicle control or sphingoid bases 2 h prior to live cell imaging with fura-2. (A) High potassium was used to depolarize the plasma membrane potential and trigger opening of voltage-gated Ca2+ channels. Average membrane depolarization-induced Ca2+ influx per cell was calculated from 23 to 52 cells per condition, from 2 to 3 independent experiments. (P = 0.743, one-way ANOVA). (B-E) SOC channel entry was measured using thapsigargin and subsequent introduction of Ca2+ to the external recording medium. (B-C) Example traces showing SOC channel entry in vehicle (B) and DSp (C) treated cells. Each differentially shaded line represents a different cell. Arrowheads in Fig. 4C indicate subsequent influxes of Ca2+ following the initial SOC channel peak influx in the DSp-treated MNs. (D) Average Ca2+ entry through SOC channels was calculated from 36 to 97 cells per condition, from 5 to 9 independent experiments. (P < 0.001, Kruskal-Wallis). (E) SOC channel entry was measured with and without co-treatment with FCCP. The average SOC channel Ca2+ influx was established from 38 to 97 cells per condition, from 4 to 9 independent experiments. Error bars represent S.E.M. For statistical comparison, each treatment group was compared to vehicle control, unless otherwise indicated. Data following Gaussian distribution was compared to vehicle control using One-way ANOVA and Dunnett's multiple comparisons tests. Non-normally distrusted data was compared to vehicle control using Kruskal-Wallis and Dunn's multiple comparisons tests. Pairwise comparisons were made using Mann-Whitney tests. P values: * < 0.05; ** < 0.01; *** < 0.001.
Fig. 5
Fig. 5
Treatments with deoxysphingoid bases reduce the mitochondrial membrane potential. (A) At 5–8 DIV MNs were treated with sphingoid bases or vehicle control (ethanol) for 2 h prior to live cell imaging. (B) Average TMRM fluorescent intensities per cell were measured from 26 to 48 MNs per condition, from 3 independent experiments. (P < 0.001, one-way ANOVA). (C) The total mitochondrial area per MN cell body was also calculated and expressed as a percentage of the cell soma size. (P = 0.267, one-way ANOVA). (D) At 3–5 DIV DRG neurons were treated with vehicle control (ethanol) or sphingoid bases 2 h prior to live cell imaging. (E) Average TMRM fluorescent intensities per cell were measured from 29 to 61 cells, from 4 independent experiment. (P < 0.001, one-way ANOVA). (F) The total mitochondrial area per DRG cell body was also calculated and expressed as a percentage of the cell soma size. (P = 0.017, one-way ANOVA). Error bars represent S.E.M. For statistical comparison, each treatment group was compared to vehicle control. Data was compared to vehicle control using one-way ANOVA and Dunnett's multiple comparisons tests. ns = not significant. P values: * < 0.05; ** < 0.01; *** < 0.001. Scale bars = 10 μm.
Fig. 6
Fig. 6
Treatment with cyclosporine A (CsA) is not sufficient to rescue deoxysphingoid base mediated neuronal death. After 24 h in vitro, MNs were treated with either Sp, DSp or DMSp alone or in combination with 1 μM CsA. MNs were fixed 24 h following treatment, at 2 DIV, and stained with DAPI and β-III tubulin for analysis. MN survival is expressed as a percentage relative to untreated controls. Statistical analysis was performed using two-way ANOVA: P = 0.041, treatment, P = 0.491, CsA treatment, P = 0.741, interaction. N = 4–10 independent experiments per condition. Error bars represent S.E.M. ns = not significant.

Similar articles

Cited by

References

    1. Abramov A.Y., Duchen M.R. Actions of ionomycin, 4-BrA23187 and a novel electrogenic Ca2+ ionophore on mitochondria in intact cells. Cell Calcium. 2003;33:101–112. - PubMed
    1. Alecu I., Othman A., Penno A., Saied E.M., Arenz C., von Eckardstein A., Hornemann T. Cytotoxic 1-deoxysphingolipids are metabolized by a cytochrome P450-dependent pathway. J. Lipid Res. 2016 - PMC - PubMed
    1. Alecu I., Tedeschi A., Behler N., Wunderling K., Lamberz C., Lauterbach M.A., Gaebler A., Ernst D., Van Veldhoven P.P., Al-Amoudi A., Latz E., Othman A., Kuerschner L., Hornemann T., Bradke F., Thiele C., Penno A. Localization of 1-deoxysphingolipids to mitochondria induces mitochondrial dysfunction. J. Lipid Res. 2016 - PMC - PubMed
    1. Auer-Grumbach M. Hereditary sensory and autonomic neuropathies. Handb. Clin. Neurol. 2013;115:893–906. - PubMed
    1. Auer-Grumbach M., Bode H., Pieber T.R., Schabhuttl M., Fischer D., Seidl R., Graf E., Wieland T., Schuh R., Vacariu G., Grill F., Timmerman V., Strom T.M., Hornemann T. Mutations at Ser331 in the HSN type I gene SPTLC1 are associated with a distinct syndromic phenotype. Eur. J. Med. Genet. 2013;56:266–269. - PMC - PubMed

Publication types

MeSH terms