. 2018 Jun 7;102(6):1048-1061.
doi: 10.1016/j.ajhg.2018.04.001. Epub 2018 May 17.

Association of Polygenic Risk Scores for Multiple Cancers in a Phenome-wide Study: Results from The Michigan Genomics Initiative

Affiliations

Association of Polygenic Risk Scores for Multiple Cancers in a Phenome-wide Study: Results from The Michigan Genomics Initiative

Lars G Fritsche et al. Am J Hum Genet. .

Abstract

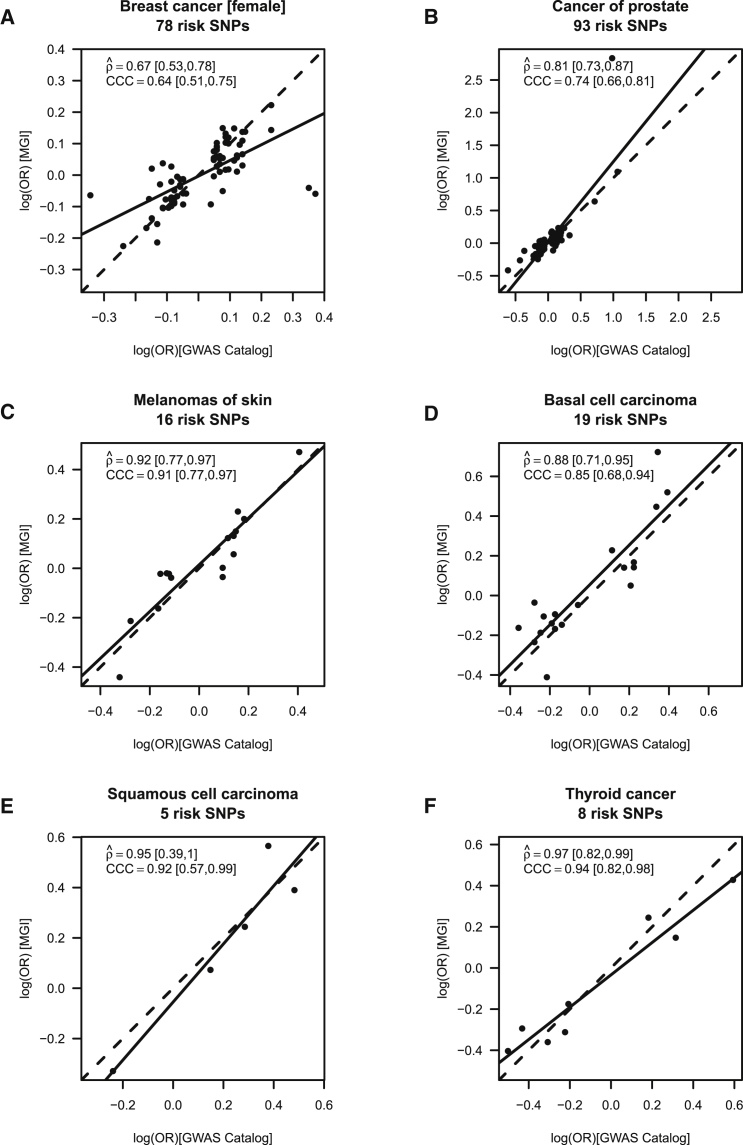
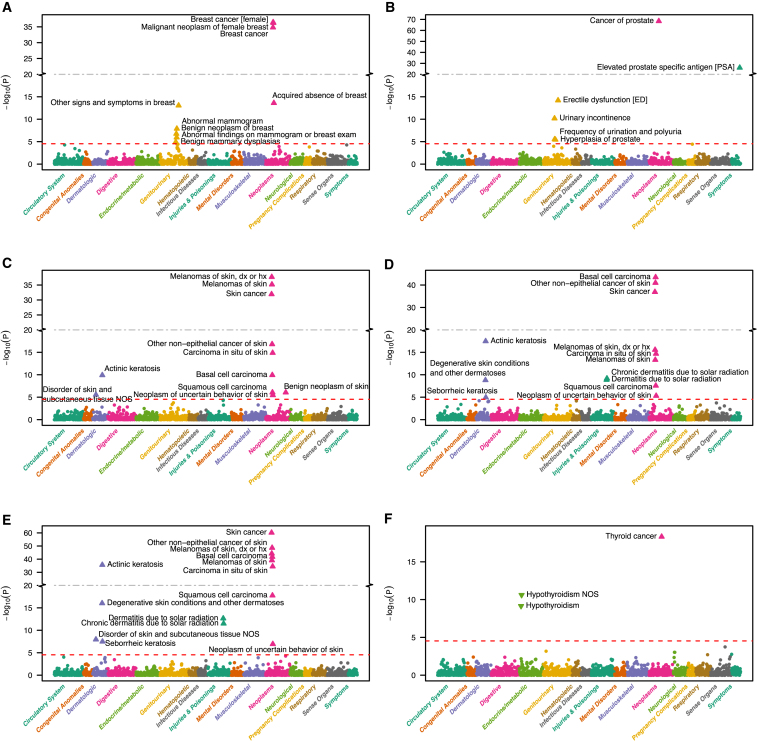
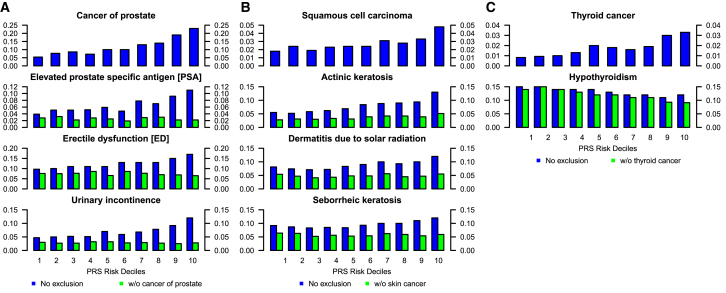
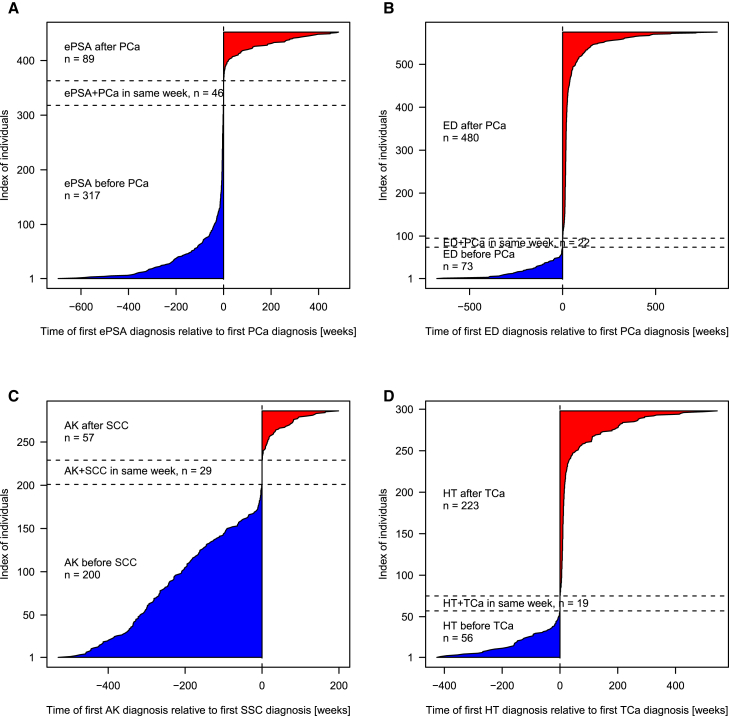
Health systems are stewards of patient electronic health record (EHR) data with extraordinarily rich depth and breadth, reflecting thousands of diagnoses and exposures. Measures of genomic variation integrated with EHRs offer a potential strategy to accurately stratify patients for risk profiling and discover new relationships between diagnoses and genomes. The objective of this study was to evaluate whether polygenic risk scores (PRS) for common cancers are associated with multiple phenotypes in a phenome-wide association study (PheWAS) conducted in 28,260 unrelated, genotyped patients of recent European ancestry who consented to participate in the Michigan Genomics Initiative, a longitudinal biorepository effort within Michigan Medicine. PRS for 12 cancer traits were calculated using summary statistics from the NHGRI-EBI catalog. A total of 1,711 synthetic case-control studies was used for PheWAS analyses. There were 13,490 (47.7%) patients with at least one cancer diagnosis in this study sample. PRS exhibited strong association for several cancer traits they were designed for, including female breast cancer, prostate cancer, melanoma, basal cell carcinoma, squamous cell carcinoma, and thyroid cancer. Phenome-wide significant associations were observed between PRS and many non-cancer diagnoses. To differentiate PRS associations driven by the primary trait from associations arising through shared genetic risk profiles, the idea of "exclusion PRS PheWAS" was introduced. Further analysis of temporal order of the diagnoses improved our understanding of these secondary associations. This comprehensive PheWAS used PRS instead of a single variant.

Keywords: electronic health records; genetic variation; genome-wide association study; hospitals; humans; multifactorial inheritance; neoplasms; phenome-wide association study; phenotype; risk.


Figures

Figure 1
Figure 1
Calibration of Association Parameters Calibration of association parameters between the MGI-GWAS and NHGRI-EBI GWAS Catalog derived effect estimates [log(OR)] for (A) breast cancer (females only), (B) cancer of prostate, (C) melanoma, (D) basal cell carcinoma, (E) squamous cell carcinoma, and (F) thyroid cancer. The agreement of two sets of SNP-specific beta coefficients (non-reference allele is the effect allele), their Pearson correlation (coefficient ρˆ, incl. 95% confidence interval and p) and Lin’s correspondence correlation (coefficient CCC; incl. 95% confidence interval) are shown; dashed line indicates perfect concordance; solid line indicates fitted line.
Figure 2
Figure 2
PRS PheWAS Plots PRS PheWAS plots for (A) breast cancer (females only), (B) cancer of prostate, (C) melanoma, (D) basal cell carcinoma, (E) squamous cell carcinoma, and (F) thyroid cancer. 1,711 traits are grouped into 16 color-coded categories as shown on the horizontal axis; the p values for testing the associations of PRS with the traits are minus log-base-10-transformed and shown on the vertical axis. Triangles indicate phenome-wide significant associations with their effect orientation (up, risk increasing; down, risk decreasing). PRS upon multiplicity adjustment (see Subjects and Methods). The solid horizontal line for p = 2.9 × 10−5 cut-off.
Figure 3
Figure 3
Proportion of Primary and Secondary Traits Stratified by PRS Deciles Percentage of primary and selected secondary traits in each cancer PRS category for (A) prostate cancer, (B) squamous cell carcinomas, and (C) thyroid cancer. Observed percentages in the MGI database as represented by the height of bars for each of ten increasing decile-stratified PRS strata from left to right. The PRS’s underlying trait is shown on top and secondary traits below with (blue) and without (green) overlapping relevant cancer cases. Only individuals with age ≥ 30 years were included in each analysis, and the prostate cancer PRS example includes only male individuals (see Table S10 for detailed sample sizes and percentages).
Figure 4
Figure 4
Temporal Order of Diagnoses Order was as follows: (A) elevated PSA levels (ePSA) and PCa in 452 individuals with PCa and ePSA, (B) erectile dysfunction (ED) and prostate cancer (PCa) in 575 individuals with ED and PCa, (C) actinic keratosis (AK) and squamous cell carcinoma (SCC) in 286 individuals with AK and SCC, and (D) hypothyrodism (HT) and thyroid cancer (TCa) in 298 individuals with HT and TC. The time of the first non-cancer diagnosis relative to the cancer diagnosis is shown in weeks, before (blue) and after (red) the cancer diagnosis.

References

    1. Witte J.S. Genome-wide association studies and beyond. Annu. Rev. Public Health. 2010;31:9–20. - PMC - PubMed
    1. Manolio T.A. Genomewide association studies and assessment of the risk of disease. N. Engl. J. Med. 2010;363:166–176. - PubMed
    1. Raychaudhuri S. Mapping rare and common causal alleles for complex human diseases. Cell. 2011;147:57–69. - PMC - PubMed
    1. Denny J.C., Ritchie M.D., Basford M.A., Pulley J.M., Bastarache L., Brown-Gentry K., Wang D., Masys D.R., Roden D.M., Crawford D.C. PheWAS: demonstrating the feasibility of a phenome-wide scan to discover gene-disease associations. Bioinformatics. 2010;26:1205–1210. - PMC - PubMed
    1. Denny J.C., Bastarache L., Ritchie M.D., Carroll R.J., Zink R., Mosley J.D., Field J.R., Pulley J.M., Ramirez A.H., Bowton E. Systematic comparison of phenome-wide association study of electronic medical record data and genome-wide association study data. Nat. Biotechnol. 2013;31:1102–1110. - PMC - PubMed

Publication types