. 2018 Jun 4;28(11):1803-1810.e5.
doi: 10.1016/j.cub.2018.04.034. Epub 2018 May 17.

Linear Self-Motion Cues Support the Spatial Distribution and Stability of Hippocampal Place Cells

Affiliations

Linear Self-Motion Cues Support the Spatial Distribution and Stability of Hippocampal Place Cells

Ryan E Harvey et al. Curr Biol. .

Abstract

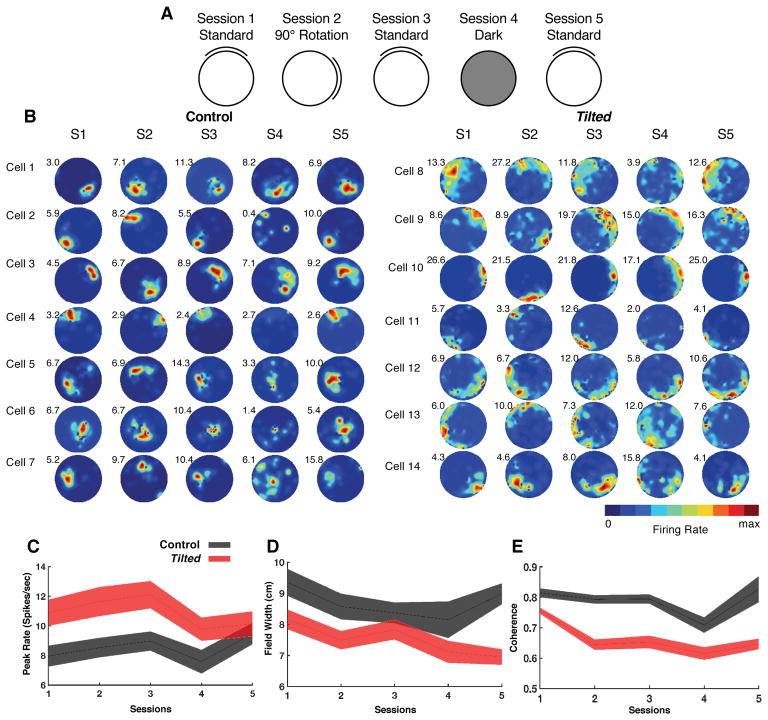
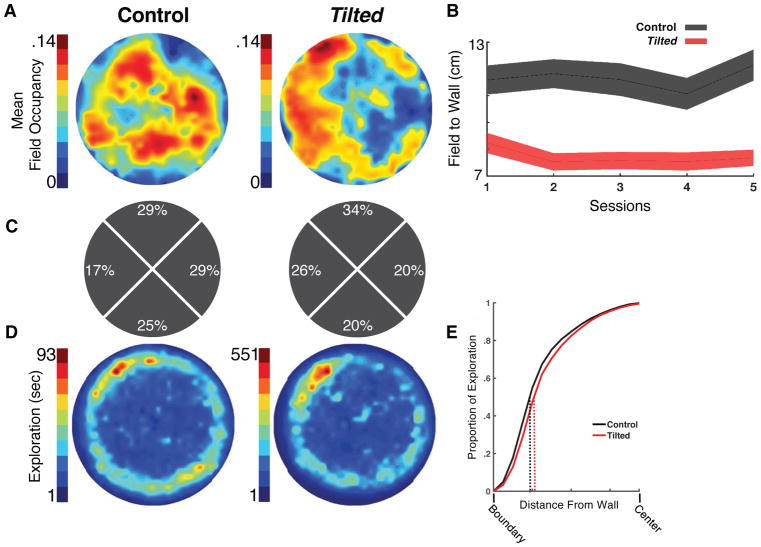
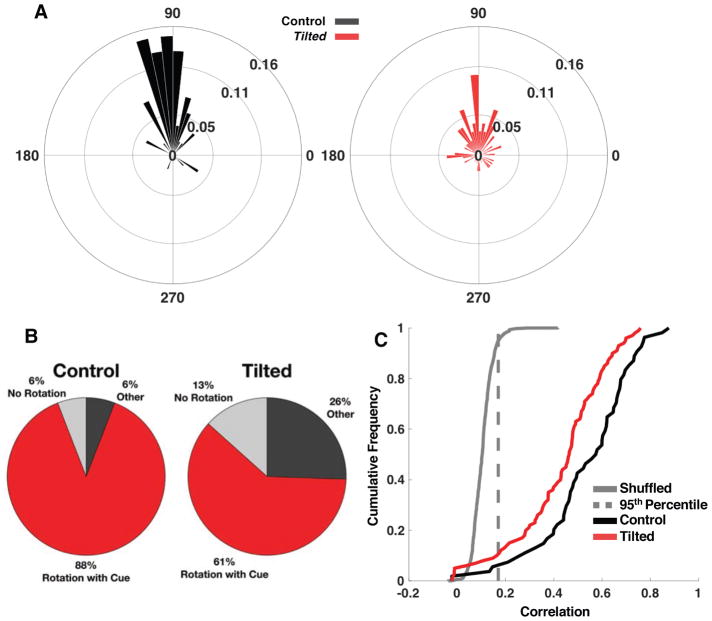
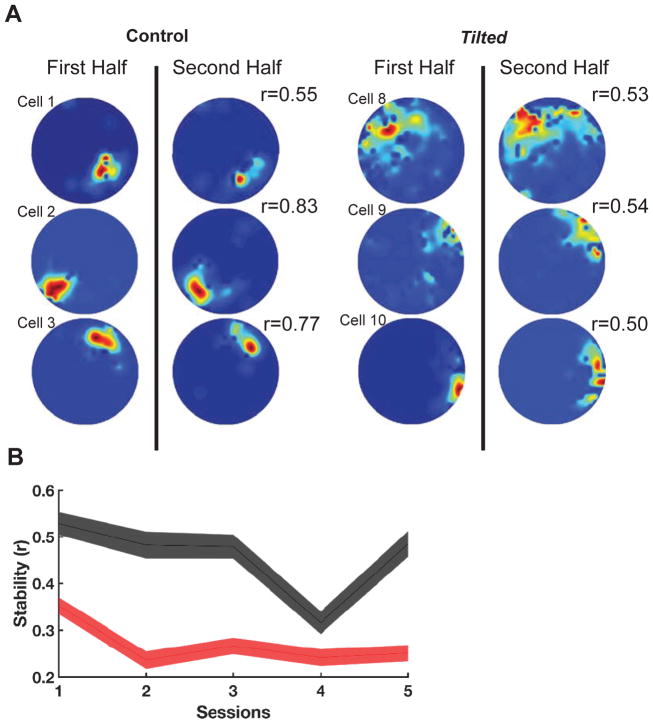
The vestibular system provides a crucial component of place-cell and head-direction cell activity [1-7]. Otolith signals are necessary for head-direction signal stability and associated behavior [8, 9], and the head-direction signal's contribution to parahippocampal spatial representations [10-14] suggests that place cells may also require otolithic information. Here, we demonstrate that self-movement information from the otolith organs is necessary for the development of stable place fields within and across sessions. Place cells in otoconia-deficient tilted mice showed reduced spatial coherence and formed place fields that were located closer to environmental boundaries, relative to those of control mice. These differences reveal an important otolithic contribution to place-cell functioning and provide insight into the cognitive deficits associated with otolith dysfunction.

Keywords: hippocampus; navigation; otolith organs; place cells; vestibular.


Conflict of interest statement

Declaration of Interests

The authors declare no competing interests.

Figures

Figure 1
Figure 1. Overview of experimental design, place cell examples, and basic firing characteristics
(A) Depiction of recording session design across five recording sessions: Session 1, cue card was positioned in the standard north position; Session 2, cue card was rotated 90° clockwise or counterclockwise from the standard location; Session 3, cue card was returned to the standard location; Session 4, cue card was removed and overhead lights were extinguished; and Session 5, white cue card was replaced at the standard location and lights were turned on. (B) Representative place cells from control (cells 1–7) and tilted (cells 8–14) mice over 5 sessions. Numbers residing in the top left of each rate map represent peak firing rate (hz). (also see Figure S2) (C) Plot showing the peak firing rate (spikes/second) for each place cell recorded in tilted and control mice with values from all sessions included. (D) Plot showing the field width (cm) for each place cell recorded in tilted and control mice with values from all sessions included. (E) Plot showing coherence measures for each place cell recorded in tilted and control mice with values from all sessions included. (also see Figure S3) (C–E): Shaded error bars represent SEM (also see Table S1)
Figure 2
Figure 2. Place Cell Firing by Tilted-Mice Is More Concentrated Near Environmental Boundaries
(A) Place field occupancy of all place cells recorded in control and tilted mice. Blue represents a lower place field occupancy and red represents a high place field occupancy. Note that place cells from tilted-mice appear to cluster closer to the cylinder boundaries compared to control mice. (B) Field-to-wall measures (cm) for place cells from control and tilted mice. Note that place fields from control mice form further from environmental boundaries than tilted-mice. Shaded error bars represent SEM. (C) Percentage of place fields from control and tilted mice in each of 4 quadrants of the circular arena. (D) Occupancy of environmental sampling. (E) Proportion of Exploration as a function of distance to the boundary. Note that tilted mice had similar occupancy compared to control mice, with the majority of exploration occurring near the boundary (within 10cm), as illustrated by dotted lines at the 50% point.
Figure 3
Figure 3. Landmark control of place field following 90° cue rotation
(A) Polar plot depicting place field rotation, normalized by probability, in 6° bins (control in black, tilted in red). Place field rotation of 90° indicates that the cell’s activity precisely rotated with the cue. Left: Control mice. Right: Tilted mice. (B) Pie charts depicting percent of field anchoring following cue rotation. (C) Cumulative density functions of cross-correlation values (r) following 90° cue rotation for place cells recorded in control (black) and tilted (red) mice. Shown are correlations following the rotation that maximized the correlation between session 1 and 2 rate maps. Fields from cue rotation sessions were permutated to generate chance cross-correlations (gray line). The 95th percentile was then taken from the chance distribution and used as a threshold for evaluating the degree of field rotation in A (dashed gray line). Overall, tilted mice had lower cross-correlation values than control mice, indicating firing field instability following cue rotation.
Figure 4
Figure 4. Intra-session stability
(A) The shown rate maps depict the stability (r) between the first and second half of the first session using 6 example cells from Figure 1. Note that tilted cells appear to be less stable (B) Stability between groups over all sessions. Note that tilted mice have much lower stability compared to control mice over all sessions. Red: Tilted, Black: Control, shaded lines represent SEM

References

    1. O’Keefe J, Dostrovsky J. The hippocampus as a spatial map. Preliminary evidence from unit activity in the freely-moving rat. Brain Res. 1971;34:171–175. - PubMed
    1. McNaughton BL, Knierim JJ, Wilson MA. The Cognitive Neurosciences. Cambridge, Massachusetts: Massachuetts Institute of Technology; 1995.
    1. Russell NA, Horii A, Smith PF, Darlington CL, Bilkey DK. Long-Term Effects of Permanent Vestibular Lesions on Hippocampal Spatial Firing. J Neurosci. 2003;23:6490–6498. - PMC - PubMed
    1. Stackman RW, Clark AS, Taube JS. Hippocampal Spatial Representations Require Vestibular Input. Hippocampus. 2002;12:291–303. - PMC - PubMed
    1. Stackman RW, Taube JS. Firing Properties of Head Direction Cells in the Rat Anterior Thalamic Nucleus: Dependence on Vestibular Input. J Neurosci. 1997;17:4349–4358. - PMC - PubMed

Publication types

LinkOut - more resources