. 2018 Jun 13;23(6):766-774.e5.
doi: 10.1016/j.chom.2018.04.013. Epub 2018 May 17.

The Bicarbonate Transporter SLC4A7 Plays a Key Role in Macrophage Phagosome Acidification

Affiliations

The Bicarbonate Transporter SLC4A7 Plays a Key Role in Macrophage Phagosome Acidification

Vitaly Sedlyarov et al. Cell Host Microbe. .

Abstract

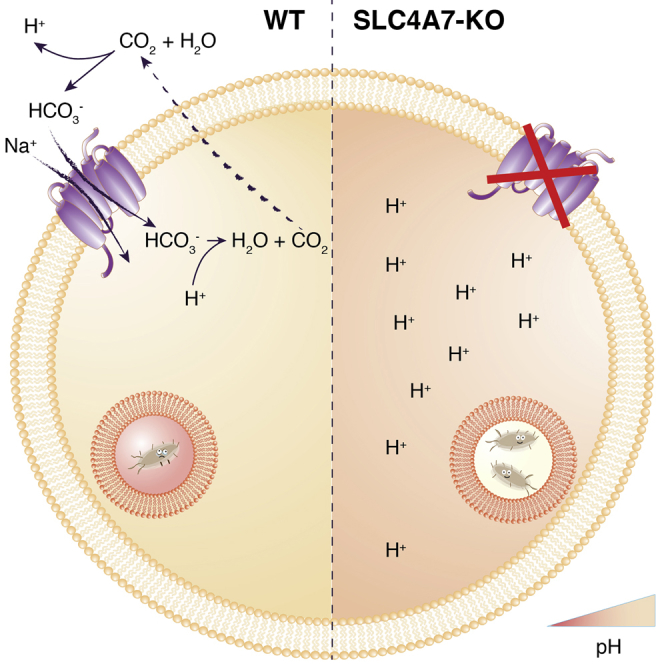
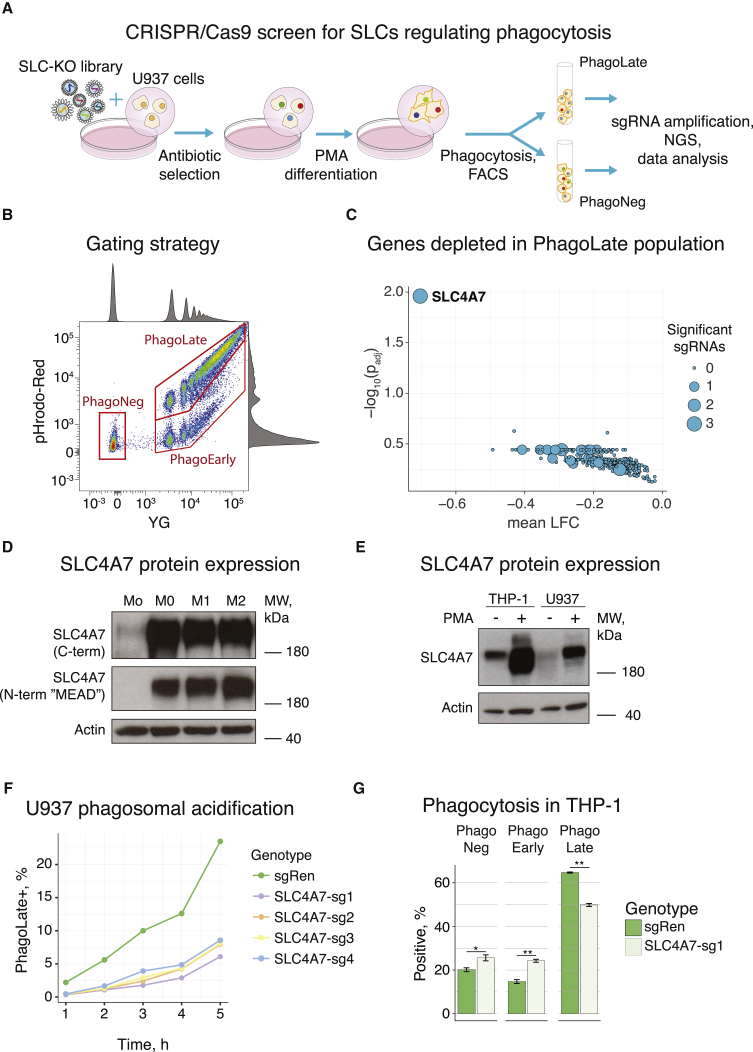
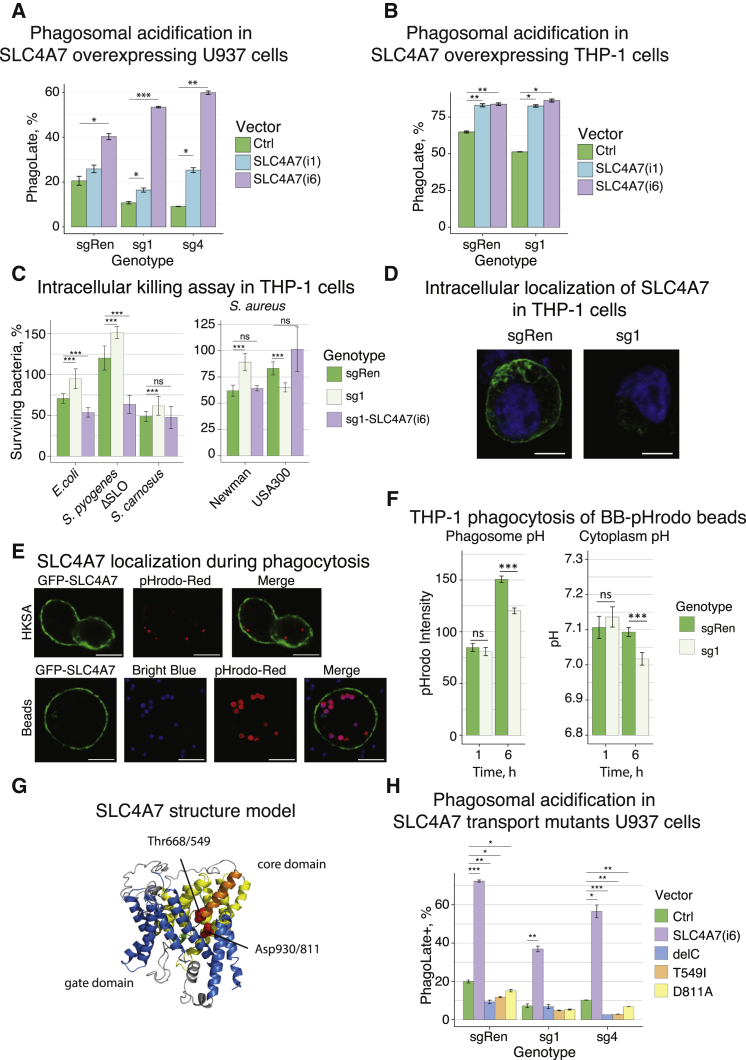
Macrophages represent the first line of immune defense against pathogens, and phagosome acidification is a necessary step in pathogen clearance. Here, we identified the bicarbonate transporter SLC4A7, which is strongly induced upon macrophage differentiation, as critical for phagosome acidification. Loss of SLC4A7 reduced acidification of phagocytosed beads or bacteria and impaired the intracellular microbicidal capacity in human macrophage cell lines. The phenotype was rescued by wild-type SLC4A7, but not by SLC4A7 mutants, affecting transport capacity or cell surface localization. Loss of SLC4A7 resulted in increased cytoplasmic acidification during phagocytosis, suggesting that SLC4A7-mediated, bicarbonate-driven maintenance of cytoplasmic pH is necessary for phagosome acidification. Altogether, we identify SLC4A7 and bicarbonate-driven cytoplasmic pH homeostasis as an important element of phagocytosis and the associated microbicidal functions in macrophages.

Keywords: CRISPR screen; NBC3; NBCn1; SLC4A7; intracellular bacterial killing; macrophages; phagocytosis; phagosome acidification; solute carrier.


Figures

None
Graphical abstract
Figure 1
Figure 1
SLC-Focused CRISPR/Cas9 Genetic Loss-of-Function Screens Identify SLC4A7 to Be Important for Phagosome Acidification (A) Schematic representation of the major steps of the SLC-focused CRISPR/Cas9 screen to identify SLCs involved in phagocytosis. (B) Representative flow cytometry scatterplot of phagocytosis assays. PMA-differentiated U937 cells were incubated with dual-colored opsonized beads. Each dot represents one cell: intensity of the pH-insensitive dye (YG) is displayed on the x axis, intensity of pH-sensitive dye (pHrodo-Red), whose signal intensity increases with decrease in pH, is shown on the y axis. Double-negative cells were classified as phagocytosis-negative (PhagoNeg), double-positive cells (YG and high pHrodo-Red signal) were classified as cells having undergone phagocytosis and phagosome acidification (PhagoLate), and single positive cells (YG and low pHrodo-Red signal) were classified as cells at early stages of phagocytosis (PhagoEarly). The marginal intensity distributions are shown on the sides of the plot. (C) Volcano plot showing the statistical significance of genes depleted in the PhagoLate population on the y axis as –log10(padj) against average log2 fold-change (mean LFC) on the x axis calculated for all sgRNAs per gene. The size of the dots represents the number of significant changes in sgRNAs counts. See Figure S1B for differential abundance of individual sgRNAs. (D) Immunoblot analysis of primary human monocytes (Mo) derived from peripheral blood and M-CSF-differentiated monocyte-derived human macrophages, which were unpolarized (M0), or polarized toward M1 phenotype with interferon-γ and lipopolysaccharide, or to M2 phenotype with interleukin-4. Respective lysates were probed with an anti-SLC4A7 antibody detecting all isoforms (C-terminal epitope) and an anti-SLC4A7 antibody detecting an N-terminal epitope present only in isoforms starting with the amino acids “MEAD.” Actin was used as loading control. MW, molecular weight. See Figure S1C for isoforms. (E) Representative immunoblot analysis of SLC4A7 expression in undifferentiated and PMA-differentiated THP-1 and U937 cells. Actin was used as loading control. MW, molecular weight. (F) Representative kinetics of phagosome acidification in four independent SLC4A7 knockout (sg1-sg4) and control (sgRen) U937 cells. After PMA differentiation, U937 cells were incubated with dual-colored beads and analyzed at the indicated time points using flow cytometry. The fraction of PhagoLate cells is displayed against the incubation time with beads. See Figure S1D for confirmation of SLC4A7 knockdown. (G) Phagocytosis assays with PMA-differentiated SLC4A7 knockout (sg1) or control (sgRen) THP-1 cells, which were incubated with dual-colored beads as described in (B). Bar graphs show the fraction of PhagoLate, PhagoEarly, and PhagoNeg cells as assessed by pHrodo and YG fluorescence in flow cytometry. Data are mean ± 95% confidence interval from four replicates. p < 0.05, ∗∗p < 0.001; by Welsh's t test.
Figure 2
Figure 2
Functional Consequences of SLC4A7 Knockout and Overexpression (A) Phagocytosis assays with control (sgRen) and SLC4A7 knockout (sg1, sg4) U937 cells, which were lentivirally infected to exogenously express HA-tagged SLC4A7 isoform 1, isoform 6, or empty vector control (Ctrl), respectively. Cells were incubated with dual-colored beads as described in Figure 1B. Bar graphs show the fraction of PhagoLate, PhagoEarly, and PhagoNeg cells as assessed by flow cytometry. Data are mean ± 95% confidence interval from three replicates. p < 0.05, ∗∗p < 0.01, ∗∗∗p < 0.001; by Welsh's t test. See Figure S1F for immunoblot confirmation of SLC4A7 knockout and exogenous expression. (B) Phagocytosis assays with control (sgRen) and SLC4A7 knockout (sg1) THP-1 cells, which were lentivirally infected to exogenously express HA-tagged SLC4A7 isoform 1, isoform 6, or empty vector control (Ctrl), respectively. Cells were incubated with dual-colored beads as in Figures 1B and 2A. Bar graphs show the fraction of PhagoLate, PhagoEarly, and PhagoNeg cells as assessed by flow cytometry. Data are mean ± SD from two replicates. p < 0.05, ∗∗p < 0.01; by Welsh's t test. See Figure S1G for immunoblot confirmation of SLC4A7 knockdown and exogenous expression. (C) Intracellular killing assay with viable Gram-negative (E. coli) and Gram-positive (Streptococcus pyogenes ΔSLO, Staphylococcus carnosus Schleifer and Fischer, and Staphylococcus aureus Newman and USA300) bacteria in control (sgRen), SLC4A7 knockout (sg1), and SLC4A7 knockout reconstituted with SLC4A7 isoform 6 (sg1-SLC4A7(i6)) THP-1 cells. Bar graphs depict the percentage of surviving intracellular bacteria in relation to time point zero. Data are median and interquartile range from three replicates. ns, not significant, ∗∗∗p < 0.001; by Wilcoxon-Mann-Whitney test. (D) Representative confocal immunofluorescence images of endogenous SLC4A7 in control (sgRen) or SLC4A7 knockout (sg1) THP-1 cells. PMA-differentiated cells were fixed and stained with anti-SLC4A7 antibody (green). DNA was counterstained with DAPI (blue). The overlay of both signals is depicted. Scale bars, 5 μm. (E) Representative confocal live-cell immunofluorescence images of THP-1 cells expressing GFP-tagged SLC4A7 isoform 6. After PMA-induced differentiation, cells were incubated with pHrodo-labeled heat-killed S. aureus (HKSA, upper panel) or dual-colored beads (pHrodo and bright blue; lower panel). Single channel images and respective overlays are shown. Scale bars, 10 μm. For time-lapse acquisitions, see Video S1. (F) Simultaneous measurement of cytoplasmic and phagosomal pH during phagocytosis using live-cell microscopy. PMA-differentiated control (sgRen) and SLC4A7 knockout (sg1) THP-1 cells were loaded with BCECF-AM, incubated with dual-colored beads (pHrodo and bright blue), and imaged at the indicated time points. Incubation and imaging were done in Hank’s balanced salt solution with 10% FCS at 37°C in 5% CO2. At each time point, z stacks of five different fields were acquired per replicate. Bar charts represent pHrodo intensities of phagocytosed beads or cytoplasmic pH as calculated based on the BCECF calibration curve. Data are mean and 95% confidence interval from three replicates. ∗∗∗p < 0.001; by Welch's t test. For in situ calibration of the BCECF 490/440 ratio, see Figure S2A; for example images, see Figure S2B. For simultaneous cytoplasmic and phagosomal pH measurements in THP-1 cells phagocyting heat-killed S. aureus, see Figure S2C (left panel), and for U937 cells phagocytosing beads, see Figure S2C (right panel). (G) Schematic representation of the SLC4A7 model with the transmembrane domains (TMDs) of the core domain in yellow and the TMDs of the gate domain in blue. Helix 3 and helix 10, which align to form a continuous helix near the putative substrate binding site, are shown in orange and green, respectively. The residues mutated in the functional studies are shown in red with the isoform1/isoform6 numbering scheme. (H) Phagocytosis assays with two independent U937 clones with SLC4A7 knockout (sg1, sg4) or control (sgRen), which were infected with lentiviral expression constructs coding for Strep-HA-tagged SLC4A7 isoform 6 (SLC4A7(i6)), an isoform 6 mutant lacking amino acids 1,008–1,131 (delC), two different predicted transport mutants (T549I and D811A), or empty vector control (Ctrl). PMA-differentiated cells were incubated with dual-colored beads as in Figure 1B and analyzed by flow cytometry. Bar graphs show the fraction of PhagoLate cells as assessed by pHrodo fluorescence intensity. Data are mean and 95% confidence interval from two replicates. p < 0.05, ∗∗p < 0.01, ∗∗∗p < 0.001; by Welsh's t test. For subcellular localization of the different proteins, see immunofluorescence analysis in Figure S2E.

Similar articles

Cited by

References

    1. Arakawa T., Kobayashi-Yurugi T., Alguel Y., Iwanari H., Hatae H., Iwata M., Abe Y., Hino T., Ikeda-Suno C., Kuma H. Crystal structure of the anion exchanger domain of human erythrocyte band 3. Science. 2015;350:680–684. - PubMed
    1. Artyomov M.N., Sergushichev A., Schilling J.D. Integrating immunometabolism and macrophage diversity. Semin. Immunol. 2016;28:417–424. - PMC - PubMed
    1. Barneaud-Rocca D., Etchebest C., Guizouarn H. Structural model of the anion exchanger 1 (SLC4A1) and identification of transmembrane segments forming the transport site. J. Biol. Chem. 2013;288:26372–26384. - PMC - PubMed
    1. Blomen V.A., Majek P., Jae L.T., Bigenzahn J.W., Nieuwenhuis J., Staring J., Sacco R., van Diemen F.R., Olk N., Stukalov A. Gene essentiality and synthetic lethality in haploid human cells. Science. 2015;350:1092–1096. - PubMed
    1. Boedtkjer E., Praetorius J., Matchkov V.V., Stankevicius E., Mogensen S., Füchtbauer A.C., Simonsen U., Füchtbauer E.-M., Aalkjaer C. Disruption of Na+,HCO3− cotransporter NBCn1 (slc4a7) inhibits no-mediated vasorelaxation, smooth muscle Ca2+ sensitivity, and hypertension development in miceclinical perspective. Circulation. 2011;124:1819–1829. - PubMed

Publication types

LinkOut - more resources