. 2018 Jun 6;98(5):1042-1054.e4.
doi: 10.1016/j.neuron.2018.04.031. Epub 2018 May 17.

Encoding of Articulatory Kinematic Trajectories in Human Speech Sensorimotor Cortex

Affiliations

Encoding of Articulatory Kinematic Trajectories in Human Speech Sensorimotor Cortex

Josh Chartier et al. Neuron. .

Abstract

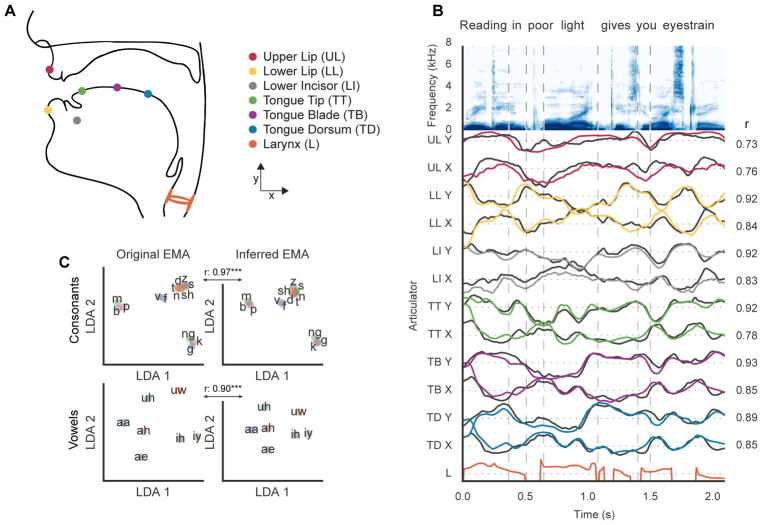
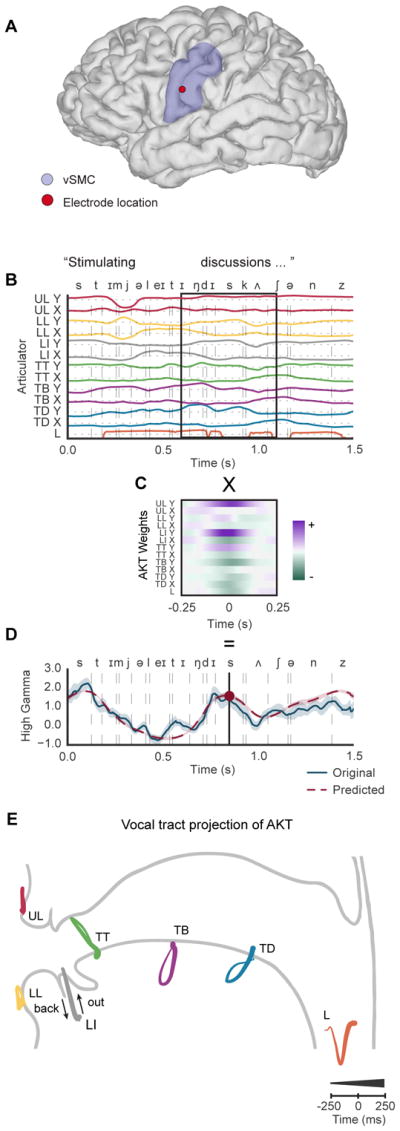
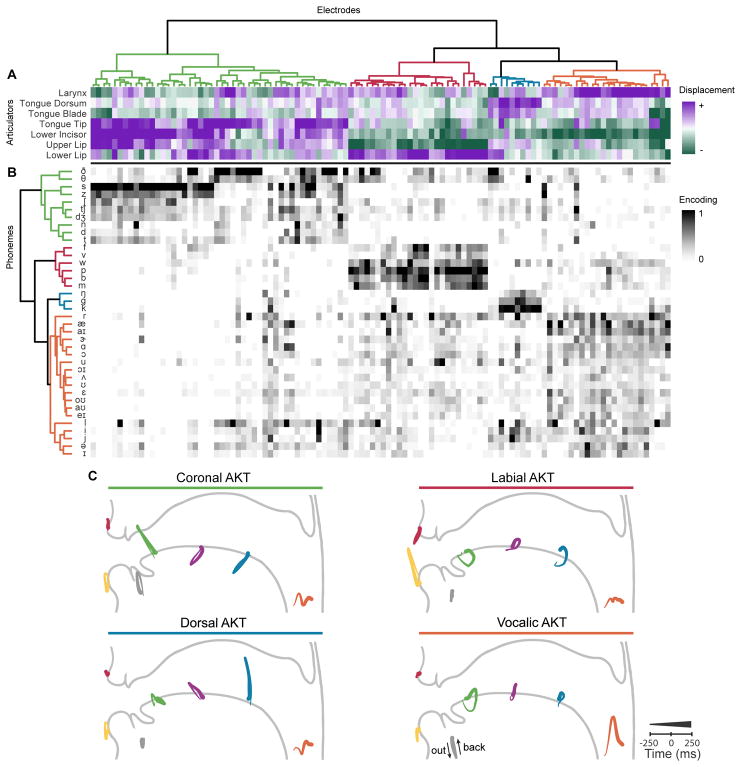
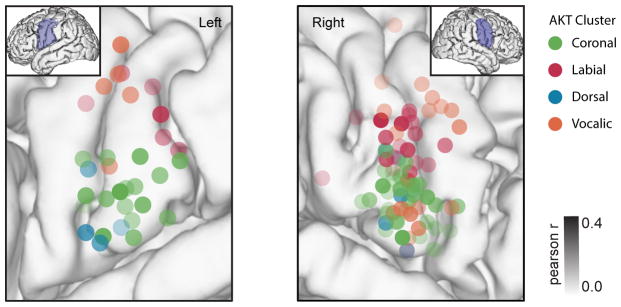
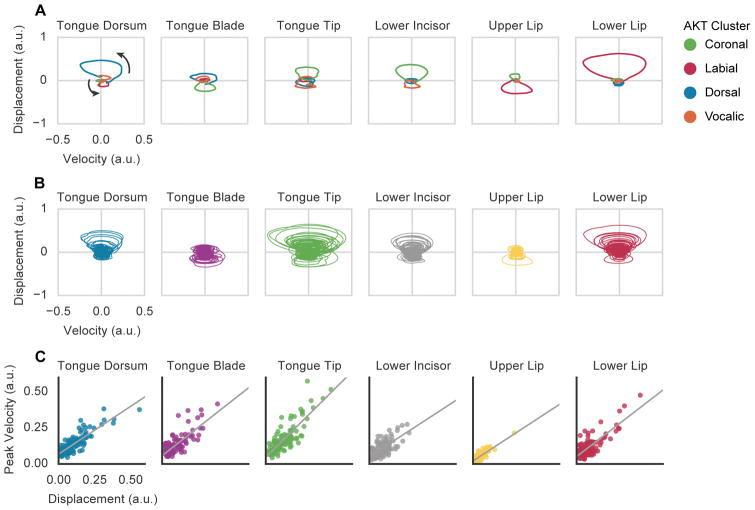
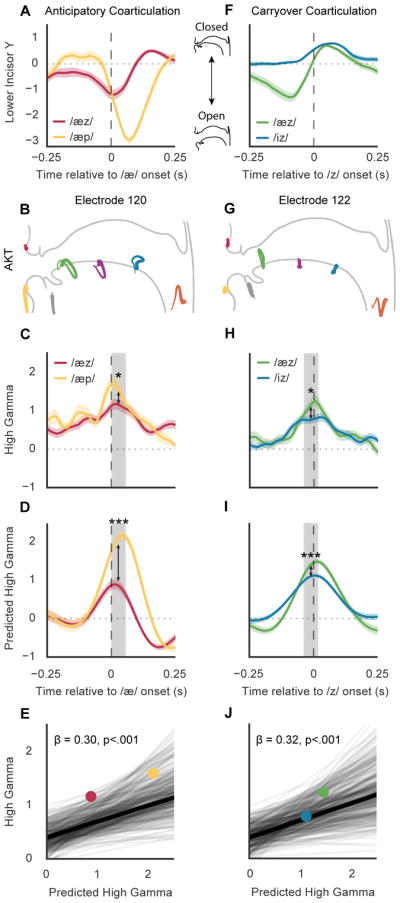
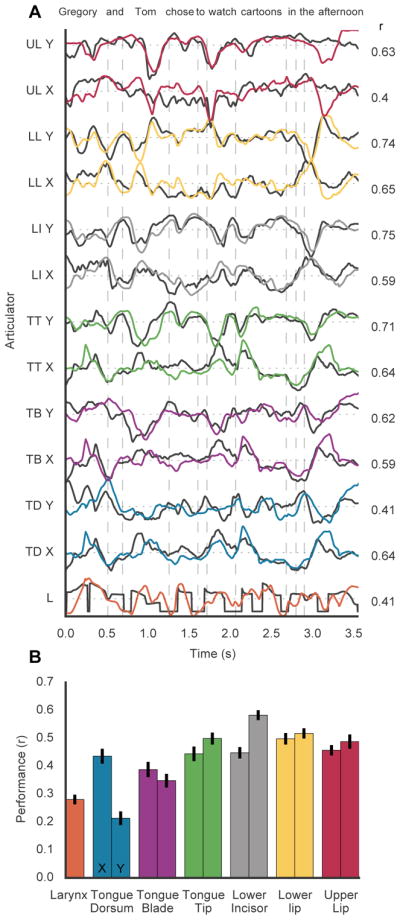
When speaking, we dynamically coordinate movements of our jaw, tongue, lips, and larynx. To investigate the neural mechanisms underlying articulation, we used direct cortical recordings from human sensorimotor cortex while participants spoke natural sentences that included sounds spanning the entire English phonetic inventory. We used deep neural networks to infer speakers' articulator movements from produced speech acoustics. Individual electrodes encoded a diversity of articulatory kinematic trajectories (AKTs), each revealing coordinated articulator movements toward specific vocal tract shapes. AKTs captured a wide range of movement types, yet they could be differentiated by the place of vocal tract constriction. Additionally, AKTs manifested out-and-back trajectories with harmonic oscillator dynamics. While AKTs were functionally stereotyped across different sentences, context-dependent encoding of preceding and following movements during production of the same phoneme demonstrated the cortical representation of coarticulation. Articulatory movements encoded in sensorimotor cortex give rise to the complex kinematics underlying continuous speech production. VIDEO ABSTRACT.

Keywords: articulation; coordination; decoding; electrocorticography; encoding; movement; sensorimotor cortex; speech production; trajectory.


Conflict of interest statement

Declaration of Interest

The authors declare no competing interests.

Figures

Figure 1
Figure 1. Inferred articulator kinematics
A, Approximate sensor locations for each articulator during EMA recordings. Midsagittal movements represented as Cartesian X and Y coordinates. B, Midsagittal articulator movements inferred from both acoustic and phonetic features (in color), the trace of each reference sensor coordinate is also shown (in black). The larynx was approximated by fundamental frequency (f0) modulated by whether the segment of speech was voiced. C, Recorded articulator movements (EMA) representing consonants and vowels projected into a low dimensional (LDA) space. Inferred articulator movements projected into the same space were highly correlated with the original EMA. Correlations were pairwise distances between phonemes (consonants: r = 0.97, p<.001, vowels: r = 0.90, p<.001).
Figure 2
Figure 2. Neural encoding of articulatory kinematic trajectories
A, Magnetic resonance imaging (MRI) reconstruction of single participant brain where an example electrode is shown in the ventral sensorimotor cortex (vSMC). B, Inferred articulator movements during the production of the phrase “stimulating discussions.” Movement directions differentiated by color; positive X and Y (purple), negative X and Y (green) directions as shown in Figure 1A. C, Spatiotemporal filter resulting from fitting articulator movements to explain high gamma activity for an example electrode. Time 0 represents the alignment to the predicted sample of neural activity. Convolving the spatiotemporal filter with articulator kinematics explains high gamma activity D as shown by example electrode. High gamma from ten trials of speaking “stimulation discussions” were dynamically time warped based on the recorded acoustics and averaged together to emphasize peak high gamma activity throughout the course of a spoken phrase. E, Example electrode encoded filter weights projected onto midsagittal view of vocal tract exhibits speech-relevant articulatory kinematic trajectories (AKT). Time course of trajectories is represented by thin-to-thick lines. Larynx (pitch modulated by voicing) is one dimensional along y-axis with x-axis showing time course.
Figure 3
Figure 3. Clustered articulatory kinematic trajectories and phonetic outcomes
A, Hierarchical clustering of encoded articulatory kinematic trajectories (AKTs) for all 108 electrodes across 5 participants. Each column represents one electrode. Kinematics of AKTs were described as a 7 dimensional vector by the points of maximal displacement along the principal movement axis of each articulator. Electrodes were hierarchically clustered by their kinematic descriptions resulting in four primary clusters. B, A phoneme encoding model was fit for each electrode. Kinematically clustered electrodes also encoded four clusters of encoded phonemes differentiated by place of articulation (alveolar, bilabial, velar, and vowels). C, Average AKTs across all electrodes in a cluster. Four distinct vocal tract configurations encompassed coronal, labial, and dorsal constrictions in addition to vocalic control.
Figure 4
Figure 4. Spatial organization of vocal tract gestures
Electrodes from 5 participants (2 left, 3 right hemisphere) colored by kinematic cluster warped to vSMC location on common MRI reconstructed brain. Opacity of electrode varies with Pearson’s correlation coefficient from kinematic trajectory encoding model.
Figure 5
Figure 5. Damped oscillatory dynamics of kinematic trajectories
A, Articulator trajectories from encoded AKTs along the principal movement axes for example electrodes from each kinematic cluster. Positive values indicate a combination of upward and frontward movements. B, Articulator trajectories for all 108 encoded kinematic trajectories across 5 participants. C, Linear relationship between peak velocity and articulator displacement (r: 0.85, 0.77. 0.83, 0.69, 0.79, 0.83 in respective order, p <.001). Each point represents the peak velocity and associated displacement of an articulator from the AKT for an electrode.
Figure 6
Figure 6. Neural representation of coarticulated kinematics
A, Example of different degrees of anticipatory coarticulation for the lower incisor. Average traces for the lower incisor (y-direction) are shown for /æz/ and /æp/ aligned to the acoustic onset of /æ/. B, Electrode 120 is crucially involved in the production of /æ/ with a vocalic AKT (jaw opening and laryngeal control), and has a high phonetic selectivity index for /æ/. C, Average high gamma activity for electrode 120 during the productions of /æz/ and /æp/. Median high gamma during 50 ms centered at the electrode’s point of peak phoneme discriminability (grey box) is significantly higher for /æp/ than /æz/ (p<.05, Wilcoxon signed ranks tests). D, Average predicted high gamma activity predicted by AKT in B. Median predicted high gamma is significantly higher for /æp/ than /æz/ (p<.001, Wilcoxon signed ranks tests). E, Mixed-effect model shows relationship of high gamma with kinematic variability due to anticipatory coarticulatory effects of following phonemes for all electrodes and phonemes (β = 0.30, SE = 0.04, χ2(1) = 38.96, p = 4e–10). Each line shows the relationship between high gamma and coarticulated kinematic variability for a given phoneme and electrode in all following phonetic contexts with at least 25 instances. Relationships from C and D for /æz/ (red) and /æp/ (yellow) are shown as points. Electrodes in all participants were used to construct the model. F, Example of different degrees of carryover coarticulation for the lower incisor. Average traces for the lower incisor (y-direction) are shown for /æz/ and /iz/ aligned to the acoustic onset of /z/. G, Electrode 122 is crucially involved in the production of /z/ with a coronal AKT, and has a high phonetic selectivity index for /z/. H, Average high gamma activity for electrode 122 during the productions of /æz/ and /iz/. Median high gamma is significantly higher for /æz/ than /iz/ (p<.05, Wilcoxon signed ranks tests). I, Average predicted high gamma activity predicted by AKT in G. Median predicted high gamma is significantly higher for /æz/ than /iz/ (p<.001, Wilcoxon signed ranks tests). J, Mixed-effect model shows relationship of high gamma with kinematic variability due to carryover coarticulatory effects of preceding phonemes for all electrodes (in all participants) and phonemes (β = 0.32, SE = 0.04, χ2(1) = 42.58, p = 6e–11). Relationships from H and I for /æz/ (green) and /iz/ (blue) are shown as points.
Figure 7
Figure 7. Neural encoding model evaluation
A Comparison of AKT encoding performance across electrodes in different anatomical regions. Anatomical regions compared: electrodes in study (EIS), superior temporal gyrus (STG), precentral gyrus* (preCG*), postcentral gyrus* (postCG*), middle temporal gyrus (MTG), supramarginal gyrus (SMG), pars opercularis (POP), pars triangularis (PTRI), pars orbitalis (PORB), middle frontal gyrus (MFG). Electrodes in study were speech selective electrodes from pre and post central gyri while preCG* and postCG* only included electrodes that were not speech selective. EIS encoding performance was significantly higher than all other regions (p<1e–15, Wilcoxon signed rank-test). B Comparison of AKT and formant encoding models for electrodes in the study. Using F1, F2, and F3, the formant encoding model was fit in the same manner as the AKT model. Each point represents the performance of both models for one electrode. C Comparison of AKT and phonemic encoding models. The phonemic model was fit in the manner as the AKT model except with phonemes described as one hot vectors. The best single phoneme predicting electrode activity was said to be the encoded phoneme of that particular electrode and that r-value was reported along with the r-value of the AKT model. Pearson’s r was computed on held-out data from training for all models. In both comparisons, the AKT performed significantly higher (p<1e–20, Wilcoxon signed rank-test)
Figure 8
Figure 8. Decoded articulator movements from vSMC activity
A, Original (black) and predicted (colored) X and Y coordinates of articulation movements during the production of an example held-out sentence. Pearson’s correlation coefficient (r) for each articulator trace. B, Average performance (correlation) for each articulator for 100 sentences held out from training set.

References

    1. Abbs JH, Gracco VL. Control of complex motor gestures: Orofacial muscles responses to load perturbation of the lip during speech. Journal of Neurophysiology. 1984;51:705–723. - PubMed
    1. Aflalo TN, Graziano MS. Partial tuning of motor cortex neurons to final posture in a free-moving paradigm. Proceedings of the National Academy of Sciences of the United States of America. 2006;103(8):2909–14. - PMC - PubMed
    1. Allen MP. Understanding Regression Analysis. Springer; Boston, MA: 1997. Testing hypotheses in nested regression models.
    1. Baayen RH, Davidson DJ, Bates DM. Mixed-effects modeling with crossed random effects for participants and items. Journal of Memory and Language. 2008;59(4):390–412.
    1. Barr DJ, Levy R, Scheepers C, Tily HJ. Random effects structure for confirmatory hypothesis testing: Keep it maximal. Journal of Memory and Language. 2013;68(3):255–278. - PMC - PubMed

Publication types