Meta-Analysis
. 2018 Aug;37(35):4792-4808.
doi: 10.1038/s41388-018-0316-y. Epub 2018 May 21.

Mediator kinase CDK8/CDK19 drives YAP1-dependent BMP4-induced EMT in cancer

Affiliations
Meta-Analysis

Mediator kinase CDK8/CDK19 drives YAP1-dependent BMP4-induced EMT in cancer

Anne Serrao et al. Oncogene. 2018 Aug.

Abstract

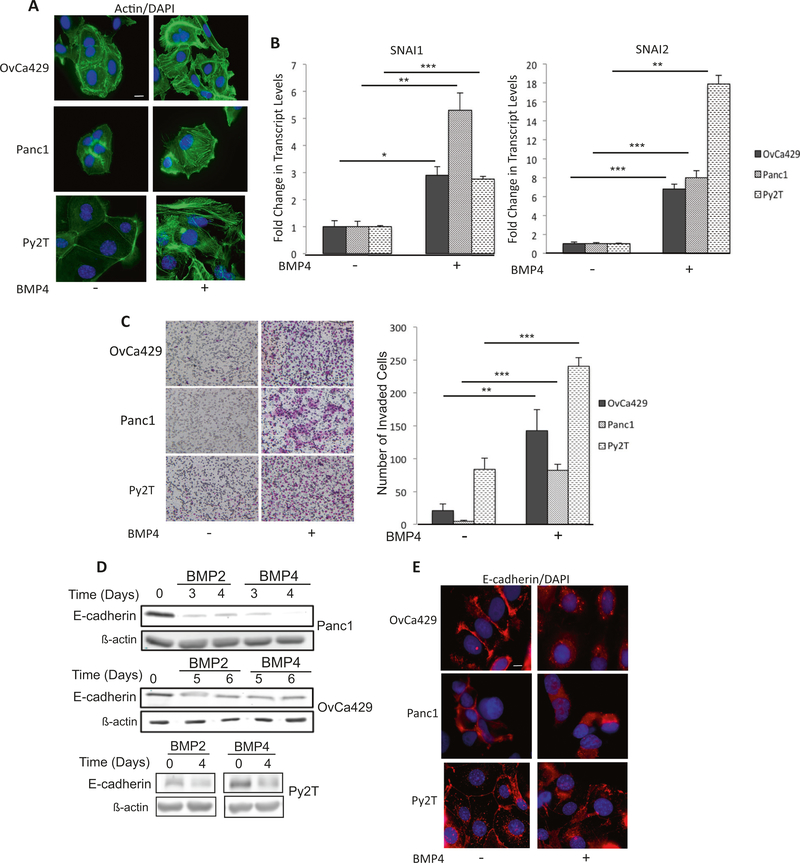
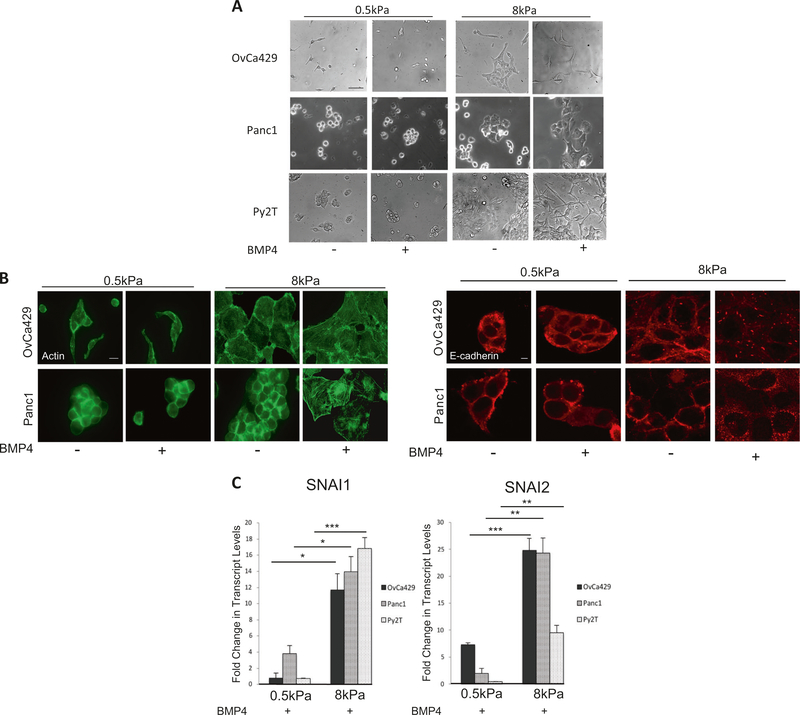
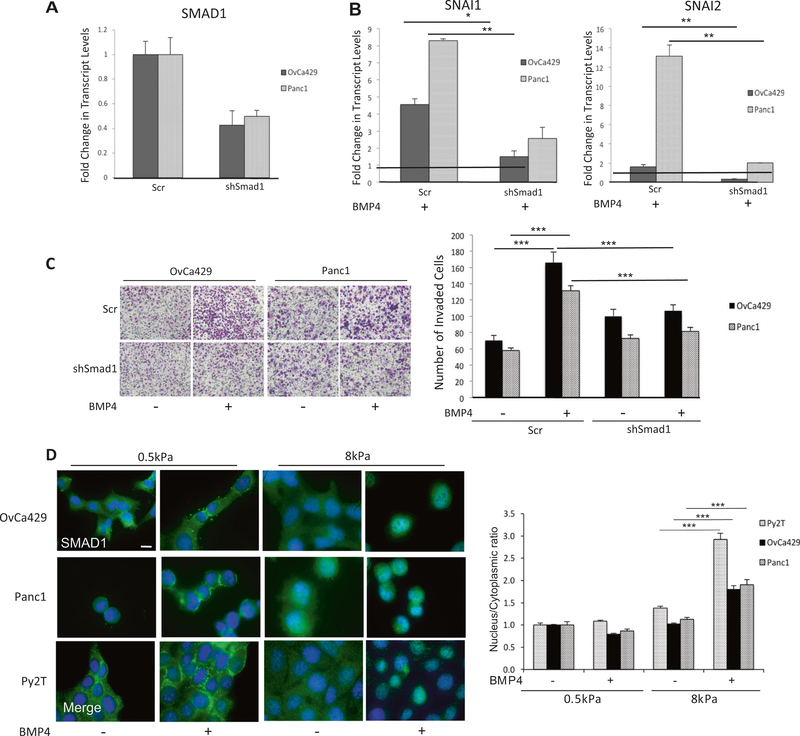
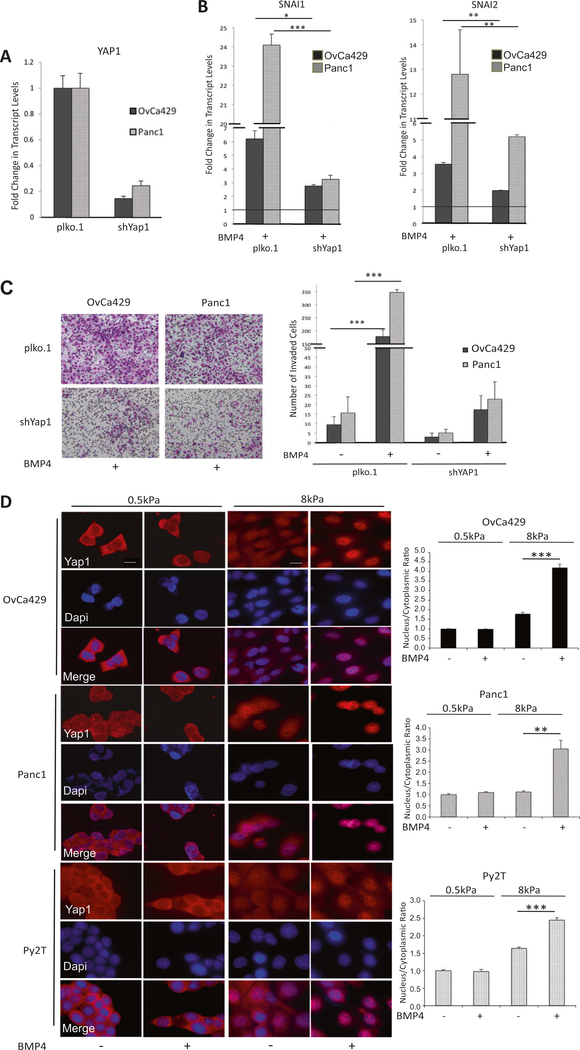
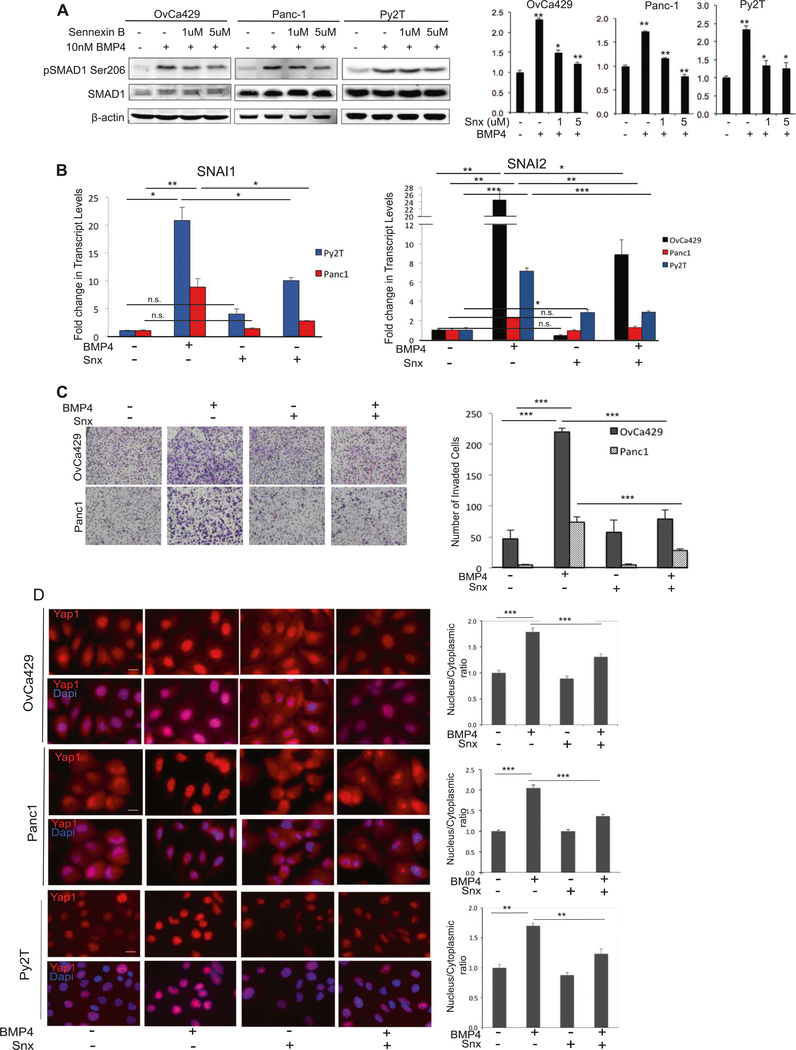
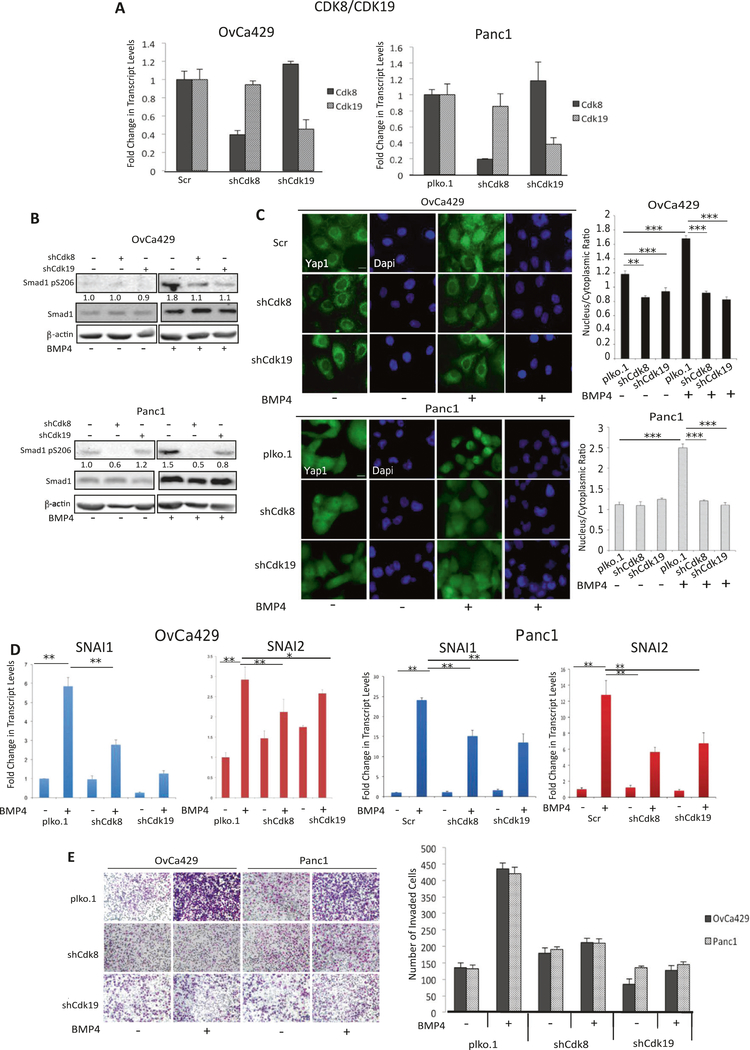
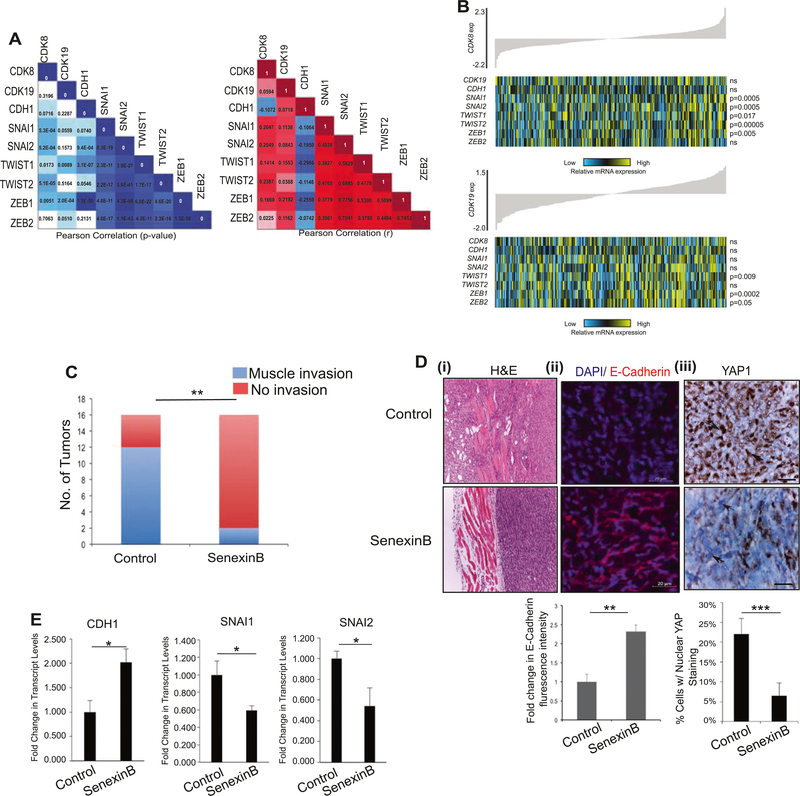
CDK8 is a transcription-regulating kinase that controls TGF-β/BMP-responsive SMAD transcriptional activation and turnover through YAP1 recruitment. However, how the CDK8/YAP1 pathway influences SMAD1 response in cancer remains unclear. Here we report that SMAD1-driven epithelial-to-mesenchymal transition (EMT) is critically dependent on matrix rigidity and YAP1 in a wide spectrum of cancer models. We find that both genetic and pharmacological inhibition of CDK8 and its homologous twin kinase CDK19 leads to abrogation of BMP-induced EMT. Notably, selectively blocking CDK8/19 specifically abrogates tumor cell invasion, changes in EMT-associated transcription factors, E-cadherin expression and YAP nuclear localization both in vitro and in vivo in a murine syngeneic EMT model. Furthermore, RNA-seq meta-analysis reveals a direct correlation between CDK8 and EMT-associated transcription factors in patients. Our findings demonstrate that CDK8, an emerging therapeutic target, coordinates growth factor and mechanical cues during EMT and invasion.


Conflict of interest statement

Conflict of interest I.B.R. is the founder and president and J.L., M.C., H.K., K.M, and E.V.B. are consultants of Senex Biotechnology, Inc. Other authors declare no conflict of interest.

Figures

Fig. 1
Fig. 1
BMP induces EMT in a spectrum of cancer cell lines. Human ovarian cancer cell line OvCA429, human pancreatic cancer cell line PANC1, and murine mammary cancer cell line Py2T were treated with 10 nM BMP4 for 4 days and a immunostained for phalloidin actin. b mRNA expression levels of SNAI1 and SNAI2 from indicated cells in the presence or absence of 10 nM BMP4 for 24 h analyzed by qRT-PCR. Values are normalized to their untreated controls. c Matrigel transwell invasion in response to BMP4 after 18 h of invasion. Images are of cells on the underside of the filter taken at × 10 and are representative of two independent biological replicates done in triplicate. *p < 0.05, **p < 0.01, ***p < 0.001. Graphs are representative of two independent biological trials done in triplicate for each cell line. (d Indicated cell lines treated with BMP2/4 as in a for indicated numbers of days and analyzed for E-cadherin protein levels by western blots or e by immunofluorescence
Fig. 2
Fig. 2
BMP4-induced EMT is suppressed on compliant substrates. a Phase contrast images of cells plated on soft (0.5 kPa) and rigid (8 kPa) fibronectin-coated hydrogels and treated with 10 nM BMP4 for up to 5 days to monitor any changes in morphology (Methods). b Immunofluorescence images of BMP4-treated OvCa429 and Panc1 cells plated on soft (0.5 kPa) and rigid (8 kPa) fibronectin-coated hydrogels as described in Methods. Cells were then immunostained for E-cadherin and phalloidin/actin as indicated. Scale bars = 20 μm. c Realtime quantitative PCR of SNAI1 and SNAI2 in OvCa429, Panc1, and Py2T cells plated on soft (0.5 kPa) and rigid (8 kPa) hydrogels followed by treatment with 10 nM BMP4 (Methods). Values are normalized to their untreated control. Graphs are representative of two independent biological trials done in triplicate. *p < 0.05, **p < 0.01, ***p < 0.001
Fig. 3
Fig. 3
BMP4-induced EMT is SMAD1 dependent. qRT-PCR of mRNA transcript levels for a SMAD1 and b SNAI1 and SNAI2 in OvCa429 and Panc1 cells transiently infected as described in methods with shRNA to SMAD1 or Scr controls and treated with 10 nM BMP4 for 24 h. Values are normalized to their respective untreated control (black horizontal line in b). c Images of shSMAD1- or control shScr–OvCa429 and Panc1 cells untreated or treated with BMP4 (10 nM), on Matrigel coated transwells after invasion for 18 h. Images are representative of two independent biological trials done in triplicate. Right graph represents the number of invading cells from four independent fields and two independent trials. d Immunofluorescence images of OvCa429, Panc1, and Py2T cells plated on soft (0.5 kPa) and rigid (8 kPa) fibronectin-coated hydrogels with or without 10 nM BMP4 treatment for 1 h followed by immunostaining with antiSMAD1. Overlay images are shown with the nuclear stain 4’6-diamidino-2-phenylindole. Scale bar = 20 μm. Quantitation of nuclear to cytoplasmic fluorescence intensity ratio is presented for each cell line (right graph). Error bars represent the standard error of the mean. *p < 0.05, **p < 0.01, ***p < 0.001
Fig. 4
Fig. 4
YAP1 enhances BMP4-induced EMT. a Real-time quantitative PCR of YAP1 mRNA in control and knockdown cell lines as indicated. b Relative change in transcription factors determined by qRT-PCR of SNAI1 and SNAI2 in OvCa429 and Panc1 cells expressing shYAP1 or shPlko.1 after being treated with BMP4 (10 nM) as described in Methods. Values are normalized to their untreated control (black horizontal line in b) c OvCa429 and Panc1 cells expressing shYAP1 or shPlko.1 were plated in transwell chambers coated with Matrigel in the absence or presence of BMP4 (10 nM). Cell invasion imaged after 18 h. (Right) Graphical representation of number of invaded cells from four independent fields. Error bars represent the standard error of the mean. d Immunofluorescence images of OvCa429, Panc1, and Py2T cells plated on soft (0.5 kPa) and rigid (8 kPa) fibronectin-coated PA hydrogels and then treated with BMP4 (10 nM) for 1 h. Cells were then immunostained with anti-YAP1. Scale bar = 20μm. Quantitation of nuclear to cytoplasmic fluorescence intensity ratio is presented for each cell line (right graphs). *p < 0.05, **p < 0.01, ***p < 0.001
Fig. 5
Fig. 5
CDK8/19 kinase activity is required for BMP4-induced EMT. a Effect of Senexin B on BMP4 (30 min treatment) induced SMAD1 phosphorylation at Ser206 in indicated cell lines in the absence or presence of Senexin B as indicated. Quantitation normalized to total SMAD1 for pSer206 from two independent biological trials for each cell line using LI-COR Biosciences linear range quantitation tool are presented (right graph). b Real-time quantitative PCR showing fold change in mRNA levels of SNAI1, SNAI2 transcription factors in indicated cells pre-treated with Senexin B for 30 min, then treated with BMP4 (10 nM) for 24 h. Graphs are representative of two independent biological trials done in triplicate. Error bars represent the standard error of the mean. c OvCa429 and Panc1 cells were pre-treated with Senexin B for 30 mins and plated in transwell chambers coated with Matrigel in the absence or presence of BMP4 (10 nM). Cells were allowed to invade for 18 h. (Graph) Graphical representation (right graph) of invading cells from four independent fields representing three independent biological trials. Error bars represent the standard error of the mean. d Immunofluorescence images of OvCa429, Panc1, and Py2T cells pre-treated for 30 mins with Senexin B (5 μM), then treated with BMP4 (10 nM) for 1 h followed by immunostaining with YAP1 Scale bars = 20μm. Quantitation of nuclear to cytoplasmic fluorescence intensity ratio is presented for each cell line (right graphs) *p < 0.05, **p < 0.01, ***p < 0.001
Fig. 6
Fig. 6
Knockdown of CDK8/19 suppresses BMP4-induced EMT. a Real-time quantitative PCR of CDK8 and CDK19 in OvCa429 and Panc1 cells upon transduction of shRNA to either CDK8 or CDK19 compared with control cells (either Scramble or vector plko.1 as indicated). b Stable CDK8 or CDK19 knockdown OvCa429 and Panc1 cells were treated with BMP4 (10 nM) for 1 h and then analyzed, via immunoblotting, with the indicated antibodies. c Immunofluorescence images of OvCa429 and Panc1 cells expressing shScr, shplko.1, shCDK8, or shCDK19, treated with BMP4 for 1 h and then immunostained with anti-YAP1. Scale bar = 20 μm. Quantitation of nuclear to cytoplasmic fluorescence intensity ratio is presented for each cell line (right graphs) *p < 0.05, **p < 0.01, ***p < 0.001. d Real-time quantitative PCR showing the mRNA levels for transcription factors SNAI1 and SNAI2 in Panc1 shPlko.1, shCDK8/19, or shCDK19 and treated with BMP4 (10 nM) for 24 h. Graphs are representative of two independent biological trials experiments done in triplicate. e OvCa429 and Panc1 shCDk8, shCDk19 or control derivatives as in a were allowed to invade for 18 h through transwell chambers coated with Matrigel in the absence or presence of BMP4 (10 nM). Images are cells on the underside of the chamber taken at × 10 and are representative of two independent biological trials done in triplicate. Graphical representation of invading cells from four independent fields is presented (Right graph). Error bars represent the standard error of the mean. *p < 0.05, **p < 0.01, ***p < 0.001
Fig. 7
Fig. 7
CDK8/19 correlates with markers of EMT in patients and inhibits EMT-associated invasion in vivo. a Pearson correlation demonstrating association between CDK8 and CDK19 with EMT markers in a panel of 283 high-grade serous ovarian tumors from TCGA. The left panel shows resulting p values while the right indicates the r-value. b Heat map of expression of CDK8 (upper panel) correlated with the expression of EMT markers SNAI1, SNAI2, TWIST1, TWIST2, and ZEB1 in high-grade serous ovarian tumors (n = 283). CDK19 expression (lower panel) corresponds with TWIST1 and ZEB1 mRNA levels. In each panel, tumor samples are arranged based on CDK8 or CDK19 expression, respectively, and relative expression of each gene is shown in the associated heat map; blue indicates low expression, whereas yellow corresponds to high mRNA levels. ce 1 × 10⁶ Py2T cells were injected into right and left mammary fat pads of FVB mice (n = 8/group, 16 tumors). After the appearance of measurable tumors on day 6, mice were randomized and fed either Senexin B medicated diet (Methods) or a normal diet. Mice were euthanized 32 days after implantation. c Tumors were analyzed at necropsy. Graph represents the number of tumors in either group with notable invasion into the muscle **p < 0.005 Χ2-test. d (i–iii) Representative images of tumor sections from c (i) H&E staining of invasion into muscle from tumors in c, (ii) confocal fluorescence images after immunostaining of tumor sections for E- cadherin and DAPI as indicated and described in Methods. Graph below represents fluorescence intensity quantitation from average of 10 random areas per sample from two independent tumors per group normalized to control tumor sections. (iii) Immunohistochemical staining of tumor sections labeled using anti-YAP1 as described in Methods. Arrows indicate YAP stained/unstained nuclei. Scale bar = 20μm. Graph below represents quantitation of percentage of tumor cells with nuclear YAP staining calculated in five random areas per sample from two independent tumors per group (Methods). e Real-time quantitative PCR of RNA extracted from tumors in c showing the mRNA levels for E-Cadherin (CDH1), and transcription factors SNAI1 and SNAI2 (n = 3 tumors/group) normalized to control tumors

References

    1. Hogan BL. Bone morphogenetic proteins: multifunctional regulators of vertebrate development. Genes Dev. 1996;10: 1580–1594. - PubMed
    1. Richter A, Valdimarsdottir L, Hrafnkelsdottir HE, Runarsson JF, Omarsdottir AR, Ward-van Oostwaard D, et al. BMP4 promotes EMT and mesodermal commitment in human embryonic stem cells via SLUG and MSX2. Stem Cells. 2014;32:636–648. - PubMed
    1. Padgett RW, Wozney JM, Gelbart WM. Human BMP sequencescan confer normal dorsal-ventral patterning in the Drosophila embryo. Proc Natl Acad Sci USA. 1993;90:2905–2909. - PMC - PubMed
    1. Chen M, Liang J, Ji H, Yang Z, Altilia S, Hu B, et al. CDK8/19 Mediator kinases potentiate induction of transcription by NFkappaB. Proc Natl Acad Sci USA. 2017;114:10208–10213. - PMC - PubMed
    1. Gordon KJ, Kirkbride KC, How T, Blobe GC. Bone morphogenetic proteins induce pancreatic cancer cell invasiveness through a Smad1-dependent mechanism that involves matrix metalloproteinase-2. Carcinogenesis. 2009;30:238–248. - PMC - PubMed

Publication types

MeSH terms

LinkOut - more resources