

Small Bowel Transit and Altered Gut Microbiota in Patients With Liver Cirrhosis
- PMID: 29780327
- PMCID: PMC5946013
- DOI: 10.3389/fphys.2018.00470
Small Bowel Transit and Altered Gut Microbiota in Patients With Liver Cirrhosis
Abstract
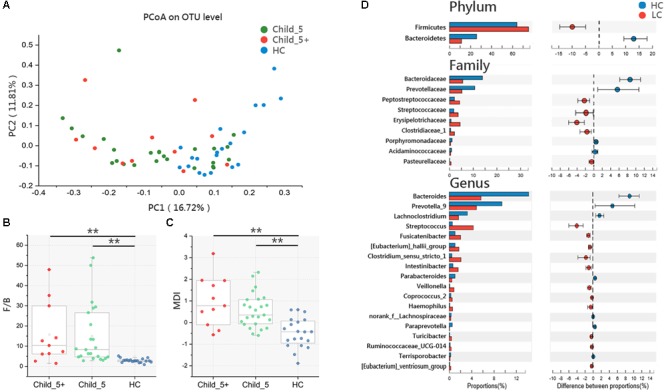
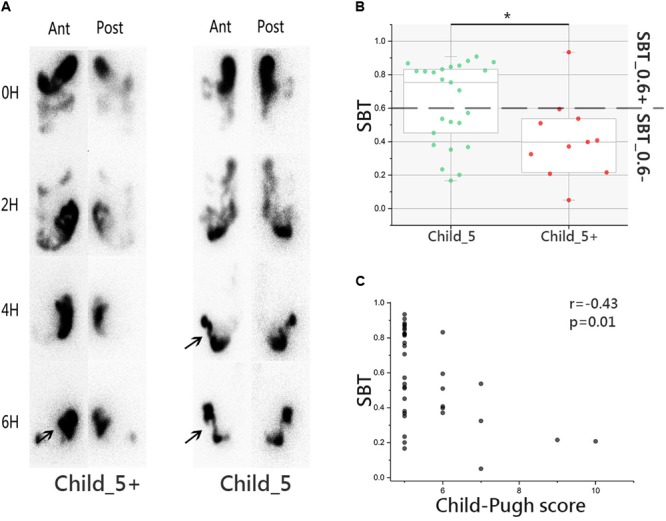
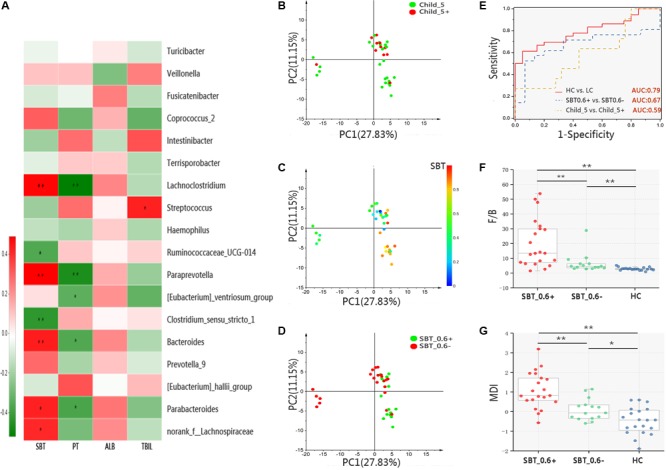
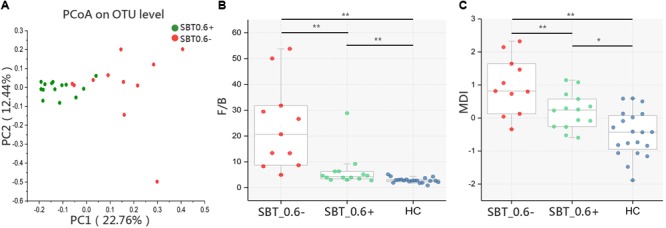
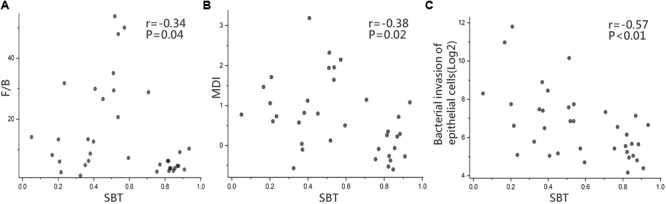
Disturbance of the gut microbiota is common in liver cirrhosis (LC) patients, the underlying mechanisms of which are yet to be unfolded. This study aims to explore the relationship between small bowel transit (SBT) and gut microbiota in LC patients. Cross-sectional design was applied with 36 LC patients and 20 healthy controls (HCs). The gut microbiota was characterized by 16S rRNA gene sequencing. The Firmicutes/Bacteroidetes (F/B) ratio and the Microbial Dysbiosis index (MDI) were used to evaluate the severity of microbiota dysbiosis. The scintigraphy method was performed in patients to describe the objective values of SBT. Patients were then subdivided according to the Child-Pugh score (threshold = 5) or SBT value (threshold = 0.6) for microbiota analysis. LC patients were characterized by an altered gut microbiota; F/B ratios and MDI were higher than HC in both Child_5 (14.00 ± 14.69 vs. 2.86 ± 0.99, p < 0.01; 0.49 ± 0.80 vs. -0.47 ± 0.69, p < 0.01) and Child_5+ (15.81 ± 15.11 vs. 2.86±0.99, p < 0.01; 1.11 ± 1.05 vs. -0.47 ± 0.69, p < 0.01) sub-groups in patients. Difference in the gut microbiota between Child_ 5 and Child_5+ patients was inappreciable, but the SBT was relatively slower in Child_5+ patients (43 ± 26% vs. 80 ± 15%, p < 0.05). Compared with the Child-Pugh score indicators, SBT showed stronger associations with bacterial genera. A clear difference in the gut microbiota was observed between SBT_0.6- and SBT_0.6+ patients [Pr(>F) = 0.0068, pMANOVA], with higher F/B ratios and MDI in SBT_0.6- patients (19.71 ± 16.62 vs. 7.33 ± 6.65, p < 0.01; 1.02 ± 0.97 vs. 0.20 ± 0.58, p < 0.01). Similar results were observed between the SBT_0.6- and SBT_0.6+ sub-groups of patients with normal liver function and a Child-Pugh score of 5. SBT was negatively correlated with both the F/B ratio and MDI (r = -0.34, p < 0.05; r = -0.38, p < 0.05). Interestingly, an increased capacity for the inferred pathway "bacterial invasion of epithelial cells" in patients, was highly negatively correlated with SBT (r = -0.57, p < 0.01). The severity of microbiota dysbiosis in LC patients depends on SBT rather than Child-Pugh score. SBT per se might be significantly related to the gut microbiota abnormalities observed in patients with LC.
Keywords: 16S rRNA gene; Child–Pugh score; gut microbiota; liver cirrhosis; small bowel transit.
Figures
Similar articles
-
Splenectomy Leads to Amelioration of Altered Gut Microbiota and Metabolome in Liver Cirrhosis Patients.Front Microbiol. 2018 May 15;9:963. doi: 10.3389/fmicb.2018.00963. eCollection 2018. Front Microbiol. 2018. PMID: 29867867 Free PMC article.
-
Correlation between the interleukin-36 subfamily and gut microbiota in patients with liver cirrhosis: Implications for gut-liver axis imbalance.World J Hepatol. 2025 Apr 27;17(4):105660. doi: 10.4254/wjh.v17.i4.105660. World J Hepatol. 2025. PMID: 40308824 Free PMC article.
-
Gut dysbiosis is associated with poorer long-term prognosis in cirrhosis.World J Hepatol. 2021 May 27;13(5):557-570. doi: 10.4254/wjh.v13.i5.557. World J Hepatol. 2021. PMID: 34131470 Free PMC article.
-
Gut microbiota and host metabolism in liver cirrhosis.World J Gastroenterol. 2015 Nov 7;21(41):11597-608. doi: 10.3748/wjg.v21.i41.11597. World J Gastroenterol. 2015. PMID: 26556989 Free PMC article. Review.
-
Effect of rifaximin on gut microbiota composition in advanced liver disease and its complications.World J Gastroenterol. 2015 Nov 21;21(43):12322-33. doi: 10.3748/wjg.v21.i43.12322. World J Gastroenterol. 2015. PMID: 26604640 Free PMC article. Review.
Cited by
-
Intestinal mucosal flora of the intestine-kidney remediation process of diarrhea with deficiency kidney-yang syndrome in Sishen Pill treatment: Association with interactions between Lactobacillus johnsonii, Ca2+-Mg2+-ATP-ase, and Na+-K+-ATP-ase.Heliyon. 2023 May 10;9(5):e16166. doi: 10.1016/j.heliyon.2023.e16166. eCollection 2023 May. Heliyon. 2023. PMID: 37215812 Free PMC article.
-
Tongue Coating Bacteria as a Potential Stable Biomarker for Gastric Cancer Independent of Lifestyle.Dig Dis Sci. 2021 Sep;66(9):2964-2980. doi: 10.1007/s10620-020-06637-0. Epub 2020 Oct 12. Dig Dis Sci. 2021. PMID: 33044677
-
Role of Gut Dysbiosis in Liver Diseases: What Have We Learned So Far?Diseases. 2019 Nov 12;7(4):58. doi: 10.3390/diseases7040058. Diseases. 2019. PMID: 31726747 Free PMC article. Review.
-
Gut-liver axis in cirrhosis: Are hemodynamic changes a missing link?World J Clin Cases. 2021 Nov 6;9(31):9320-9332. doi: 10.12998/wjcc.v9.i31.9320. World J Clin Cases. 2021. PMID: 34877269 Free PMC article.
-
Gut Dysbiosis and Hemodynamic Changes as Links of the Pathogenesis of Complications of Cirrhosis.Microorganisms. 2023 Aug 31;11(9):2202. doi: 10.3390/microorganisms11092202. Microorganisms. 2023. PMID: 37764046 Free PMC article.
References
-
- Bode J. C., Bode C., Heidelbach R., Durr H. K., Martini G. A. (1984). Jejunal microflora in patients with chronic alcohol abuse. Hepatogastroenterology 31 30–34. - PubMed
LinkOut - more resources
Full Text Sources
Other Literature Sources
Research Materials