. 2018 Feb 26;9(13):3324-3334.
doi: 10.1039/c7sc05334g. eCollection 2018 Apr 7.

Fluorescent dyes and probes for super-resolution microscopy of microtubules and tracheoles in living cells and tissues

Affiliations

Fluorescent dyes and probes for super-resolution microscopy of microtubules and tracheoles in living cells and tissues

Gražvydas Lukinavičius et al. Chem Sci. .

Abstract

We introduce fluorogenic tubulin probes based on the recently reported fluorescent dyes (510R, 580CP, GeR and SiR) and chemotherapy agents - taxanes (docetaxel, cabazitaxel and larotaxel). The cytotoxicity of the final probe, its staining performance and specificity strongly depend on both components. We found correlation between the aggregation efficiency (related to the spirolactonization of fluorophore) and cytotoxicity. Probe optimization allowed us to reach 29 ± 11 nm resolution in stimulated emission depletion (STED) microscopy images of the microtubule network in living human fibroblasts. Application to living fruit fly (Drosophila melanogaster) tissues highlighted two distinct structures: microtubules and tracheoles. We identified 6-carboxy isomers of 580CP and SiR dyes as markers for chitin-containing taenidia, a component of tracheoles. STED microscopy revealed correlation between the taenidia periodicity and the diameter of the tracheole. Combined tubulin and taenidia STED imaging showed close interaction between the microtubules and respiratory networks in living tissues of the insect larvae.


Figures

Fig. 1
Fig. 1. Chemical structures and spectra of fluorescent tubulin-binding probes. (a) Structures of paclitaxel and taxanes used for probe generation: docetaxel (Boc-DTX), cabazitaxel (Boc-CTX) and larotaxel (Boc-LTX). (b) Structures of fluorescent dyes together with the C8-linker used for the synthesis of the tubulin probes. (c) Absorption (dashed line) and emission (solid line) spectra of dyes used for the generation of the tubulin probes. (d) High-resolution cryo-electron microscopy reconstruction of β-tubulin (grey) bound to paclitaxel (green). For clarity, α-tubulin molecule, GTP/GDP and Mg2+ were omitted from the original PDB file (PDB ID: ; 5SYF). (e) Model of three different SiR probes (SiR-DTX – magenta, SiR-CTX – orange and SiR-LTX – blue) docked to β-tubulin. The same β-tubulin structure as in (d) is used.
Fig. 2
Fig. 2. Properties of fluorescent tubulin probes. (a) Proposed mechanism of cell permeability and cytotoxicity in living cells. Targeting moiety (grey triangle) of these probes contains taxanes (DTX – docetaxel, CTX – cabazitaxel or LTX – larotaxel), which are able to stabilize polymerised tubulin resulting in increased apparent polymerization rate. Black structure shows the spirolactone form, which is non-absorbing and non-fluorescent in the visible light spectral region, red – the absorbing and fluorescent zwitterion form. Grey hexagons indicate aggregates present in the equilibrium. The spirolactone form and aggregates (grey background on the left) are efficiently entering the cell. Inside, free spirolactone and zwitterion (grey background on the right) can stabilize tubulin and induce cytotoxicity. GTP – guanosine-5′-triphosphate, GDP – guanosine-5′-diphosphate. (b) Correlation between the fluorescence increase upon binding of 2 μM probes to 1 mg ml–1 tubulin and measured cytotoxicity in cells incubated in growth medium containing 1 μM probe after 24 h. Blue symbols correspond to 510R derivatives, green – 580CP derivatives, purple – GeR derivatives and red – SiR derivatives. Black line represents fitting to a linear equation. (c) Correlation between the probe aggregation efficiency in vitro and cytotoxicity after 24 h. In both cases probe concentration is 1 μM. Black line represents fitting to a dose–response equation in GraphPad Prism 6 (EC50 = 83 ± 22%). Data are presented as mean values with standard deviations, N ≥ 3. Dashed ellipse shows the region corresponding to the optimal probes showing moderate toxicity.
Fig. 3
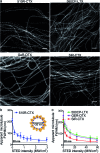
Fig. 3. STED nanoscopy of living cells stained with fluorescent tubulin probes. (a) Selected images of tubulin filaments chosen for each fluorescent dye. 510R-CTX images were acquired on a custom built STED microscope equipped with a 587 nm STED laser. 580CP-LTX, GeR-DTX and SiR-CTX images were recorded on an Abberior STED 775 QUAD scanning microscope. Scale bars: 1 μm. (b) The apparent microtubule FWHM as a function of the intensity of the 587 nm STED laser used for imaging of specimens stained with 510R-CTX. Data are presented as mean values with standard deviations, N ≥ 10 microtubules in at least 3 different fields of view. Insert shows Cryo-electron microscopy model of 13 reconstructed tubulin (orange) protofilaments in the microtubule cross-section bound to paclitaxel (blue). The model predicts the apparent diameter of the microtubule stained with taxane derivatives to be ∼20 nm. (c) The apparent microtubule FWHM as a function of the 775 nm STED laser intensity used for imaging of specimens stained with 580CP-LTX (green), GeR-DTX (purple) and SiR-CTX (red). Data are presented as mean values with standard deviations, N ≥ 10 microtubules in at least 3 different fields of view.
Fig. 4
Fig. 4. STED nanoscopy images of living tissues of Drosophila melanogaster larvae. (a) Larval brain stained with 1 μM SiR-CTX. (b) Intestine stained with 1 μM SiR-CTX. (c) Body wall muscle stained with 1 μM 580CP-LTX. White rectangles show locations of the zoom-in regions shown in the inserts. Scale bars: 10 μm in the large field of view and 1 μm in the zoom-in images. (d) Confocal and STED images of tracheoles stained with 1 μM SiR–COOH for 1 h. Scale bar: 1 μm. (e) Correlation between the tracheole diameter and periodicity of its taenidia. Periodicity is presented as mean with standard deviation, N ≥ 7. Tracheole diameter is presented as a single measurement in the region where periodicity was measured. (f) Two-color image of body wall muscle microtubule network stained with 1 μM 580CP-LTX and tracheoles stained with 1 μM SiR–COOH. Insert shows zoom-in image of the region shown in panel as a white rectangle. Image shows microtubule network following tracheole. Images were acquired on an Abberior STED 775 QUAD scanning microscope. Scale bars: 5 μm in the large field of view and 1 μm in the zoom-in image.

References

    1. Sahl S. J., Hell S. W., Jakobs S. Nat. Rev. Mol. Cell Biol. 2017;18:685–701. - PubMed
    2. Hell S. W. Angew. Chem., Int. Ed. Engl. 2015;54:8054–8066. - PubMed
    1. Grimm J. B., Muthusamy A. K., Liang Y., Brown T. A., Lemon W. C., Patel R., Lu R., Macklin J. J., Keller P. J., Ji N., Lavis L. D. Nat. Methods. 2017;14:987–994. - PMC - PubMed
    2. Butkevich A. N., Belov V. N., Kolmakov K., Sokolov V. V., Shojaei H., Sidenstein S. C., Kamin D., Matthias J., Vlijm R., Engelhardt J., Hell S. W. Chem.–Eur. J. 2017;23:12114–12119. - PMC - PubMed
    3. Lukinavičius G., Reymond L., D'Este E., Masharina A., Gottfert F., Ta H., Guther A., Fournier M., Rizzo S., Waldmann H., Blaukopf C., Sommer C., Gerlich D. W., Arndt H. D., Hell S. W., Johnsson K. Nat. Methods. 2014;11:731–733. - PubMed
    4. Umezawa K., Yoshida M., Kamiya M., Yamasoba T., Urano Y. Nat. Chem. 2017;9:279–286. - PubMed
    5. Zhang G., Zheng S., Liu H., Chen P. R. Chem. Soc. Rev. 2015;44:3405–3417. - PubMed
    1. Lavis L. D. Biochemistry. 2017;56:5165–5170. - PubMed
    2. Lukinavičius G., Johnsson K. Nat. Chem. 2014;6:663–664. - PubMed
    1. Terai T., Nagano T. Pflugers Arch. 2013;465:347–359. - PubMed
    1. Rohena C. C., Mooberry S. L. Nat. Prod. Rep. 2014;31:335–355. - PMC - PubMed

LinkOut - more resources