. 2018 Mar 16;9(15):3729-3741.
doi: 10.1039/c8sc00015h. eCollection 2018 Apr 21.

Macrophage-mediated delivery of light activated nitric oxide prodrugs with spatial, temporal and concentration control

Affiliations

Macrophage-mediated delivery of light activated nitric oxide prodrugs with spatial, temporal and concentration control

Michael A Evans et al. Chem Sci. .

Abstract

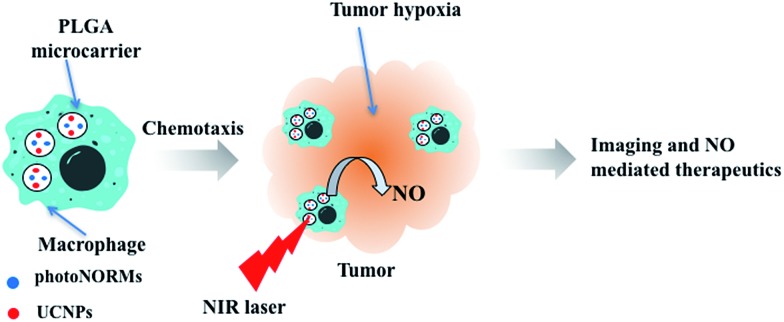
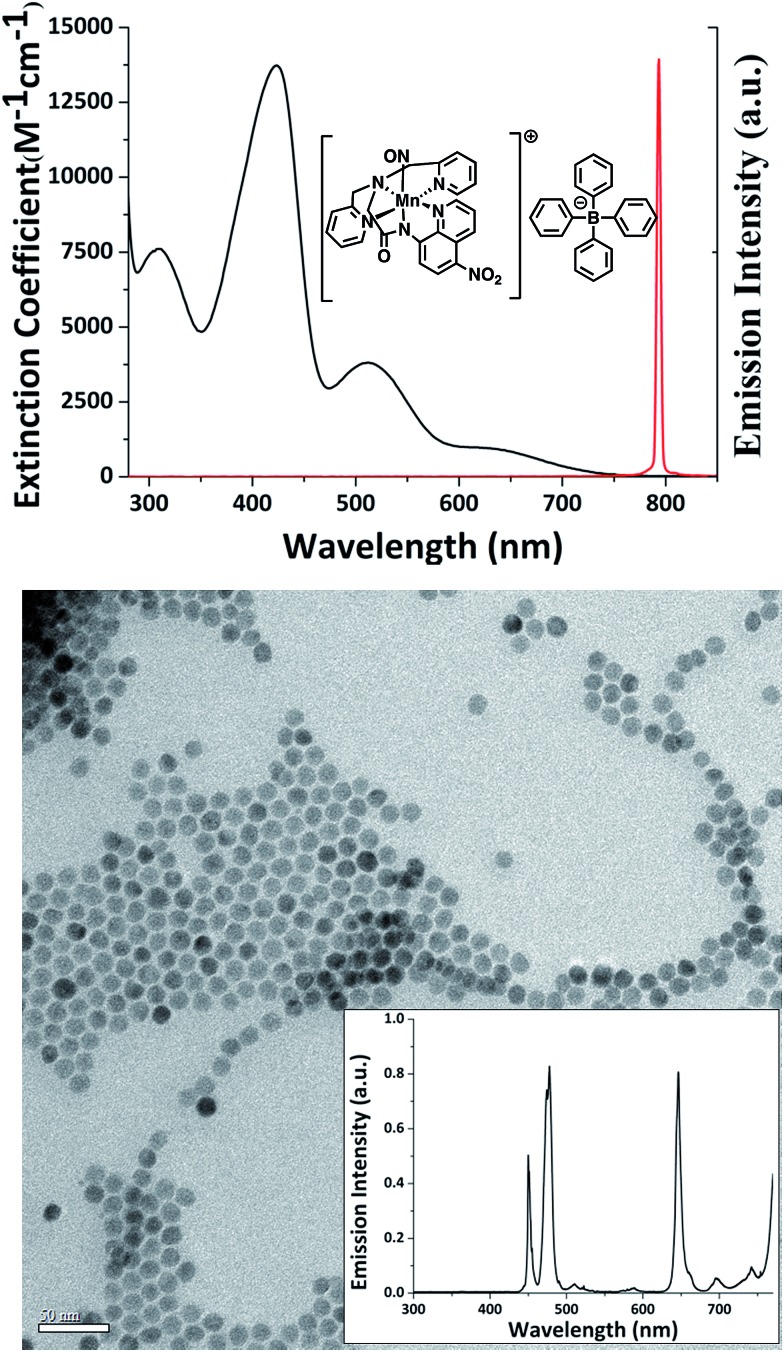
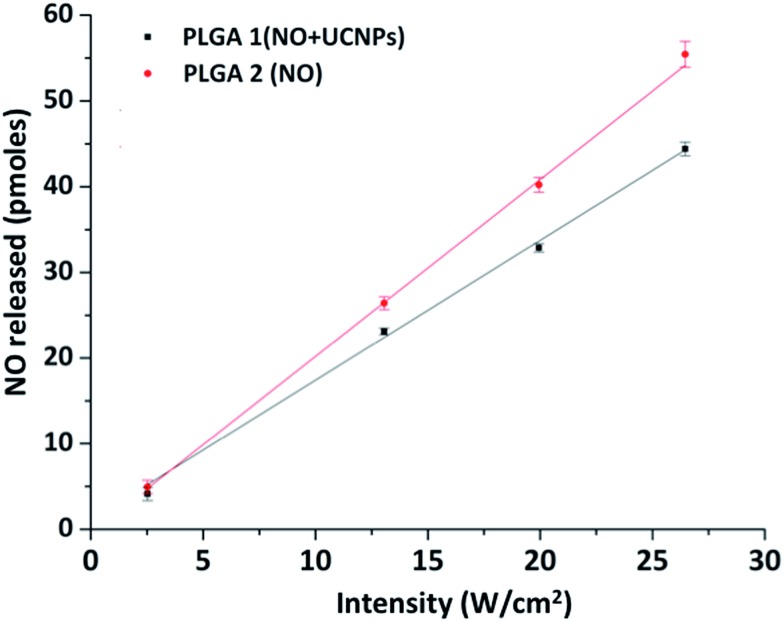
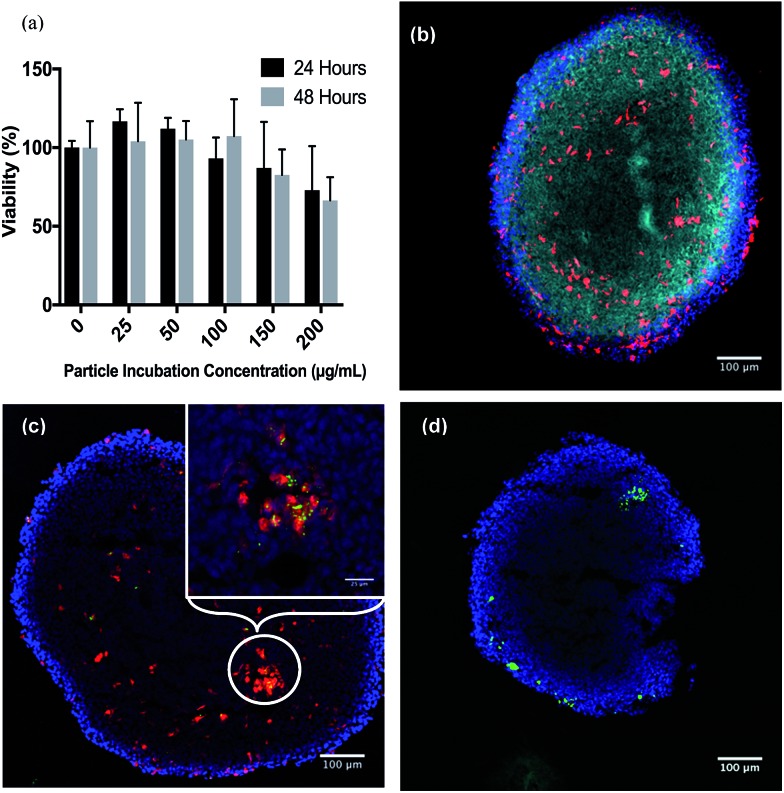
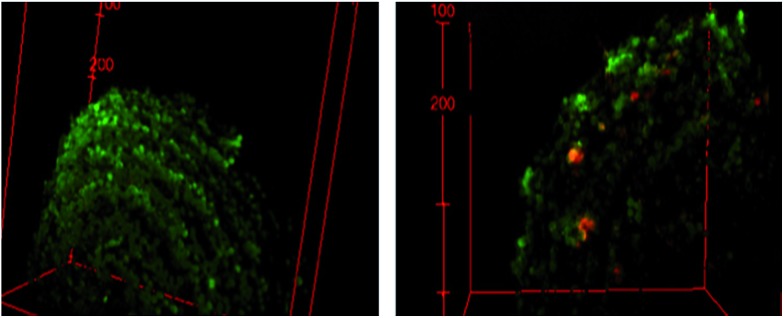
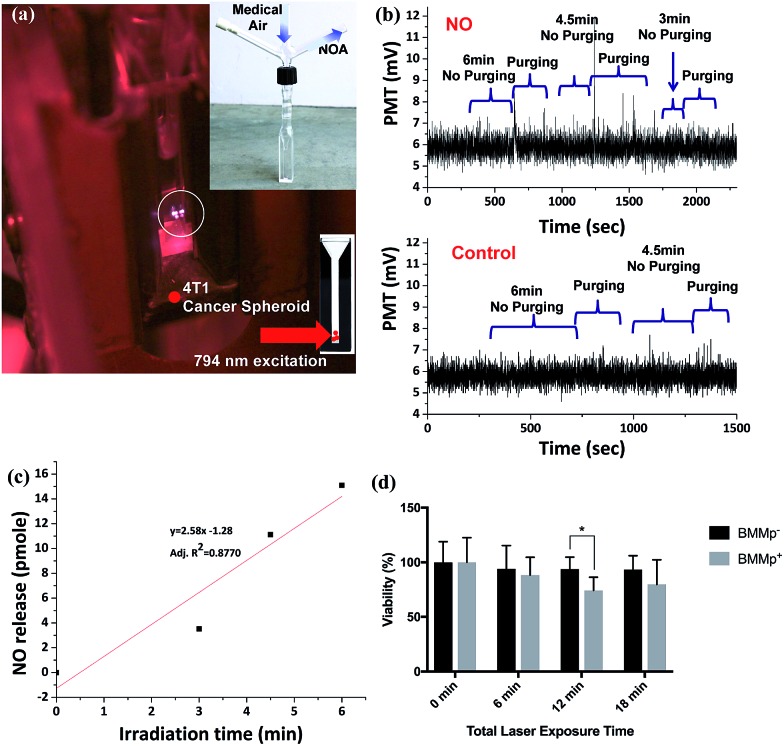
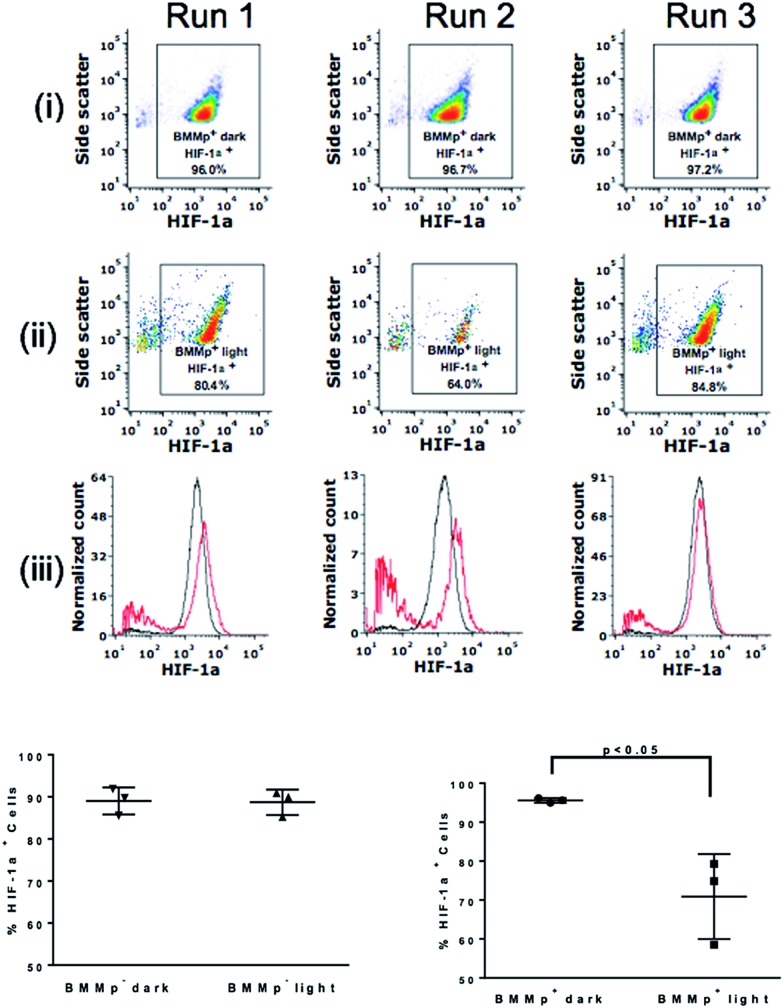
Nitric oxide (NO) holds great promise as a treatment for cancer hypoxia, if its concentration and localization can be precisely controlled. Here, we report a "Trojan Horse" strategy to provide the necessary spatial, temporal, and dosage control of such drug-delivery therapies at targeted tissues. Described is a unique package consisting of (1) a manganese-nitrosyl complex, which is a photoactivated NO-releasing moiety (photoNORM), plus Nd3+-doped upconverting nanoparticles (Nd-UCNPs) incorporated into (2) biodegradable polymer microparticles that are taken up by (3) bone-marrow derived murine macrophages. Both the photoNORM [Mn(NO)dpaqNO2 ]BPh4(dpaqNO2 = 2-[N,N-bis(pyridin-2-yl-methyl)]-amino-N'-5-nitro-quinolin-8-yl-acetamido) and the Nd-UCNPs are activated by tissue-penetrating near-infrared (NIR) light at ∼800 nm. Thus, simultaneous therapeutic NO delivery and photoluminescence (PL) imaging can be achieved with a NIR diode laser source. The loaded microparticles are non-toxic to their macrophage hosts in the absence of light. The microparticle-carrying macrophages deeply penetrate into NIH-3T3/4T1 tumor spheroid models, and when the infiltrated spheroids are irradiated with NIR light, NO is released in quantifiable amounts while emission from the Nd-UCNPs provides images of microparticle location. Furthermore, varying the intensity of the NIR excitation allows photochemical control over NO release. Low doses reduce levels of hypoxia inducible factor 1 alpha (HIF-1α) in the tumor cells, while high doses are cytotoxic. The use of macrophages to carry microparticles with a NIR photo-activated theranostic payload into a tumor overcomes challenges often faced with therapeutic administration of NO and offers the potential of multiple treatment strategies with a single system.


Figures

Scheme 1
Scheme 1. Illustration of macrophage cellular Trojan Horse strategy to carry polymer based microparticles containing a photochemical precursor of NO (photoNORM) plus upconverting nanoparticles (UCNPs) into a tumor. NIR activation of the photoNORM/UCNP combination releases NO to mediate the tumor environment in order to facilitate various types of therapy as well as providing the opportunity for photoluminescence imaging.
Fig. 1
Fig. 1. Top: absorption spectrum of [Mn(dpaqNO2)(NO)]BPh4 (I) in acetonitrile. The red spike at the right is the spectrum of the 794 nm diode laser. Bottom: TEM image of the core–shell the nano-particles NaYF4:Yb/Gd/Nd/Tm (30/20/1/0.5%)@NaGdF4:Nd (20%). Inset: upconversion emission spectrum of Nd-UCNPs under excitation by an 800 nm CW laser.
Fig. 2
Fig. 2. Plots of the NOA detected NO released vs. laser intensity (W cm–2) for the CW 794 nm photolysis of PBS suspensions of the microcarriers PLGA-1 (black) and PLGA-2 (red).
Fig. 3
Fig. 3. (a) Viability of BMMs with various particle incubation concentrations after 24 and 48 h. (b)–(d) Are slices of 4T1/NIH-3T3 co-cultured breast tumor spheroids imaged by confocal microscopy. Blue is 4′,6-diamidino-2-phenylindole (DAPI) and red represents macrophages stained with CellTracker™ deep red. Green spots in (c) and (d) are Cy-3–IgG labeled microparticles. (b) Spheroids stained with a Hypoxyprobe™ Red549 to label hypoxia (cyan). (c) Spheroid incubated with microparticles-laden BMMs. (d) Spheroid incubated only with IgG modified PLGA microparticles.
Fig. 4
Fig. 4. Z-stack two-photon confocal images (dimensions = 508.4 μm × 508.4 μm) of live spheroids containing BMMs (left) with blank particles and (right) with UCNP and NO-donor loaded particles. Spheroids were stained with calcein AM (green). Particles were identified via emission (red) from embedded UCNPs with laser excitation at 810 nm and a pulse energy of 37.5 nJ. The wavelength range for detection of UCNP emission was 420–460 nm.
Fig. 5
Fig. 5. (a) The NIH/3T3:4T1 tumor spheroids in 1 mL Hank's buffered salt solution (HBSS) under 794 nm laser irradiation (photo by Ping-Lin Yang). Inset (up): a modified 1 mL cuvette for photolysis experiment of cancer spheroids. Inset (down): the scheme represents that the spheroids can be placed at the corner of the cuvette and exposed to NIR laser excitation. (b) Up: NO released from five spheroids infiltrated with bone marrow macrophages loaded with PLGA microparticles containing I and Nd-UCNPs under 794 nm laser irradiation with 13.1 W cm–2. Down: the control experiment of six spheroids loaded with PLGA microparticles. (c) Plot of NO detected vs. irradiation time. (d) The viability of spheroids after 6, 12, or 18 min of laser exposure in 6 min increments. Viability was measured using a PNPP assay 24 h after spheroid treatment. *p ≤ 0.05 (Students t-test).
Fig. 6
Fig. 6. Top: flow cytometry analysis of dissociated tumor spheroids stained for HIF-1α under different treatments. Gated cells correlate with a positive signal from staining. (i) and (ii) Three runs of analysis for spheroids loaded with PLGA microparticles incorporating I and Nd-UCNPs with and without 735 nm LED irradiation at 0.58 mW cm–2 for 8.5 h. (iii) The comparison of (i) and (ii) for each run. Red and black lines represent particles with and without light irradiation respectively. Bottom: the summary of flow cytometry analysis for the control (i) and the NO release study (ii).

References

    1. Ridnour L. A., Thomas D. D., Switzer C., Flores-Santana W., Isenberg J. S., Ambs S., Roberts D. D., Wink D. A. Nitric Oxide. 2008;19:73–76. - PMC - PubMed
    2. Mocellin S., Bronte V., Nitti D. Med. Res. Rev. 2007;27:317–352. - PubMed
    1. Thomas D. D., Liu Z. P., Kantrow S. P., Lancaster J. R. Proc. Natl. Acad. Sci. U. S. A. 2001;98:355–360. - PMC - PubMed
    1. Makings L. R., Tsien R. Y. J. Biol. Chem. 1994;269:6282–6285. - PubMed
    1. Farrer N. J., Salassa L., Sadler P. J. Dalton Trans. 2009:10690–10701. - PMC - PubMed
    1. Sgambellone M. A., David A., Garner R. N., Dunbar K. R., Turro C. J. Am. Chem. Soc. 2013;135:11274–11282. - PubMed