

An examination of the impact of Olson's extinction on tetrapods from Texas
- PMID: 29780669
- PMCID: PMC5958880
- DOI: 10.7717/peerj.4767
An examination of the impact of Olson's extinction on tetrapods from Texas
Abstract
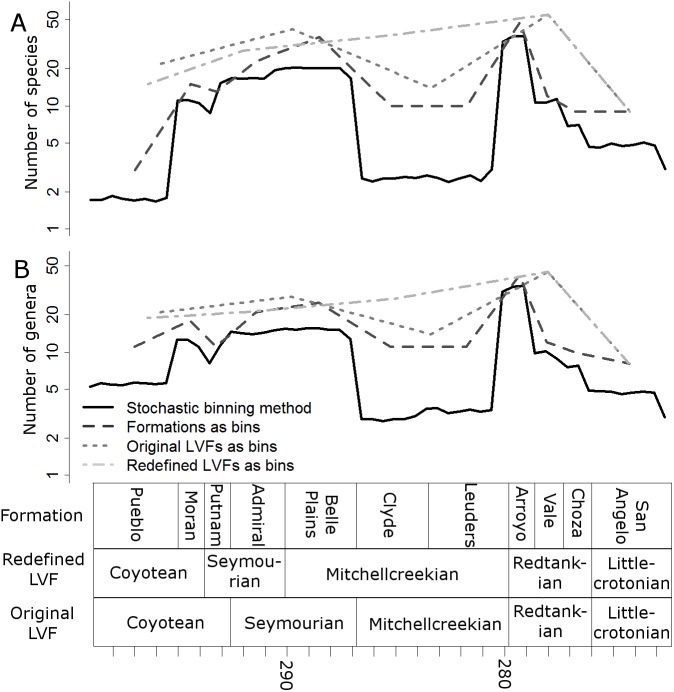
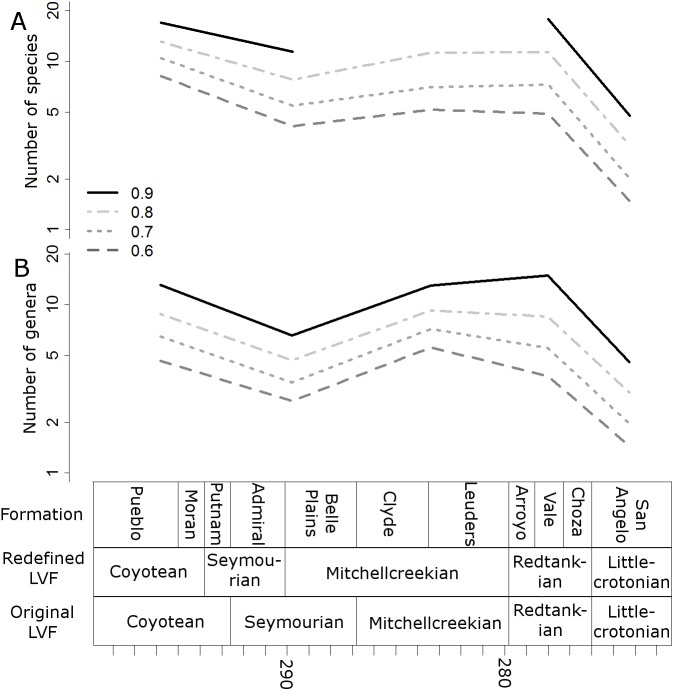
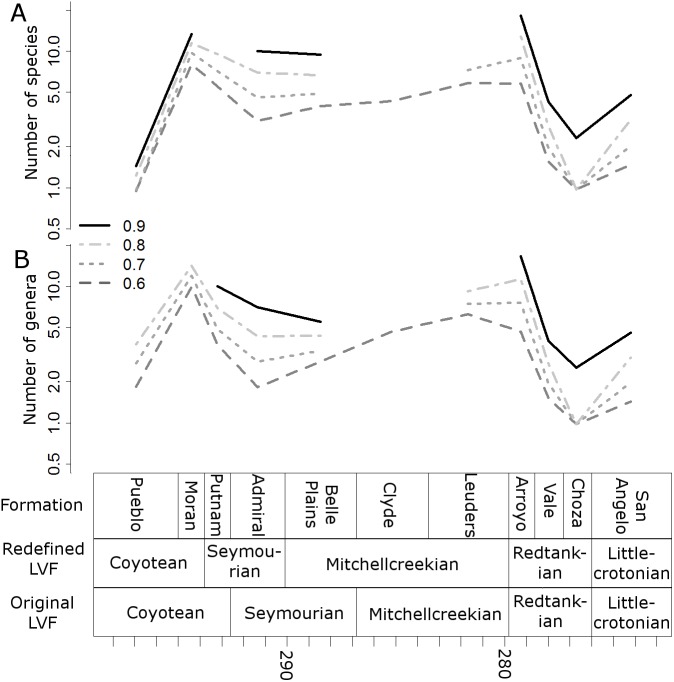
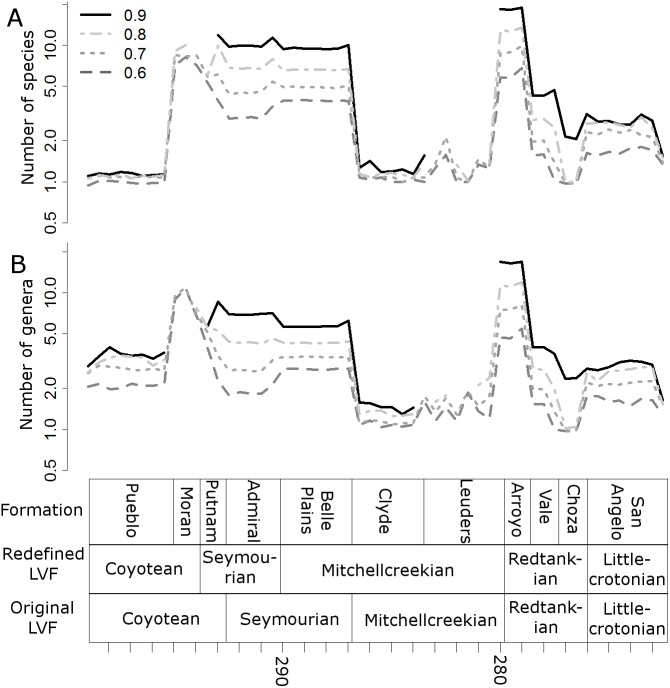
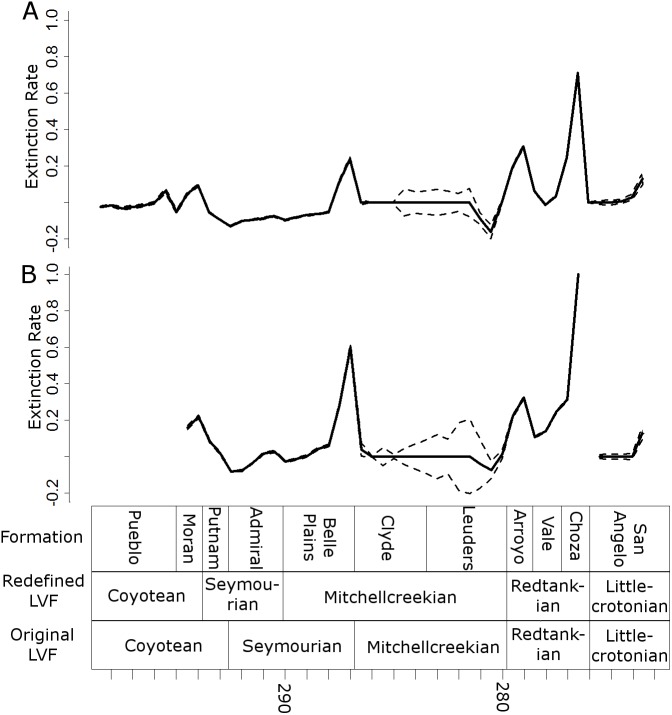
It has been suggested that a transition between a pelycosaurian-grade synapsid dominated fauna of the Cisuralian (early Permian) and the therapsid dominated fauna of the Guadalupian (middle Permian) was accompanied by, and possibly driven by, a mass extinction dubbed Olson's Extinction. However, this interpretation of the record has recently been criticised as being a result of inappropriate time-binning strategies: calculating species richness within international stages or substages combines extinctions occurring throughout the late Kungurian stage into a single event. To address this criticism, I examine the best record available for the time of the extinction, the tetrapod-bearing formations of Texas, at a finer stratigraphic scale than those previously employed. Species richness is calculated using four different time-binning schemes: the traditional Land Vertebrate Faunachrons (LVFs); a re-definition of the LVFs using constrained cluster analysis; individual formations treated as time bins; and a stochastic approach assigning specimens to half-million-year bins. Diversity is calculated at the genus and species level, both with and without subsampling, and extinction rates are also inferred. Under all time-binning schemes, both at the genus and species level, a substantial drop in diversity occurs during the Redtankian LVF. Extinction rates are raised above background rates throughout this time, but the biggest peak occurs in the Choza Formation (uppermost Redtankian), coinciding with the disappearance from the fossil record of several of amphibian clades. This study, carried out at a finer stratigraphic scale than previous examinations, indicates that Olson's Extinction is not an artefact of the method used to bin data by time in previous analyses.
Keywords: Olson’s extinction; Permian; Redtankian; Tetrapods; Texas; Time bins.
Conflict of interest statement
The authors declare there are no competing interests.
Figures


References
-
- Alroy J. Equilibrial diversity dynamics in North American mammals. In: McKinney ML, Drake JA, editors. Biodiversity dynamics: turnover of populations, taxa and communities. Columbia University Press; New York: 1998. pp. 233–287.
-
- Alroy J. Geographical, environmental and intrinsic biotic controls on Phanerozoic marine diversification. Palaeontology. 2010a;53:1211–1235. doi: 10.1111/j.1475-4983.2010.01011.x. - DOI
-
- Alroy J. Fair sampling of taxonomic richness and unbiased estimation of origination and extinction rates. The Paleontological Society Papers. 2010b;16:55–80. doi: 10.1017/S1089332600001819. - DOI
-
- Alroy J. Accurate and precise estimates of origination and extinction rates. Paleobiology. 2014;40:374–397. doi: 10.1666/13036. - DOI
LinkOut - more resources
Full Text Sources
Other Literature Sources
