. 2016 Mar 16;121(5):2060-2074.
doi: 10.1002/2015JD023929. Epub 2016 Feb 4.

Spatiotemporal drought variability in the Mediterranean over the last 900 years

Affiliations

Spatiotemporal drought variability in the Mediterranean over the last 900 years

Benjamin I Cook et al. J Geophys Res Atmos. .

Abstract

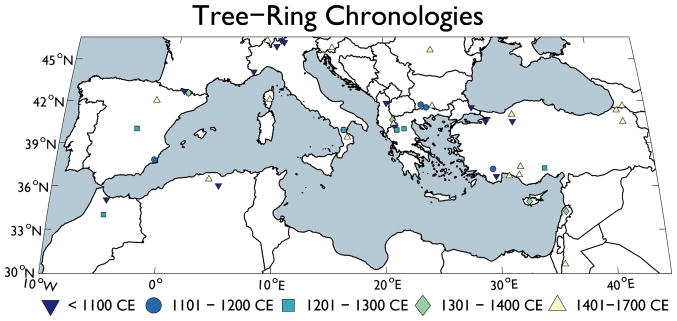
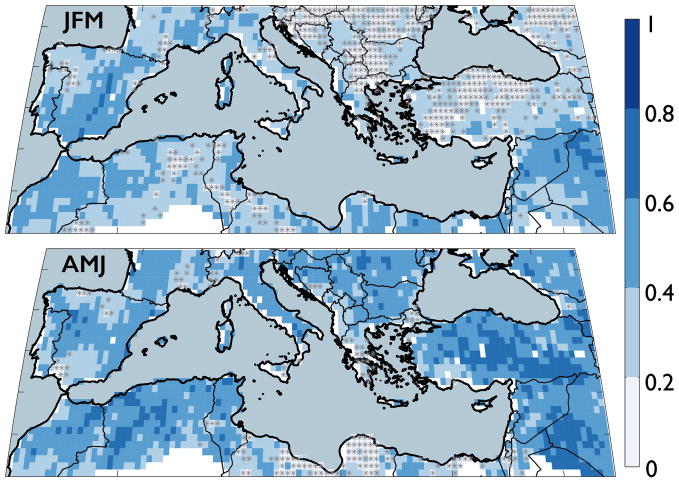
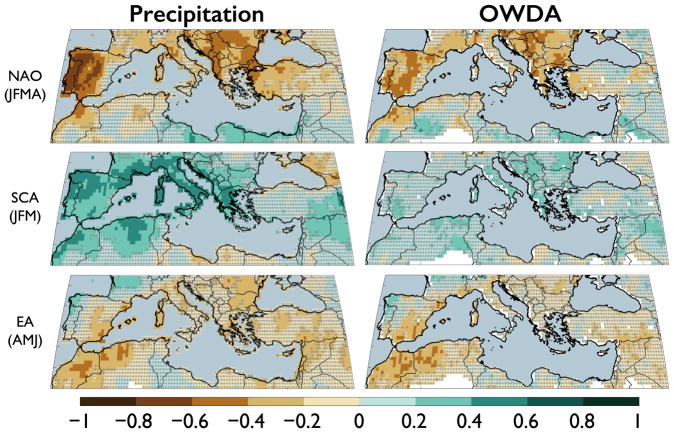
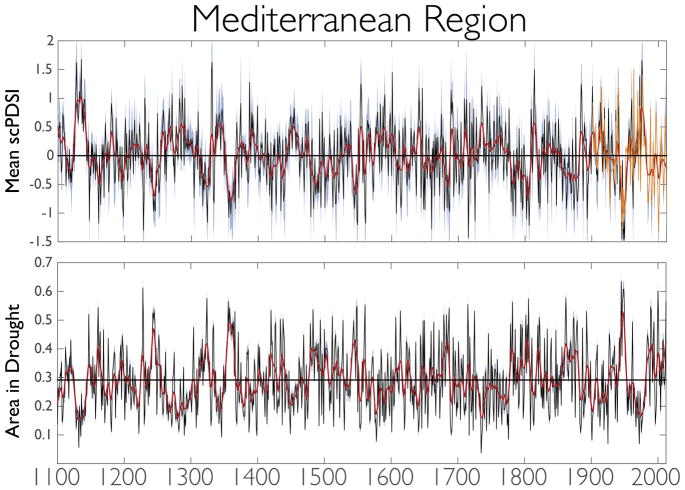
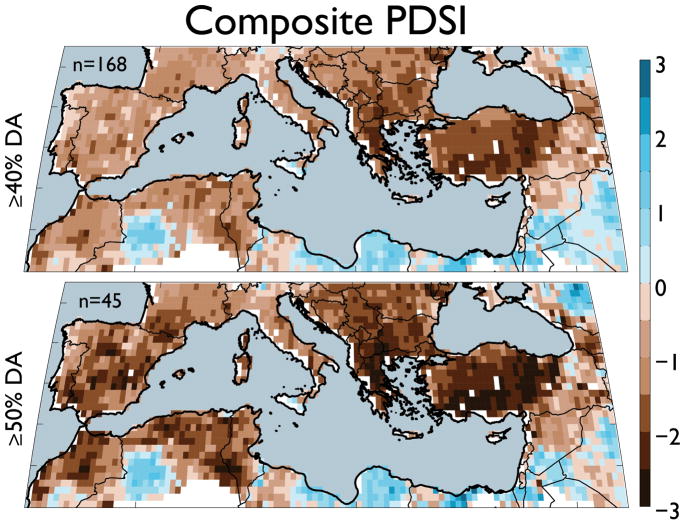
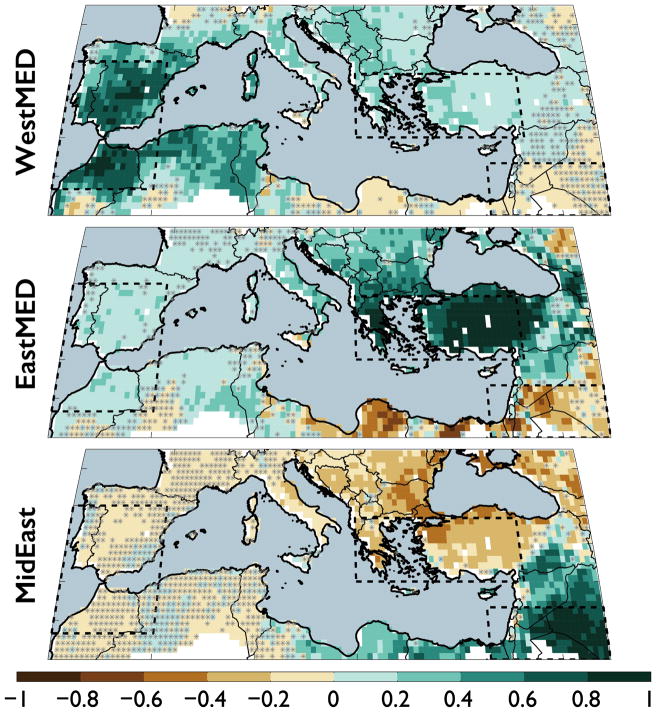
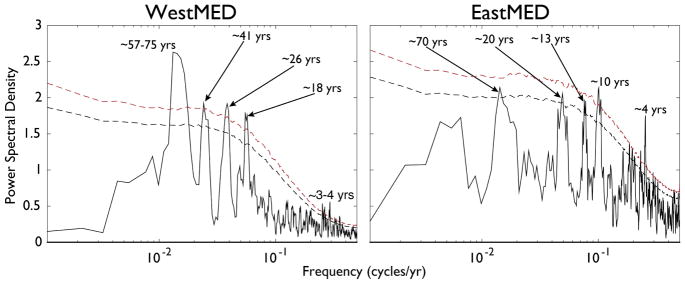
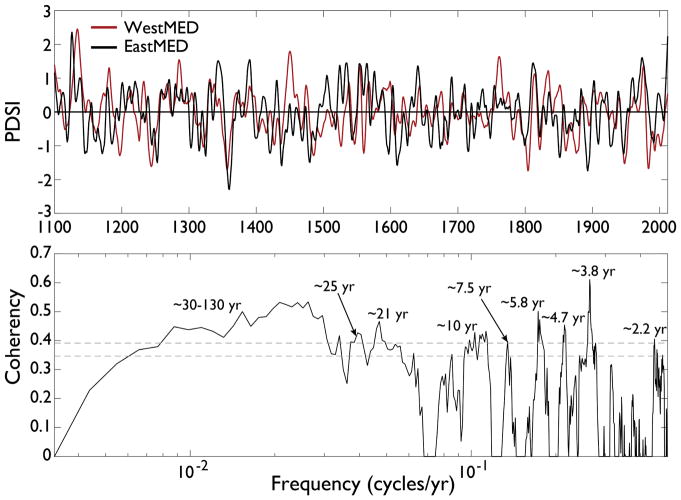
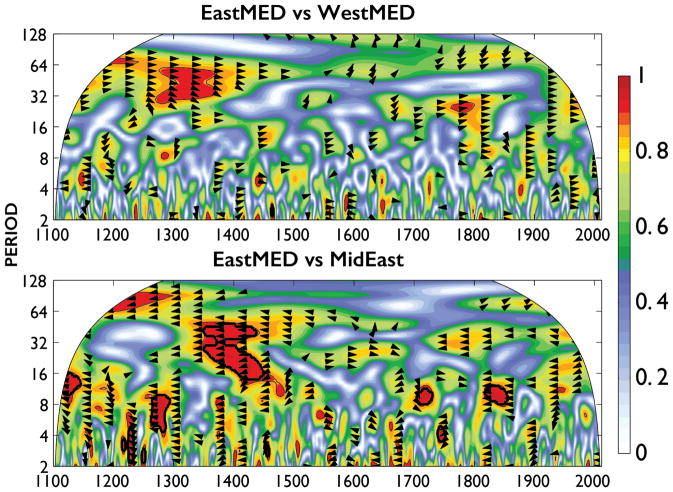
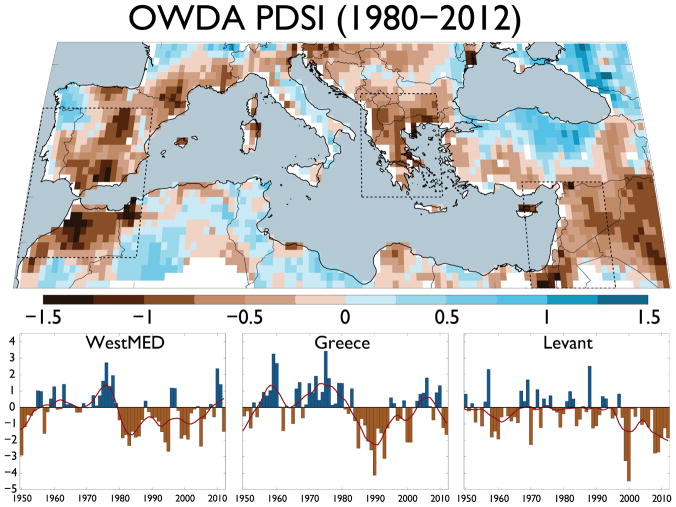
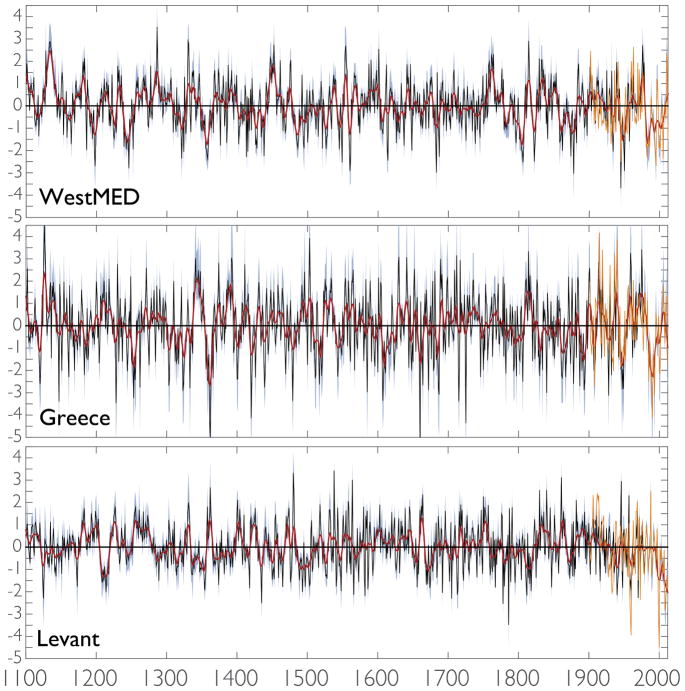
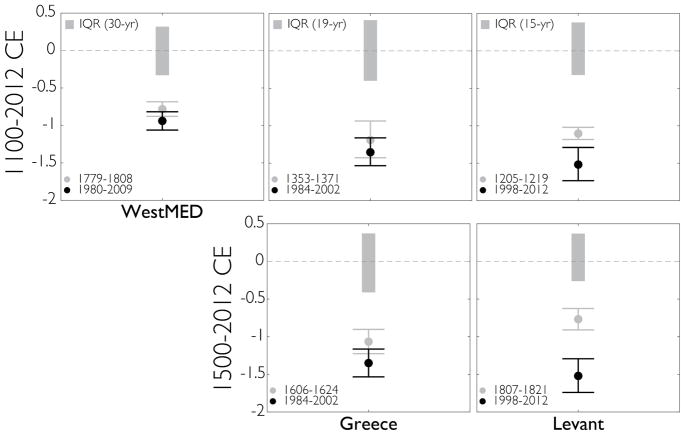
Recent Mediterranean droughts have highlighted concerns that climate change may be contributing to observed drying trends, but natural climate variability in the region is still poorly understood. We analyze 900 years (1100-2012) of Mediterranean drought variability in the Old World Drought Atlas (OWDA), a spatiotemporal tree-ring reconstruction of the June-July-August self calibrating Palmer Drought Severity Index. In the Mediterranean, the OWDA is highly correlated with spring precipitation (April-June), the North Atlantic Oscillation (January-April), the Scandinavian Pattern (January-March), and the East Atlantic Pattern (April-June). Drought variability displays significant east-west coherence across the basin on multi-decadal to centennial time scales and north-south anti-phasing in the eastern Mediterranean, with a tendency for wet anomalies in the Black Sea region (e.g., Greece, Anatolia, the Balkans, etc) when coastal Libya, the southern Levant, and the Middle East are dry, possibly related to the North Atlantic Oscillation. Recent droughts are centered in the Western Mediterranean, Greece, and the Levant. Events of similar magnitude in the Western Mediterranean and Greece occur in the OWDA, but the recent 15-year drought in the Levant (1998-2012) is the driest in the record. Estimating uncertainties using a resampling approach, we conclude there is an 89% likelihood this drought is drier than any comparable period of the last 900 years and a 98% likelihood it is drier than the last 500 years. These results confirm the exceptional nature of this drought relative to natural variability in recent centuries, consistent with studies that have found evidence for anthropogenically forced drying in the region.


Figures

Figure 1
Figure 1
Locations of tree-ring chronologies in the Mediterranean region of the Old World Drought Atlas. Colors and marker shapes indicate the approximate start dates of the various chronologies.
Figure 2
Figure 2
Point-by-point Spearman’s rank correlation coefficients between CRU 3.21 precipitation totals (JFM and AMJ) and OWDA summer season (JJA) scPDSI. Correlations are calculated over the period 1950–2012 CE. Regions of insignificant correlation (p> 0.05) are masked by grey asterisks.
Figure 3
Figure 3
Spearman’s rank correlation coefficients between the teleconnection indices (NAO, SCA, EA) and simultaneous season CRU 3.21 precipitation totals (left column) and OWDA summer season scPDSI (right column). Correlations are calculated over the period 1950–2012 CE. Regions of insignificant correlation (p> 0.05) are masked by grey asterisks.
Figure 4
Figure 4
Area average scPDSI for the entire Mediterranean domain in the OWDA (30°N– 47°N, 10°W–45°E) (top) and percent land area in drought (scPDSI≤ −1) (bottom) from 1100–2012 CE. Red curves are smoothed versions of the time series using a 10-year loess smooth. In the top panel, regional average scPDSI calculated from the instrumental target dataset for the OWDA reconstruction is overlain in orange. The horizontal line in the lower panel is the longterm average fractional area in drought from 1100–2012 CE (29%). Grey-blue shading indicates the 95th confidence intervals, estimated using a BCa bootstrap.
Figure 5
Figure 5
Multi-year average scPDSI for different pan-basin drought and pluvial events in the OWDA.
Figure 6
Figure 6
Composite average scPDSI for years in the OWDA with drought area (DA; scPDSI≤ −1) exceeding 40% (n =168 years) and 50% (n =45 years) of the total land area in the Mediterranean domain.
Figure 7
Figure 7
Point-by-point Spearman’s rank correlations (1100–2012) between OWDA scPDSI and the western Mediterranean (WestMED; 32°N–42°N, 10°W–0°), eastern Mediterranean (EastMED; 36°N–41°N, 20°E–37°E), and Middle East (MidEast; 30°N–34°N, 33°E–47°E) regional average scPDSI time series. Regions of insignificant correlation (p> 0.05) are masked by grey asterisks.
Figure 8
Figure 8
Power spectral density (Multi-taper Method, 3 tapers) for the WestMED and EastMED regional average scPDSI series. Red and black dashed lines are the 95th and 90th percentile confidence limits, respectively, estimated from 10,000 AR(1) series generated from the original time series.
Figure 9
Figure 9
Smoothed versions (10-year loess smooth) of the WestMED and EastMED time series (top) and the coherency spectra between unsmoothed versions of the two time series (bottom). Numbers in the bottom panel highlight regions of significant coherency.
Figure 10
Figure 10
Squared wavelet coherence for EastMED versus WestMED (top) and EastMED versus MidEast (bottom). Black arrows indicate where the two time series have significant (p ≤ 0.05) shared variance. Relative phasing is indicated by the direction of the arrows; right pointing arrows indicates series are in phase, left pointing are 180 degrees out of phase.
Figure 11
Figure 11
Multi-year average scPDSI for 1980–2012 (top) with regions of recent and persistent drought outlined in dashed black lines: WestMED (32°N–42°N, 10°W–0°), Greece (36°N–43°N, 19°E–26°), and the Levant (30°N–37°N, 33°E–40°E). Also shown (bottom) are the regional average scPDSI time series from these regions for 1950–2012 (red line is a 10-year loess smoother).
Figure 12
Figure 12
Re-centered (zero mean from 1100–2012 CE) time series for WestMED, Greece, and the Levant region. Red lines represent smoothed versions using a 10-year loess smoother. Grey-blue shading indicates the 95th confidence intervals, estimated using a BCa bootstrap. In each panel, regional average scPDSI calculated from the instrumental target dataset for the reconstructions is overlain in orange.
Figure 13
Figure 13
In the top row: comparisons between multi-year average, re-centered scPDSI during recent decades (black dots) and the driest previous periods of the same length in the OWDA from 1100–2012 CE (grey dots). Grey bars are the interquartile range (IQR) of mean PDSI values for all moving windows of the same length in each region. Whiskers are the 25th and 75th confidence limits for the dry events, estimated from 10,000 resamplings with replacement from scPDSI values during these intervals. Bottom row: same as top, but restricting the analysis to 1500–2012 CE, when there is increased proxy availability in regions like the Levant.

References

    1. Akkemik U, Aras A. Reconstruction (1689–1994 AD) of April–August precipitation in the southern part of central Turkey. International Journal of Climatology. 2005;25(4):537–548. doi: 10.1002/joc.1145. - DOI
    1. Andreu L, Gutiérrez E, Macias M, Ribas M, Bosch O, Camarero JJ. Climate increases regional tree-growth variability in Iberian pine forests. Global Change Biology. 2007;13(4):804–815. doi: 10.1111/j.1365-2486.2007.01322.x. - DOI
    1. Barnston AG, Livezey RE. Classification, Seasonality and Persistence of Low-Frequency Atmospheric Circulation Patterns. Monthly Weather Review. 1987;115(6):1083–1126. doi: 10.1175/1520-0493(1987)115〈1083:CSAPOL〉2.0.CO;2. - DOI
    1. Brewer S, Alleaume S, Guiot J, Nicault A. Historical droughts in Mediterranean regions during the last 500 years: a data/model approach. Climate of the Past. 2007;3(2):355–366. doi: 10.5194/cp-3-355-2007. - DOI
    1. Bueh C, Nakamura H. Scandinavian pattern and its climatic impact. Quarterly Journal of the Royal Meteorological Society. 2007;133(629):2117–2131. doi: 10.1002/qj.173. - DOI

LinkOut - more resources