. 2017 Oct 27;122(20):10888-10905.
doi: 10.1002/2017JD027523. Epub 2017 Oct 4.

The 2016 southeastern US drought: an extreme departure from centennial wetting and cooling

Affiliations

The 2016 southeastern US drought: an extreme departure from centennial wetting and cooling

A Park Williams et al. J Geophys Res Atmos. .

Abstract

The fall 2016 drought in the southeastern United States (SE US) appeared exceptional based on its widespread impacts, but the current monitoring framework that only extends from 1979-present does not readily facilitate evaluation of soil-moisture anomalies in a centennial context. A new method to extend monthly gridded soil-moisture estimates back to 1895 is developed, indicating that since 1895, October-November 2016 soil moisture (0-200 cm) in the SE US was likely the second lowest on record, behind 1954. This severe drought developed rapidly and was brought on by low September-November precipitation and record-high September-November daily maximum temperatures (Tmax). Record Tmax drove record-high atmospheric moisture demand, accounting for 28% of the October-November 2016 soil-moisture anomaly. Drought and heat in fall 2016 contrasted with 20th-century wetting and cooling in the region, but resembled conditions more common from 1895-1956. Dynamically, the exceptional drying in fall 2016 was driven by anomalous ridging over the central United States that reduced south-southwesterly moisture transports into the SE US by approximately 75%. These circulation anomalies were likely promoted by a moderate La Niña and warmth in the tropical Atlantic, but these processes accounted for very little of the SE US drying in fall 2016, implying a large role for internal atmospheric variability. The extended analysis back to 1895 indicates that SE US droughts as strong as the 2016 event are more likely than indicated from a shorter 60-year perspective, and continued multi-decadal swings in precipitation may combine with future warming to further enhance the likelihood of such events.


Figures

Figure 1
Figure 1
Satellite-derived annual forest-fire area in the SE US from 1984-2016 according to (red dots) the version 6 burned area product from the Moderate Resolution Infrared Spectrometer (MODIS; [Roy et al., 2008]) and (yellow dots) the record of large (≥202 ha) fires from the US Forest Service Monitoring Trends in Burn Severity product (MTBS; [Eidenshink et al., 2007]). MTBS records do not yet extend through 2016. Burned area is aggregated within 1/120° grid cells that are defined as having ≥75% forest cover according to the LANDFIRE Environmental Site Potential dataset (www.landfire.gov). The SE US region is outlined in the map inset, which also shows the US Drought Monitor (USDM) drought classifications on Nov 29, 2016, where white, yellow, beige, orange, red and dark red indicate no drought, abnormally dry moderate drought, severe drought, extreme drought, or exceptional drought, respectively.
Figure 2
Figure 2
Cross-validated (CV) correlation between 0-200 cm modeled soil moisture (SMNoah) anomalies and the model calibrated drought index (MCDI) during Oct-Nov for (a) the SE US region and (b) across the continental US. Dotted lines in (a) bound the 95% cross-validated confidence intervals for sample prediction. Correlation coefficients indicate the cross-validated Pearson’s correlation (rcv). Green polygon in (b) bounds the SE US study region. Blue areas indicate lakes and coastal regions within the continental US for which there are no SMNoah records. MCDI was calculated from NLDAS2 climate data.
Figure 3
Figure 3
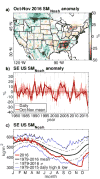
Noah modeled 0-200 cm soil moisture (SMNoah forced by NLDAS2 meteorology: 1979-2016. (a) Oct-Nov 2016 SMNoah anomalies relative to the 1979-2016 mean. Green polygon: Southeast US (SE US) study region. (b) Daily and Oct-Nov relative SMNoah anomalies. Vertical shaded lines indicate Oct-Nov periods and year ticks on the x-axis represent January 1. (c) Deviation of 2016 daily SMNoah (red) from the mean 1979-2016 annual cycle (thick black). Dashed black lines: one standard deviation (σ) from the mean. Blue lines: 1979-2015 record high and low values.
Figure 4
Figure 4
Observed Sep-Nov climate anomalies relative to 1921-2000 means. (Maps) 2016 anomalies. Green polygons: SE US study region. (Time series plots) Anomalies within the SE US. Note that (a) shows relative anomalies (% of mean) in the map and absolute anomalies in the time series. Red lines indicate significant Theil-Sen trends for 1895-2015.
Figure 5
Figure 5
SE US SMMCDI for January 1895 through June 2017. (a and b) relative anomalies and absolute values, respectively. (c) Mean Oct-Nov anomalies expressed as (left axis) absolute and (right axis) relative departures from the mean. Dark green line in (c) indicates 1895-2015 trend. Shading in (a-c) bounds cross-validated 95% confidence intervals, graduating from (darker) lower to (lighter) higher confidence. (d) Map of Oct-Nov 2016 relative SMMCDI anomalies. Anomalies are departures from the 1921-2000 mean. Green polygon in (d) bounds the SE US study region.
Figure 6
Figure 6
Maps of Oct-Nov drought ranking (based on SMMCDI) for the 9 driest Oct-Nov periods during 1895-2016. Lower values indicate more severe drought. Inset graph: Annual percentage of SE US experiencing lowest ranked SMMCDI among all Oct-Nov periods during 1895-2016.
Figure 7
Figure 7
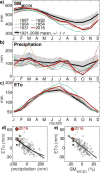
Comparison of 2016 climate to other drought years. Monthly SE US (a) SMMCDI, (b) precipitation, and (c) reference evapotranspiration (ETo) for 2016 and the other five years with similarly dry Oct-Nov SMMCDI. In (a-c): Black bold curves and shading: 1921-2000 monthly means plus and minus one standard deviation. (d and e) Scatter plots of annual Sep-Nov ETo versus (d) precipitation and (e) SMMCDI anomalies during the same period. Colors in (d and e) correspond to the legend in (a) and 2016 is represented by the large red dot. Black lines in (d and e) represent linear and exponential regression fits and values in these panels are anomalies with respect to the 1921-2000 means.
Figure 8
Figure 8
Effect of (blue) precipitation and (red) ETo anomalies on (bars) Oct-Nov SE US SMMCDI from 1895-2016. SMMCDI anomalies are departures from the 1921-2000 mean and displayed in (left-hand axis) absolute and (right-hand axis) relative units.
Figure 9
Figure 9
MERRA-2 Sep-Nov atmospheric circulation versus SE US drying. (a-c) Precipitation and (vectors) vertically integrated moisture transports. (d-f) 200 hPa geopotential height (Z) and (vectors) 200 hPa wind velocity. Maps show the (a and d) 1980-2016 mean climatology, (b and e) correlation with Sep-Nov soil drying during 1980-2015, and (c and f) the 2016 anomaly. In (b and c), precipitation anomalies are expressed as the standardized precipitation index (SPI). Green polygon bounds the SE US study region. Yellow polygon in (d-f) bounds the region where 200 hPa north-northeasterly winds correlate positively with SE US drying and negatively with south-southwesterly moisture transports into the SE US.
Figure 10
Figure 10
MERRA-2 global climate versus Sep-Nov drying in the SE US. (Left) Correlation between global climate and soil drying during 1980-2015. (Right) Standardized global climate anomalies in Sep-Nov 2016 relative to a 1980-2016 baseline. (Top row) 200 hPa (vectors) wind velocity and (background) geopotential height (Z). (Middle row) Precipitation, as represented by the standardized precipitation index (SPI). (Bottom row) Surface temperature (T).
Figure 11
Figure 11
ENSO, tropical North Atlantic SSTs, and their correlations with MERRA-2 global 200 hPa geopotential height (Z) in Sep-Nov 1980-2015. ENSO is represented by the first principal component of tropical Sep-Nov precipitation totals (ENSO P). North Atlantic SSTs are represented by the Tropical North Atlantic (TNA) index.
Figure 12
Figure 12
Impacts of ENSO and tropical North Atlantic SSTs on Sep-Nov surface climate across the continental US. Columns represent (left) standardized Precipitation Index (SPI) and MERRA-2 vertically integrated moisture transports, (middle) reference evapotranspiration (ETo), and soil drying. The top two rows indicate how each of these three variables correlated with the atmospheric component of ENSO (ENSO P) and the Tropical North Atlantic (TNA) index, respectively, in 1980-2015. The third row shows estimates of the three variables for 2016 based on a multiple-linear regression with ENSO P and TNA for 1980-2015 (combined effects of ENSO P and TNA are referred to as “combo.” In the figure). The bottom row shows the anomalies for the three variables in 2016 that were not accounted for by the multiple regression with ENSO P and TNA. Green polygon bounds the SE US study region.

References

    1. Adler RF, et al. The version-2 global precipitation climatology project (GPCP) monthly precipitation analysis (1979–present) Journal of hydrometeorology. 2003;4(6):1147–1167. doi: 10.1175/1525-7541(2003)004<1147:TVGPCP>2.0.CO;2. - DOI
    1. Ahillen S. Knoxville News Sentinel. Knoxville, TN: 2016. A month after historic fire, Gatlinburg rebuilds. December 28 2016 http://www.knoxnews.com/story/news/local/tennessee/2016/12/28/month-afte...
    1. Allen RG, Pereira LS, Raes D, Smith M. Crop evapotranspiration-Guidelines for computing crop water requirements-FAO Irrigation and drainage. Food and Agriculture Organizatoin of the United Nations; Rome: 1998. p. 15. paper 56. http://www.fao.org/docrep/x0490e/x0490e07.htm - radiation.
    1. Baidya Roy S, Hurtt GC, Weaver CP, Pacala SW. Impact of historical land cover change on the July climate of the United States. Journal of Geophysical Research: Atmospheres. 2003;108(D24) doi: 10.1029/2003JD003565. - DOI
    1. Berg A, Sheffield J, Milly PCD. Divergent surface and total soil moisture projections under global warming. Geophysical Research Letters. 2016;44(1):236–244. doi: 10.1002/2016GL071921. - DOI