. 2018 May 17;5(2):ENEURO.0387-17.2018.
doi: 10.1523/ENEURO.0387-17.2018. eCollection 2018 Mar-Apr.

Altered Cerebellar Short-Term Plasticity but No Change in Postsynaptic AMPA-Type Glutamate Receptors in a Mouse Model of Juvenile Batten Disease

Affiliations

Altered Cerebellar Short-Term Plasticity but No Change in Postsynaptic AMPA-Type Glutamate Receptors in a Mouse Model of Juvenile Batten Disease

Dorota Studniarczyk et al. eNeuro. .

Abstract

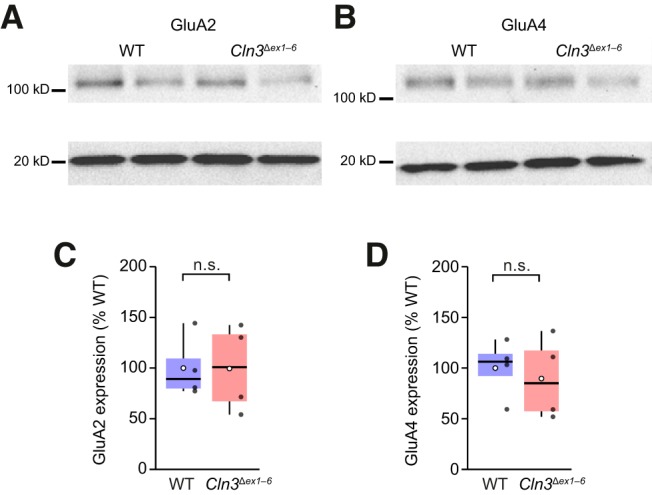
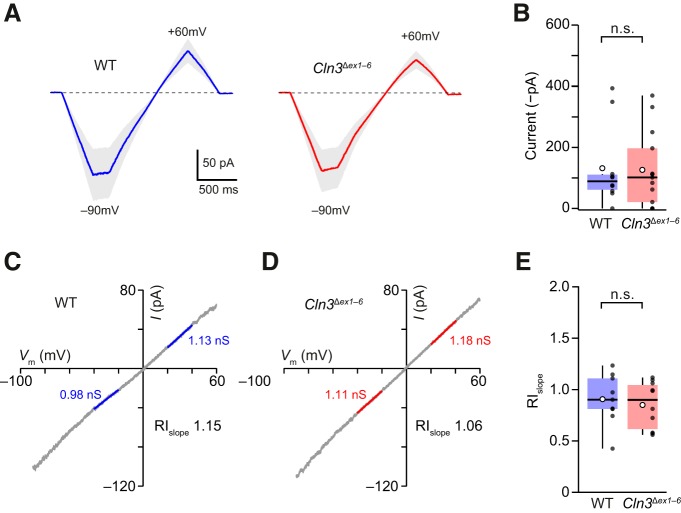
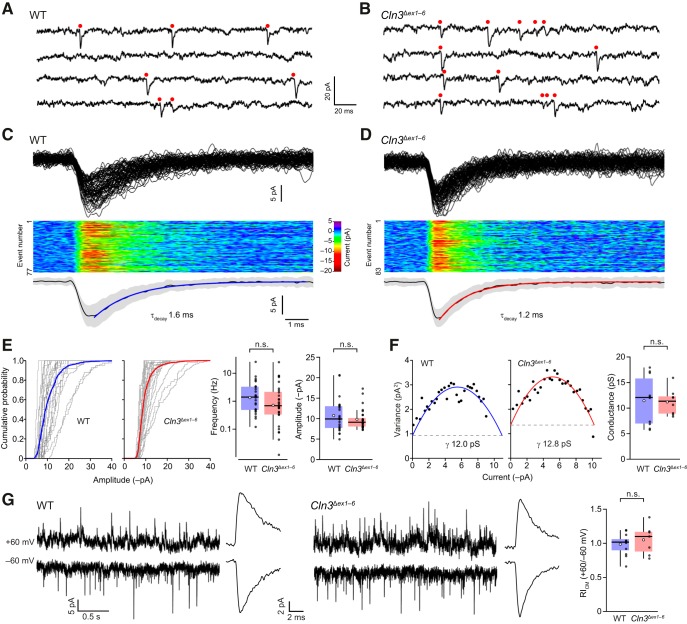
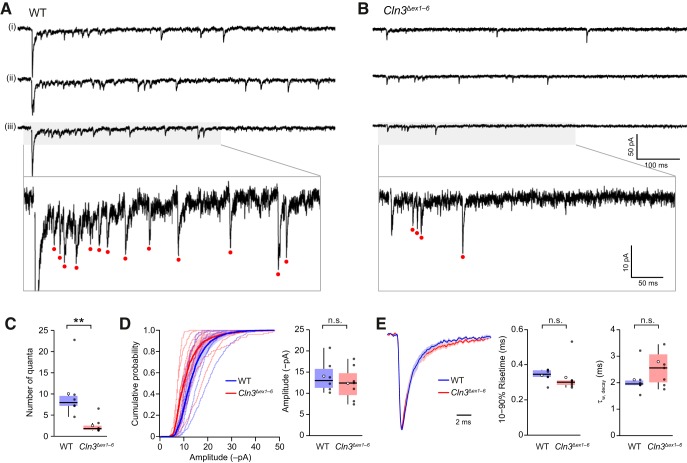
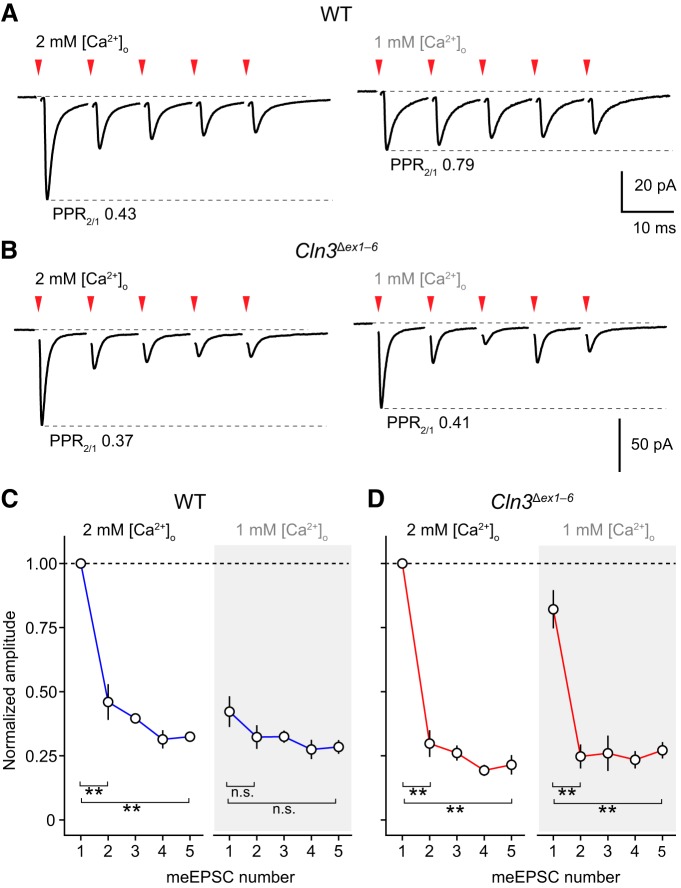
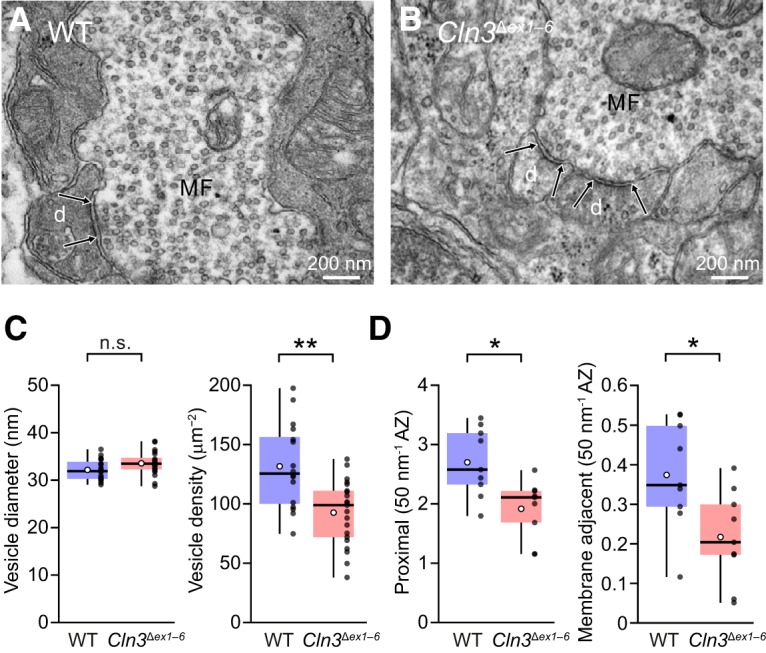
Juvenile Batten disease is the most common progressive neurodegenerative disorder of childhood. It is associated with mutations in the CLN3 gene, causing loss of function of CLN3 protein and degeneration of cerebellar and retinal neurons. It has been proposed that changes in granule cell AMPA-type glutamate receptors (AMPARs) contribute to the cerebellar dysfunction. In this study, we compared AMPAR properties and synaptic transmission in cerebellar granule cells from wild-type and Cln3 knock-out mice. In Cln3Δex1-6 cells, the amplitude of AMPA-evoked whole-cell currents was unchanged. Similarly, we found no change in the amplitude, kinetics, or rectification of synaptic currents evoked by individual quanta, or in their underlying single-channel conductance. We found no change in cerebellar expression of GluA2 or GluA4 protein. By contrast, we observed a reduced number of quantal events following mossy-fiber stimulation in Sr2+, altered short-term plasticity in conditions of reduced extracellular Ca2+, and reduced mossy fiber vesicle number. Thus, while our results suggest early presynaptic changes in the Cln3Δex1-6 mouse model of juvenile Batten disease, they reveal no evidence for altered postsynaptic AMPARs.

Keywords: AMPA receptors; Batten disease; CLN3; EPSCs; cerebellum; short-term plasticity.


Figures

Figure 1.
Figure 1.
GluA2 and GluA4 expression is unaltered in cerebellum of Cln3 Δex1–6 mice. A, Representative western blots comparing the expression of GluA2 in cerebellar lysates from wild-type (WT) and Cln3 Δex1–6 mice. Each lane uses pooled tissue from three littermate mice. Upper bands (near 100 kDa) show the labeling for GluA2. Lower bands (at 20 kDa) show the corresponding labeling for cofilin. B, Same as A but for GluA4. C, Pooled data for GluA2 expression normalized to mean WT expression. Box-and-whisker plots indicate the median value (black line), the 25–75th percentiles (box), and the 10–90th percentiles (whiskers); filled black circles are data from individual cells and open circles indicate means. D, Same as C but for GluA4 (n.s., non-significant; Wilcoxon rank sum test).
Figure 2.
Figure 2.
AMPA-evoked whole-cell currents from granule cells of Cln3 Δex1–6 mice are similar. A, Global average waveforms of leak-subtracted AMPA-evoked currents (in the presence of 10 μM cyclothiazide) from wild-type (WT) and Cln3 Δex1–6 mice (10 and 13 cells, respectively). Shaded areas denote SEM. B, Pooled data showing no change in amplitude (–90 mV) in cells from Cln3 Δex1–6 mice. C, Representative I-V relationship from a WT cell. Fitted blue lines (from –40 to –20 mV and from +20 to +40 mV) indicate the slope conductances (Gslope) for the negative and positive limbs of the I-V relationship. The rectification index (indicated) was calculated as RIslope = Gslope pos/Gslope neg. D, Same as C but for a representative granule cell from a Cln3 Δex1–6 mouse. E, Pooled data showing similar rectification in cells from WT and Cln3 Δex1–6 mice. Box-and-whisker plots as in Figure 1 (n.s., non-significant; Wilcoxon rank sum test).
Figure 3.
Figure 3.
mEPSCs in granule cells from wild-type (WT) and Cln3 Δex1–6 mice are indistinguishable. A, Representative recording of mEPSCs from a granule cell in a culture prepared from WT mice (–60 mV). Traces are consecutive and filtered at 1 kHz for display (mEPSCs are indicated by red dots). B, Same as A but from a granule cell in a culture prepared from Cln3 Δex1–6 mice. Scale bars apply to both A, B. C, upper, Individual mEPSCs from the cell in a, aligned at their point of steepest rise. Middle, Color-coded image of all 77 events. Lower, Averaged mEPSC (black trace) with superimposed SEM (gray fill) and exponential fit to the decay (blue line). The time constant (τdecay) is indicated. D, Same as C but for mEPSCs from the Cln3 Δex1–6 recording in B (scale bars apply to both C, D). E, Pooled data showing similar amplitude and frequency of mEPSCs in granule cells from WT and Cln3 Δex1–6 mice. Left, Cumulative probability distributions for mEPSC amplitudes. The averaged distributions are shown in bold (WT blue; Cln3 Δex1–6 red). Right, Box-and-whisker plots (as in Fig. 1) for mEPSC frequency (log10 scale) and amplitude (n.s., non-significant; Wilcoxon rank sum test). F, left, Representative current-variance relationships. The dashed line indicates the background current variance. The single-channel conductance (γ) was calculated from the weighted-mean unitary current estimated from the parabolic fit. Right, Box-and-whisker plots (as in E) showing similar values for conductance. G, Representative recordings from cultured granule cells at −60 and +60 mV with corresponding count-matched averaged mEPSCs (see Materials and Methods). Traces are from a WT cell (left) and a Cln3 Δex1–6 cell (right). Far right, Box-and-whisker plots (as in E) showing pooled data for count-matched rectification index (RICM).
Figure 4.
Figure 4.
Reduced number of mossy fiber-evoked quantal events in granule cells in acute cerebellar slices from Cln3 Δex1–6 mice. A, Representative mossy fiber-evoked responses recorded from a wild-type (WT) granule cell (–70 mV; 0 Ca2+/5 mM Sr2+). Three consecutive records are shown (i–iii). The region indicated in gray is enlarged in the lower panel to show the detected qEPSCs (red dots). B, Same as A but in a cell from a Cln3 Δex1–6 mouse (scale bars apply to both A, B). C, Box-and-whisker plots (as in Fig. 1) showing the reduced number of discrete quanta evoked in cells from Cln3 Δex1–6 mice (**p < 0.01; Wilcoxon rank sum test). D, Cumulative probability distributions for qEPSC amplitudes. Data from each cell are shown together with the averaged distributions in bold (WT, blue; Cln3 Δex1–6, red). Shaded areas denote SEM. Right, Box-and-whisker plots (as in C) showing unaltered qEPSC amplitude in cells from Cln3 Δex1–6 mice. E, Superimposed normalized global average qEPSC waveforms from six WT and seven Cln3 Δex1–6 cells show no differences. Shaded areas denote SEM. Right, Box-and-whisker plots (as in C) for qEPSC 10–90% risetime and τw, decay (n.s., non-significant; Wilcoxon rank sum test).
Figure 5.
Figure 5.
meEPSCs in granule cells in slices from wild-type (WT) and Cln3 Δex1–6 mice exhibit different patterns of short-term plasticity in low extracellular Ca2+. A, Averaged meEPSCs from a representative WT granule cell evoked during a five-pulse 100-Hz train in the presence of 2 and 1 mM extracellular Ca2+ (–70 mV; 428 and 110 sweeps, respectively). Red arrowheads indicate timing of stimuli (stimulus artifacts are blanked). PPRs (meEPSC2/meEPSC1) are indicated as PPR2/1. B, Same as A but for a representative Cln3 Δex1–6 granule cell (197 and 111 sweeps). C, Plots showing normalized meEPSC amplitude in WT granule cells during five-pulse trains in 2 and 1 mM Ca2+. Symbols denote mean and error bars SEM. D, Plots (as in C) but for Cln3 Δex1–6 granule cells (**p < 0.01 and n.s., non-significant; paired Wilcoxon rank sum test with Holm’s sequential Bonferroni correction for multiple comparisons).
Figure 6.
Figure 6.
Reduced vesicle density in mossy fiber terminals of Cln3 Δex1–6 mice. A, Representative electron micrograph showing a wild-type (WT) mossy fiber terminal (MF) making a synaptic contact (delineated by arrows) with a granule cell dendrite (d). B, Same as A but from a Cln3 Δex1–6 mouse. C, Box-and-whisker plots (as in Fig. 1) showing the unaltered vesicle diameter and the reduced vesicle density. D, Box-and-whisker plots (as in Fig. 1) showing the reduced number of vesicles proximal to active zones (AZ) and reduced number of membrane adjacent vesicles in MF terminals from Cln3 Δex1–6 mice (**p < 0.01, *p < 0.05; Wilcoxon rank sum test).

Similar articles

Cited by

References

    1. Abdul-Ghani MA, Valiante TA, Pennefather PS (1996) Sr2+ and quantal events at excitatory synapses between mouse hippocampal neurons in culture. J Physiol 495:113–125. 10.1113/jphysiol.1996.sp021578 - DOI - PMC - PubMed
    1. Amorim IS, Mitchell NL, Palmer DN, Sawiak SJ, Mason R, Wishart TM, Gillingwater TH (2015) Molecular neuropathology of the synapse in sheep with CLN5 Batten disease. Brain Behav 5:e00401. 10.1002/brb3.401 - DOI - PMC - PubMed
    1. Autti T, Raininko R, Vanhanen SL, Santavuori P (1996) MRI of neuronal ceroid lipofuscinosis. I. Cranial MRI of 30 patients with juvenile neuronal ceroid lipofuscinosis. Neuroradiology 38:476–482. - PubMed
    1. Bates D, Mächler M, Bolker BM, Walker SC (2015) Fitting linear mixed-effects models using lme4. J Stat Softw 67:1–48. 10.18637/jss.v067.i01 - DOI
    1. Borst JG (2010) The low synaptic release probability in vivo. Trends Neurosci 33:259–266. 10.1016/j.tins.2010.03.003 - DOI - PubMed

Publication types

MeSH terms