. 2018 May 17;5(2):ENEURO.0426-17.2018.
doi: 10.1523/ENEURO.0426-17.2018. eCollection 2018 Mar-Apr.

Circadian and Brain State Modulation of Network Hyperexcitability in Alzheimer's Disease

Affiliations

Circadian and Brain State Modulation of Network Hyperexcitability in Alzheimer's Disease

Rosalind Brown et al. eNeuro. .

Abstract

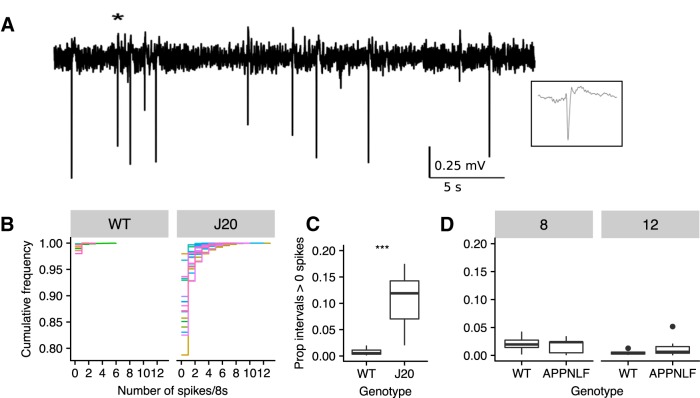
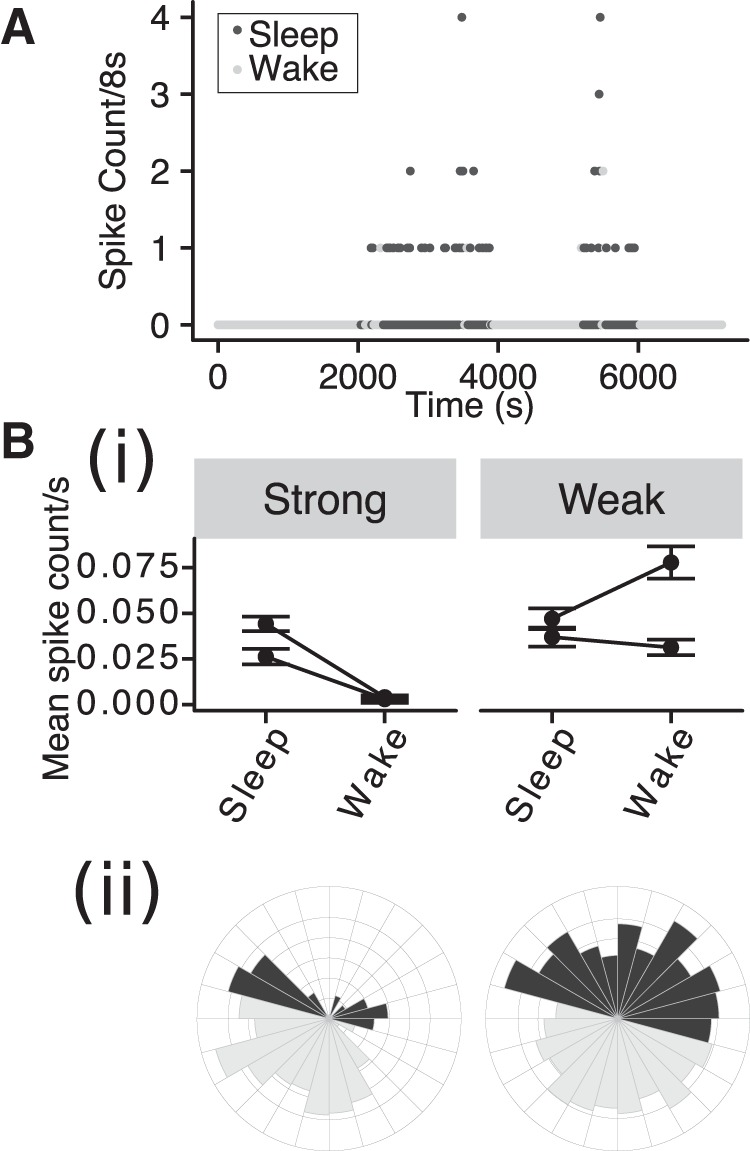
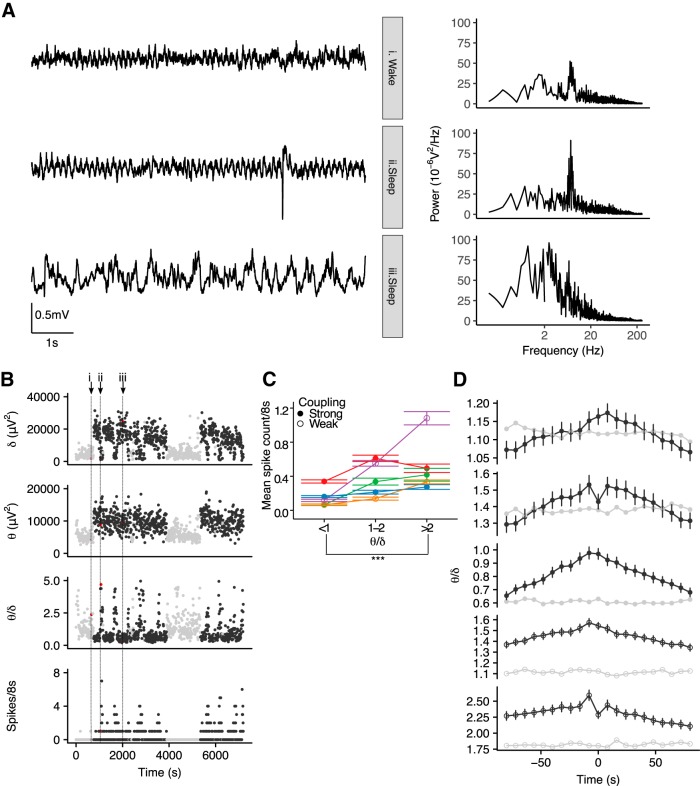
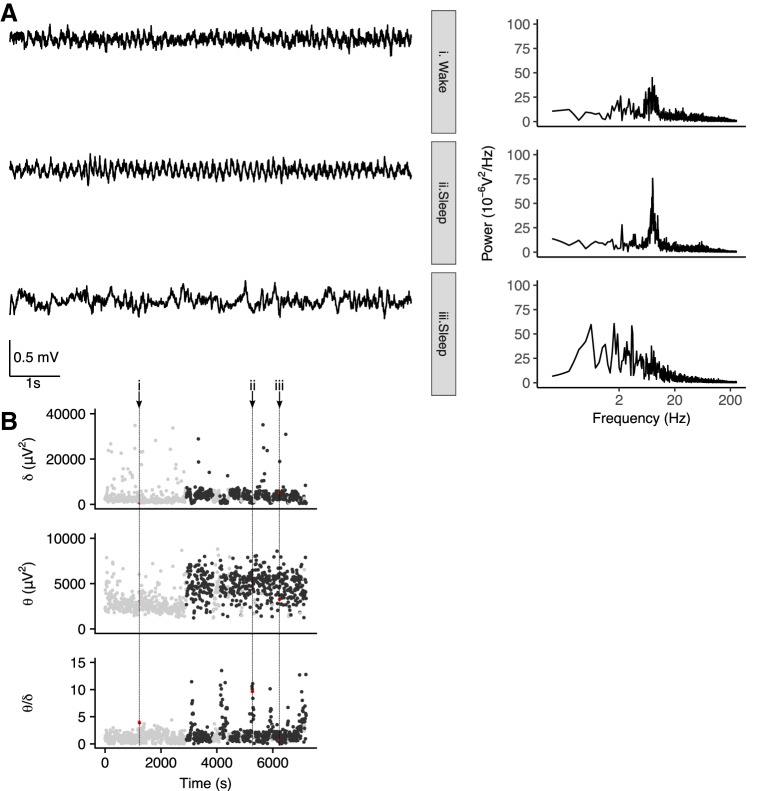
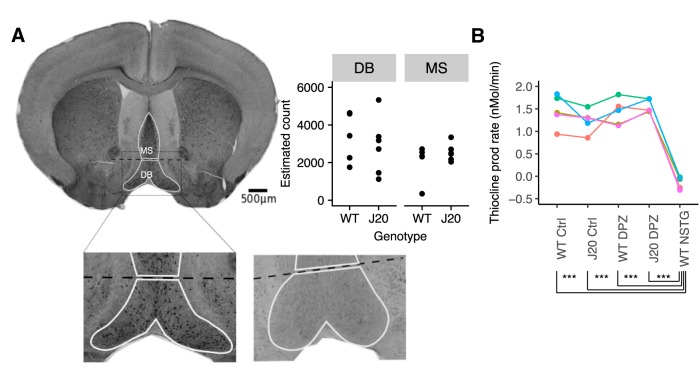
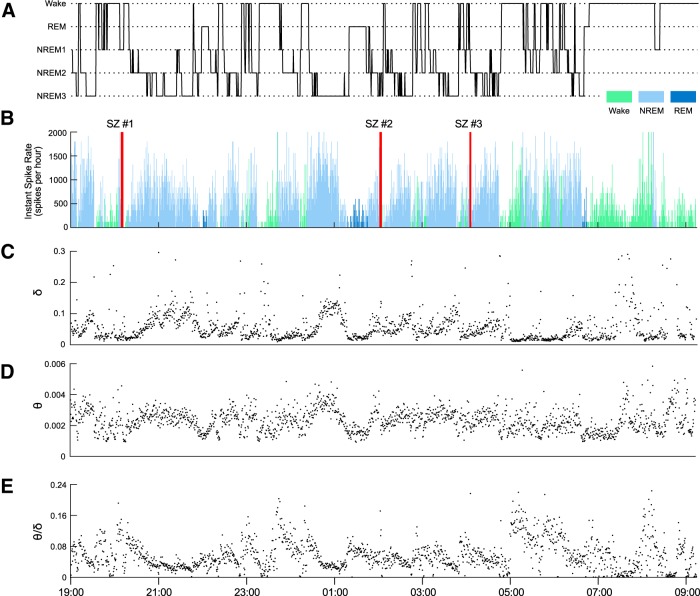
Network hyperexcitability is a feature of Alzheimer' disease (AD) as well as numerous transgenic mouse models of AD. While hyperexcitability in AD patients and AD animal models share certain features, the mechanistic overlap remains to be established. We aimed to identify features of network hyperexcitability in AD models that can be related to epileptiform activity signatures in AD patients. We studied network hyperexcitability in mice expressing amyloid precursor protein (APP) with mutations that cause familial AD, and compared a transgenic model that overexpresses human APP (hAPP) (J20), to a knock-in model expressing APP at physiological levels (APPNL/F). We recorded continuous long-term electrocorticogram (ECoG) activity from mice, and studied modulation by circadian cycle, behavioral, and brain state. We report that while J20s exhibit frequent interictal spikes (IISs), APPNL/F mice do not. In J20 mice, IISs were most prevalent during daylight hours and the circadian modulation was associated with sleep. Further analysis of brain state revealed that IIS in J20s are associated with features of rapid eye movement (REM) sleep. We found no evidence of cholinergic changes that may contribute to IIS-circadian coupling in J20s. In contrast to J20s, intracranial recordings capturing IIS in AD patients demonstrated frequent IIS in non-REM (NREM) sleep. The salient differences in sleep-stage coupling of IIS in APP overexpressing mice and AD patients suggests that different mechanisms may underlie network hyperexcitability in mice and humans. We posit that sleep-stage coupling of IIS should be an important consideration in identifying mouse AD models that most closely recapitulate network hyperexcitability in human AD.

Keywords: Alzheimer’s disease; circadian cycle; epilepsy.


Figures

Figure 1.
Figure 1.
IISs are prevalent in J20 mice but not in APP knock-in mice. A, ECoG trace recorded from a J20 mouse showing IIS. Inset is 250-ms expansion around IIS event marked by *. B, Empirical cumulative distribution frequency plots for individual animals quantifying the number of detected IIS in 8-s intervals across 3 d of recording in WT and J20s. Colors represent distributions for individual animals. C, Plot showing the proportion of intervals with one or more detected IIS in WT and J20. D, Plot showing the proportion of intervals with one or more detected IIS in WT and APPNL/F at eight and 12 months. Bars represent medians. Whiskers extend to 1.5 interquartile range and data points outside of this range shown as points; ***p < 0.001.
Figure 2.
Figure 2.
Circadian modulation of IIS. A, Circular histogram of IIS counts over 3 d of recording in an individual J20 mouse plotted on 24-h cycle. Light condition indicated by shading. For the animal shown, φIIS = 14 h 51 min and ρ = 0.35. B, Summary data for φIIS versus ρ for all animals, shown on circular plot. Solid symbols are strongly-coupled animals. Weakly coupled animals are shown with orange fill.
Figure 3.
Figure 3.
The probability of IIS is modulated by behavioral state in strongly phase-coupled animals. A, IIS count/8-s interval versus time over 2 h of ECoG recording in a J20 mouse, with sleep and wake indicated by shading. Bi, Mean spike rate in sleep and wake condition for strongly and weakly phase coupled animals. Error bars: 95% Confidence intervals (CI). Bii, Circular histograms for a strongly (left) and weakly (right) phase coupled animals using conventions as in Figure 2A.
Figure 4.
Figure 4.
IIS occur during high θ/δ states. A, 8-s ECoG signals (left) and corresponding power spectra (right) during different behavioral states recorded from a J20 mouse. A single IIS is seen in the sleep high θ state (ii). B, Time series of δ power, θ power, θ/δ, and spike count per 8-s intervals across 2 h of ECoG recorded from the same J20 mouse as shown in A. Black/gray symbols indicate sleep/wake as classified by simultaneous video data. Red symbols and vertical dotted lines indicate the 8-s intervals for which the ECoG signal is shown in A. C, Spike number per 8-s interval as a function of θ/δ in five animals (represented by different colors and connected by lines). The increase spike count in intervals with high θ/δ was seen in animals with both strong (filled symbols) and weak (open symbols) circadian phase coupling; ***p < 0.001. D, IIS-triggered averages of θ/δ for five individual animals (black) and windowed averages triggered around 2000 randomly sampled points (gray) show an increased θ/δ around IIS. Strong/weak coupling shown in filled/open symbols. Error bars in B, C represent 95% CI.
Figure 5.
Figure 5.
Transient increases in θ/δ are nonpathologic features of sleep. A, 8-s ECoG signals (left) and corresponding power spectra (right) during different behavioral states recorded from a WT mouse. B, Time series of δ power, θ power, and θ/δ per 8-s interval across 2 h of ECoG recorded from same WT mouse as shown in A. Black/gray symbols indicate sleep/wake as classified by simultaneous video data. Red symbols and vertical dotted lines indicate the 8-s intervals for which the ECoG signal is shown in A.
Figure 6.
Figure 6.
No evidence of cholinergic alterations in J20s. A, Immunostained brain section showing ChAT+ cells in MS and DB. Lower panel shows zoomed in region of upper panel (left) and corresponding regions of a negative control stained section (right). Upper right: Quantification of stereological estimates of ChAT+ cell count in MS and DB in WT and J20. Points represent estimated counts in individual animals. B, AChE activity was assayed by the rate of thiocholine production in brain homogenate from WT and J20 in control conditions and following oral administration of Donepezil (DPZ). The AChE activity was compared to a positive control of direct application of neostigmine (10 μM) to the brain homogenate. Experimental repeat groups are indicated by different colors and connected lines; ***p < 0.001.
Figure 7.
Figure 7.
Sleep stage coupling of mTL spiking in a human with aMCI, a suspected early stage of AD. A, Hypnogram showing the patient’s sleep architecture, spanning from ∼7 P.M. on FOD1 to 9:15 A.M. on FOD2. B, Bar plot showing instantaneous mTL lobe spike rates over the course of the recording. Bars are colored by sleep stage, with light green for Wake, light blue for NREM (includes NREM1, NREM2, and NREM3), and dark blue for REM. The patient had three brief subclinical seizures (SZ) from the left FO electrodes during this recording, the timing of which is depicted by red vertical bars. C–E, Plots showing (C) δ power (0–4 Hz), (D) θ power (4–12 Hz), and (E) θ/δ ratio of bilateral mTL activity, based on FO electrodes recordings. Dots represent the spectral power for each nonoverlapping 30-s window of the recording. Power is measured in arbitrary units.

References

    1. Agostinelli C, Lund U (2013) R package “circular”: circular statistics. Available at https://r-forge.r-project.org/projects/circular.
    1. Amatniek JC, Hauser WA, DelCastillo-Castaneda C, Jacobs DM, Marder K, Bell K, Albert M, Brandt J, Stern Y (2006) Incidence and predictors of seizures in patients with Alzheimer's disease. Epilepsia 47:867–872. 10.1111/j.1528-1167.2006.00554.x - DOI - PubMed
    1. Bakker A, Krauss GL, Albert MS, Speck CL, Jones LR, Stark CE, Yassa MA, Bassett SS, Shelton AL, Gallagher M (2012) Reduction of hippocampal hyperactivity improves cognition in amnestic mild cognitive impairment. Neuron 74:467–474. 10.1016/j.neuron.2012.03.023 - DOI - PMC - PubMed
    1. Bates D, Mächler M, Bolker B, Walker S (2015) Fitting linear mixed-effects models using lme4. J Stat Softw 67:1–48. 10.18637/jss.v067.i01 - DOI
    1. Bazil CW, Walczak TS (1997) Effects of sleep and sleep stage on epileptic and nonepileptic seizures. Epilepsia 38:56–62. - PubMed

Publication types

Substances