. 2018 May 21;16(5):e2003864.
doi: 10.1371/journal.pbio.2003864. eCollection 2018 May.

Endoplasmic reticulum-plasma membrane contact sites integrate sterol and phospholipid regulation

Affiliations

Endoplasmic reticulum-plasma membrane contact sites integrate sterol and phospholipid regulation

Evan Quon et al. PLoS Biol. .

Abstract

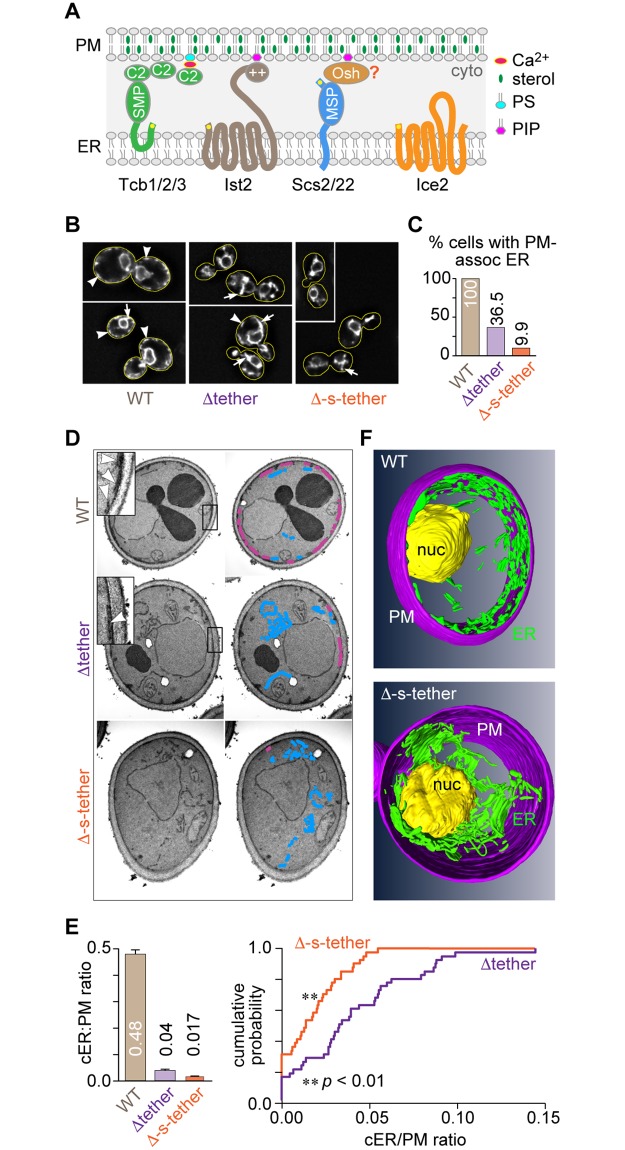
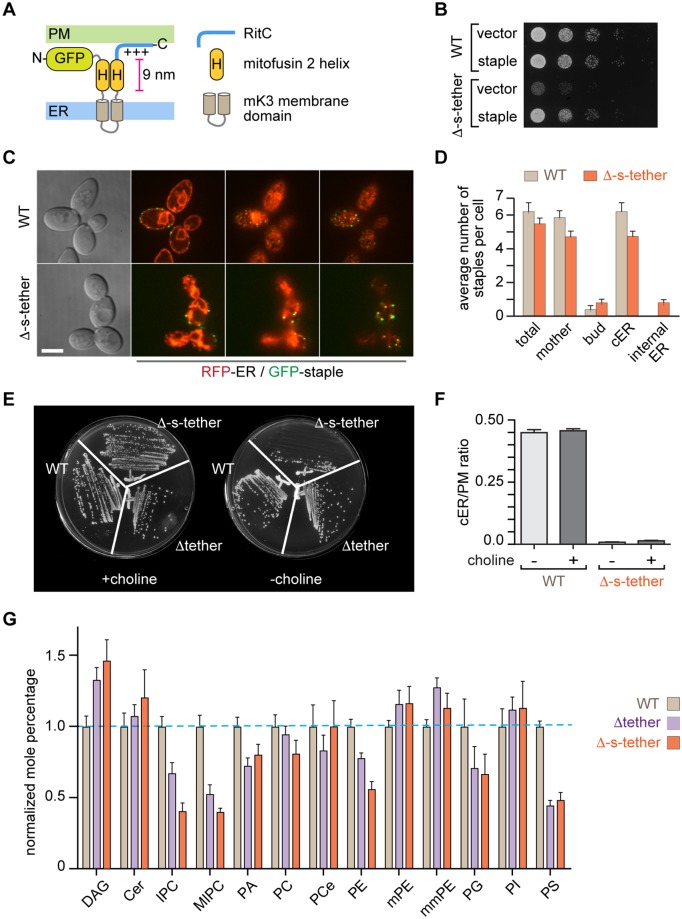
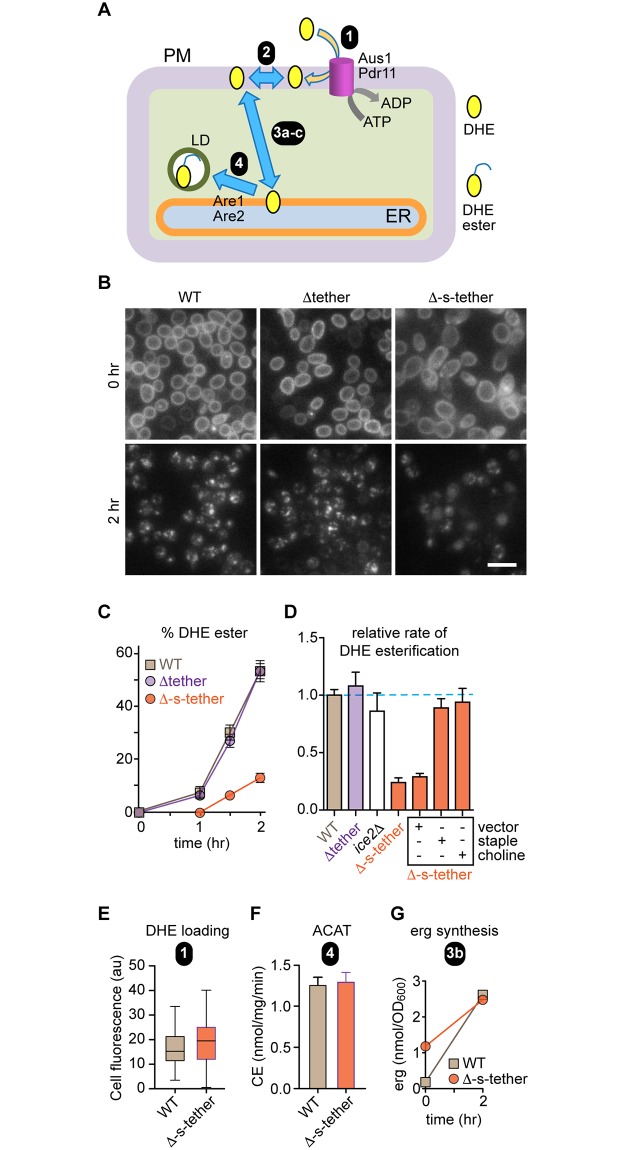
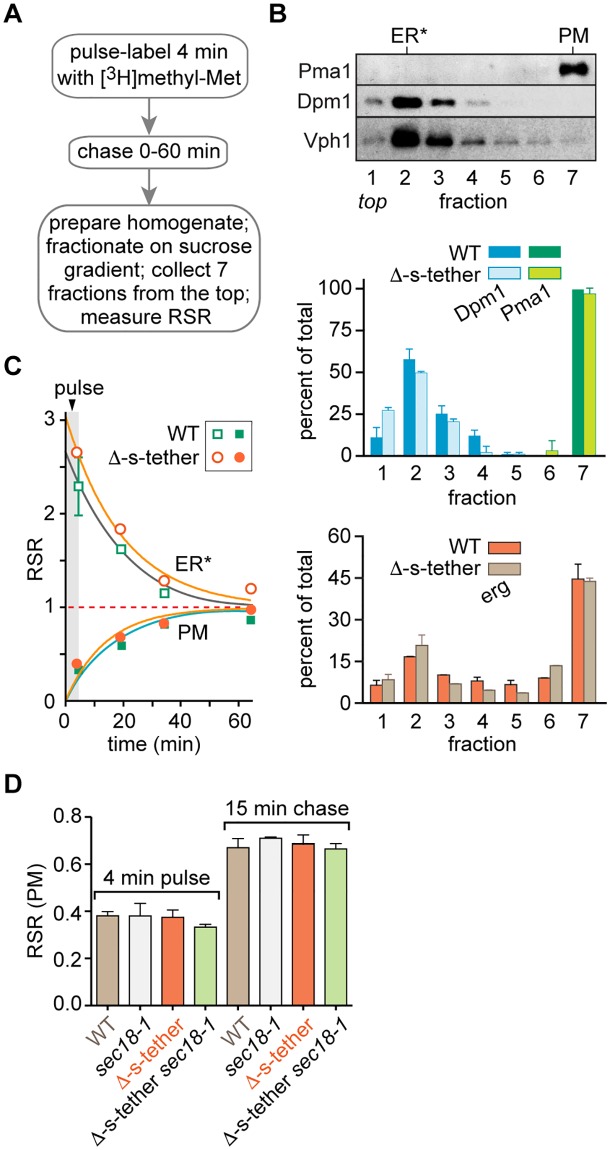
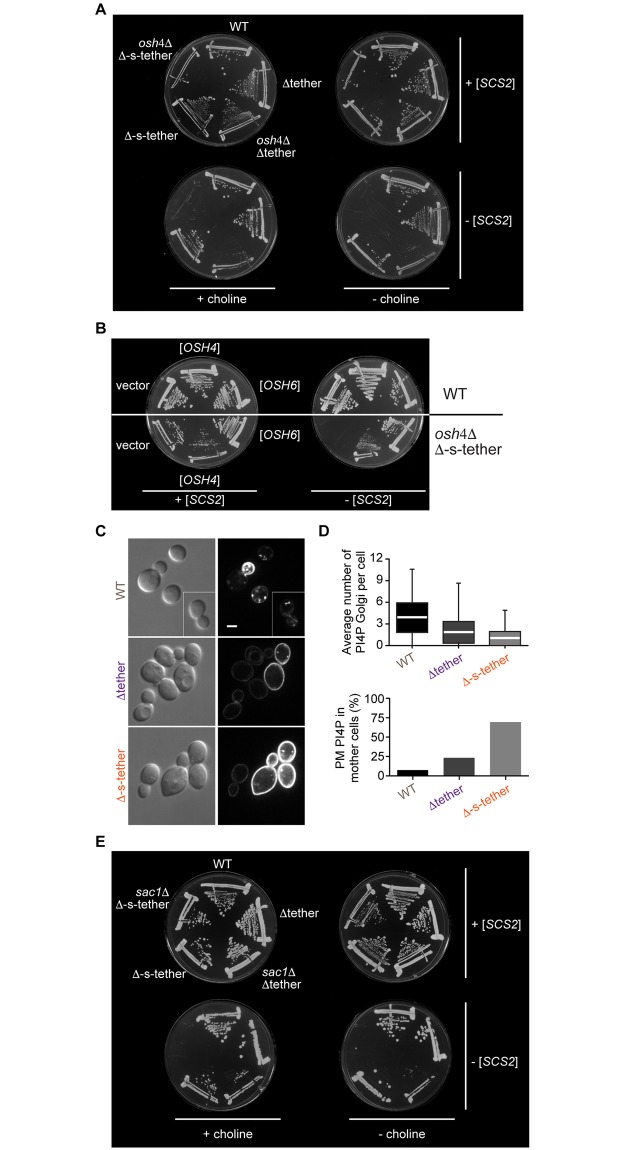
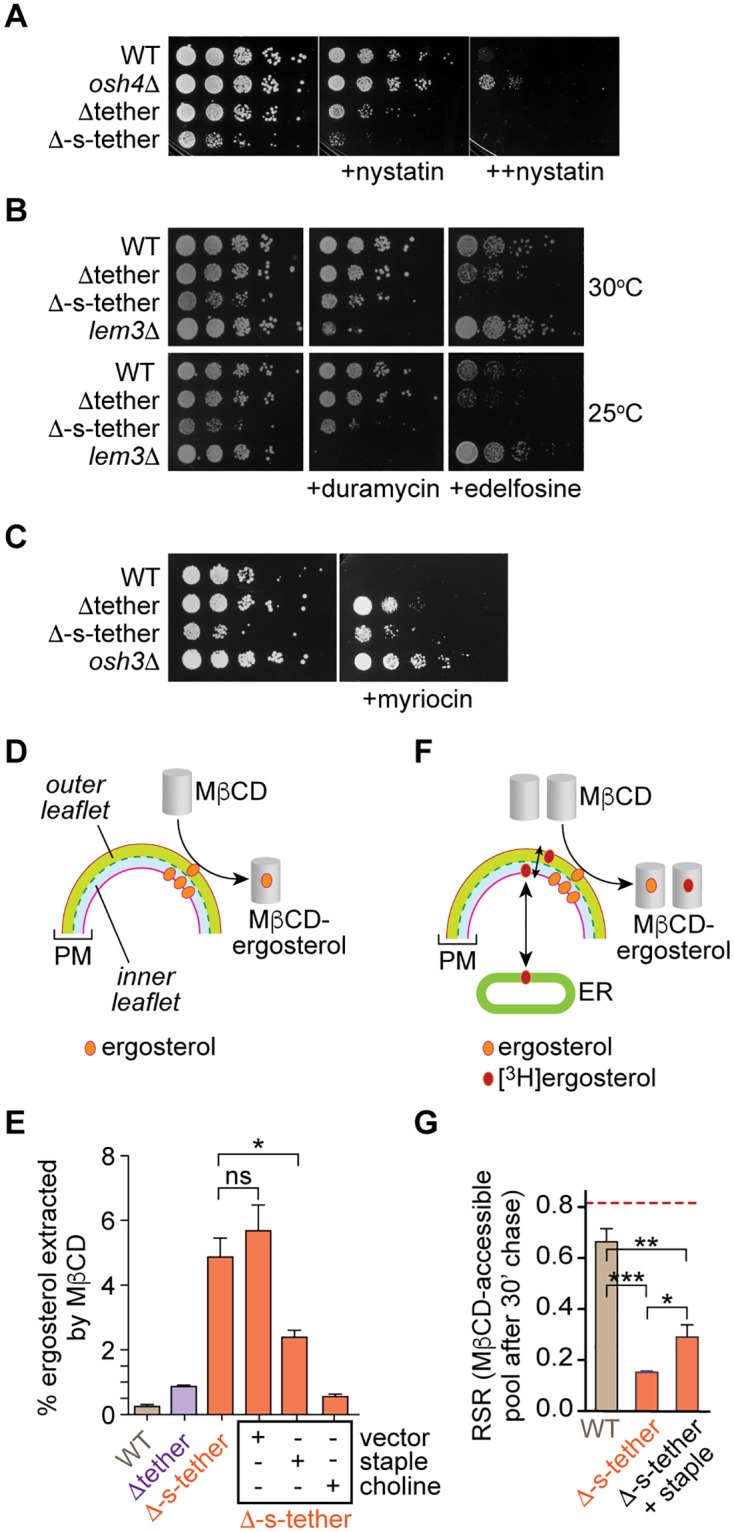
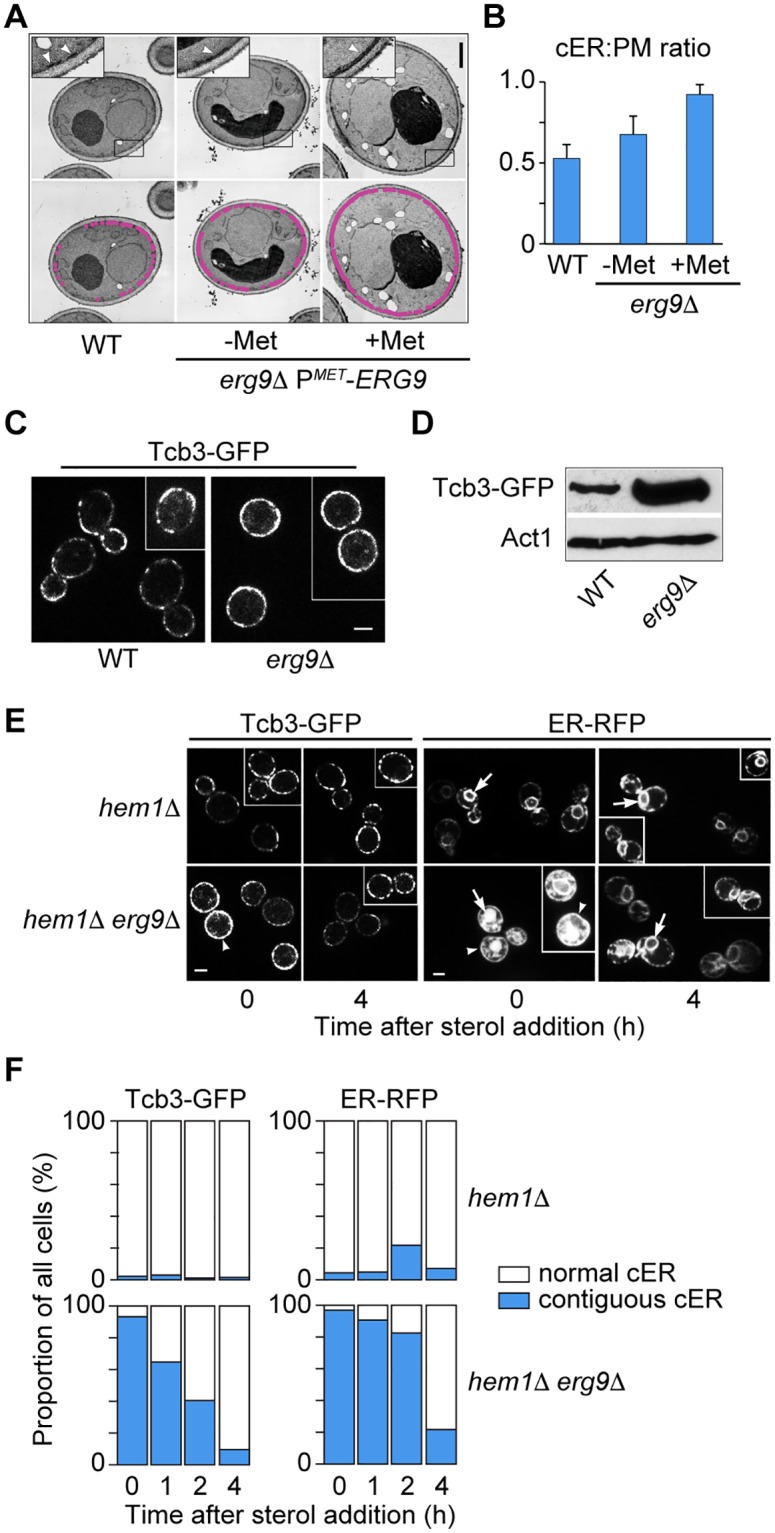
Tether proteins attach the endoplasmic reticulum (ER) to other cellular membranes, thereby creating contact sites that are proposed to form platforms for regulating lipid homeostasis and facilitating non-vesicular lipid exchange. Sterols are synthesized in the ER and transported by non-vesicular mechanisms to the plasma membrane (PM), where they represent almost half of all PM lipids and contribute critically to the barrier function of the PM. To determine whether contact sites are important for both sterol exchange between the ER and PM and intermembrane regulation of lipid metabolism, we generated Δ-super-tether (Δ-s-tether) yeast cells that lack six previously identified tethering proteins (yeast extended synatotagmin [E-Syt], vesicle-associated membrane protein [VAMP]-associated protein [VAP], and TMEM16-anoctamin homologues) as well as the presumptive tether Ice2. Despite the lack of ER-PM contacts in these cells, ER-PM sterol exchange is robust, indicating that the sterol transport machinery is either absent from or not uniquely located at contact sites. Unexpectedly, we found that the transport of exogenously supplied sterol to the ER occurs more slowly in Δ-s-tether cells than in wild-type (WT) cells. We pinpointed this defect to changes in sterol organization and transbilayer movement within the PM bilayer caused by phospholipid dysregulation, evinced by changes in the abundance and organization of PM lipids. Indeed, deletion of either OSH4, which encodes a sterol/phosphatidylinositol-4-phosphate (PI4P) exchange protein, or SAC1, which encodes a PI4P phosphatase, caused synthetic lethality in Δ-s-tether cells due to disruptions in redundant PI4P and phospholipid regulatory pathways. The growth defect of Δ-s-tether cells was rescued with an artificial "ER-PM staple," a tether assembled from unrelated non-yeast protein domains, indicating that endogenous tether proteins have nonspecific bridging functions. Finally, we discovered that sterols play a role in regulating ER-PM contact site formation. In sterol-depleted cells, levels of the yeast E-Syt tether Tcb3 were induced and ER-PM contact increased dramatically. These results support a model in which ER-PM contact sites provide a nexus for coordinating the complex interrelationship between sterols, sphingolipids, and phospholipids that maintain PM composition and integrity.


Conflict of interest statement

The authors have declared that no competing interests exist.

Figures

Fig 1
Fig 1. Quantitative disruption of ER-PM contacts in Δ-s-tether cells.
A. Proposed topology of ER membrane proteins involved in establishing ER-PM contact sites. The yellow dot indicates the N-terminus of the protein. Tcb1/2/3 associate with the PM through lipid-binding C2 domains and possess an SMP domain that is implicated in the exchange of phospholipids and diacylglycerol between the PM and ER [38]. Ist2 is a member of the TMEM16 family of ion channels and lipid scramblases. It interacts with the PM via its C-terminal PI(4,5)P2-binding polybasic region (++) [34]. The yeast VAPs Scs2/22 interact with the PM indirectly, likely through Osh proteins (or other proteins) that possess an FFAT motif capable of binding to the MSP domain of the VAPs [–43] and a PH domain that interacts with phosphoinositides at the PM. Ice2 facilitates cER inheritance from the mother cell along the PM into the bud [33, 44]; the ICE2 and SCS2 genes have a negative genetic interaction [31]. B. Representative images of WT (SEY6210), Δtether (ANDY198), and Δ-s-tether (CBY5838) cells expressing the ER marker RFP-ER (pCB1024). The PM-associated ER (arrowheads) at the cell cortex (outlined in yellow) observed in WT cells was largely absent in the Δtether and Δ-s-tether mutants, which exhibited prominent extranuclear cytoplasmic ER (arrows). Scale bar = 2 μm. C. Quantification of RFP-ER localization comparing the percentage of WT and mutant cells exhibiting cER-PM fluorescence (n > 140 cells). D. Electron micrographs of WT, Δtether, and Δ-s-tether cells. Inserts correspond to magnifications of boxed regions at the cell cortex, showing PM-associated ER (arrowheads). Cortical PM-associated ER (magenta) was reduced in Δtether cells and all but eliminated in Δ-s-tether cells. Extranuclear/cytoplasmic ER (blue) is prominent in the tether mutant cells. E. Left: quantification of cER expressed as a ratio of the length of PM-associated ER per circumference of PM in each cell (n = 41 cells; bars are mean ± SEM). Right: comparison of the cumulative distribution of cER/PM ratios for Δtether (purple) versus Δ-s-tether (red) shows a significant decrease in cER across the entire population of cells. ** p < 0.01 by Kolmogorov-Smirnov and Wilcoxon Rank Sum tests. See S1 Fig for further details. F. Models of the 3D organization of ER membranes within WT and Δ-s-tether cells constructed from sections imaged by focused-ion beam tomography: cER (green) in association with the PM (magenta); nuclear ER (yellow). Numerical data presented in this figure may be found in S1 Data. Δ-s-tether, Δ-super-tether; cER, cortical ER; C2, protein kinase C conserved region 2; ER, endoplasmic reticulum; FFAT; two phenylalanines in an acidic tract; MSP, major sperm protein; nuc, nucleus; Osh, OSBP homologue; PH, Pleckstrin homology; PIP, phosphatidylinositol phosphate; PM, plasma membrane; PS, phosphatidylserine; RFP, red fluorescent protein; SMP, synaptotagmin-like mitochondrial-lipid-binding protein; Tcb, tricalbin; VAMP, vesicle-associated membrane protein; VAP, VAMP-associated protein; WT, wild type.
Fig 2
Fig 2. Slow growth of Δ-s-tether cells is rescued by expression of an artificial ER-PM tether or choline.
A. The “ER-PM staple" has a modular architecture consisting of an N-terminal GFP, an ER anchor comprising two transmembrane domains and a lumenal loop from herpes virus (MVH68) mK3 E3 ubiquitin ligase, two helices from mitofusin 2 that are predicted to adopt an antiparallel arrangement about 9 nm long, and the polybasic domain from RitC that targets the PM. B. Tenfold serial dilutions of WT (SEY6210) and Δ-s-tether (CBY5838) cells, transformed with either the vector control (YCplac111) or a plasmid expressing the artificial staple (pCB1185), spotted on solid growth medium, and incubated for 2 d at 30 °C. C. DIC images of WT and Δ-s-tether cells and the corresponding spinning disc confocal fluorescence microscopy images showing the colocalization of RFP-ER (pCB1024) and the GFP-marked artificial staple (pCB1185) at three different optical focal planes. Scale bar = 5 μm. D. Quantification of the staple distribution within mother and buds and at cER versus internal cytoplasmic ER. E. Choline-dependent growth of Δ-s-tether cells. WT, Δtether (ANDY198), and Δ-s-tether (CBY5838) cells were streaked onto solid growth medium supplemented with 1 mM choline chloride, as indicated, and incubated for 3 d at 30 °C. F. Quantification of ER-RFP localization in WT and Δ-s-tether cells, with and without 1 mM choline, represented as a ratio of the length of PM-associated ER per circumference of PM in each cell (n > 50 cells; error bars represent SEM). G. Lipid composition of WT, Δtether, and Δ-s-tether cells represented as a normalized mole percentage relative to WT (set to 1.0). The data represent the mean ± SEM derived from the analysis of five independent samples. Numerical data presented in this figure may be found in S1 Data. Δ-s-tether, Δ-super-tether; cER, cortical ER; DAG, diacylglycerol; DIC, differential interference contrast; ER, endoplasmic reticulum; GFP, green fluorescent protein; IPC, inositol-phosphoceramide; MIPC, mannosylinositol phosphoceramide; mmPE, dimethyl PE; mPE, monomethyl PE; PA, phosphatidic acid; PC, phosphatidylcholine; PCe, ether phosphatidylcholine; PE, phosphatidylethanolamine; PG, phosphatidylglycerol; PI, phosphatidylinositol; PM, plasma membrane; PS, phosphatidylserine; RFP, red fluorescent protein, RitC; C-terminal polybasic region from mammalian Rit1; WT, wild type.
Fig 3
Fig 3. Retrograde transport of exogenously supplied DHE is slowed about 4-fold in Δ-s-tether cells; rescue by expression of an artificial ER-PM tether or choline.
A. Schematic illustration of the retrograde sterol transport assay. The assay measures transport-coupled esterification of exogenously supplied DHE. Cells are incubated with DHE for 36 h under hypoxic conditions to load the sterol into the PM (step 1, mediated by the ABC transporters Aus1 and Pdr11). Further incubation (chase period) after exposing the cells to air results in the exchange of DHE between pools in the PM (step 2) and its transfer to the ER (step 3), where it is esterified (step 4) by the sterol esterification enzymes Are1 and Are2. DHE esters that are sequestered in LDs. B. Representative images of WT, Δtether, and Δ-s-tether cells obtained immediately after DHE loading (chase time = 0 h) and 2 h after incubation under aerobic conditions. The punctae seen in the 2 h chase images correspond to LDs. Scale bar = 10 μm. C. DHE esters were quantified at different times during the aerobic chase period by analyzing hexane/isopropanol extracts of the cells by HPLC equipped with an in-line UV detector. The data are represented as percentage of DHE ester recovered (= DHE ester/(DHE + DHE ester)). Linear regression of the data points between 1 and 2 h indicates relative slopes of 1 (for WT and Δtether cells) and 0.24 ± 0.05 for Δ-s-tether cells (also see panel D). D. Transport-coupled esterification of exogenously supplied DHE. The bar chart presents the mean ± SEM (n = 3) of the relative rate of DHE esterification after the 1 h lag period at the start of the aerobic chase. The mean esterification rate for WT cells is set at 1.0. E. Incorporation of DHE into the PM (corresponding to step 1 in panel A), quantified using fluorescence images acquired immediately after the hypoxic incubation period. The area, integrated fluorescence, and the CTCF were calculated for individual cells using Image J. At least 40 cells were analyzed. CTCF = integrated density − (area of selected cell × mean fluorescence of background reading). The box and whiskers plot shows the mean of the measurements, with whiskers ranging from the minimum to the maximum value measured. F. Microsomes from WT and Δ-s-tether cells were assayed for their ability to esterify [3H]cholesterol (supplied as a complex with methyl-β-cyclodextrin) on addition of oleoyl-CoA. Esterification, assessed by organic solvent extraction and thin layer chromatography, proceeded linearly for at least 10 min. The bar chart shows the mean ± SEM (n = 4) of ACAT activity as the rate of production of CE per mg microsomal protein per minute. This measurement corresponds to step 4 in panel A. G. The amount of ergosterol in WT and Δ-s-tether cells (nmol per OD600 of cell suspension) was measured by lipid extraction and HPLC at the start and end of the aerobic chase period. This measurement corresponds to step 3a in panel A (see text for details). Numerical data presented in this figure may be found in S1 Data. Δ-s-tether, Δ-super-tether; ABC, ATP-binding cassette; ACAT, acetyl-CoA acetyltransferase; ADP, adenosine diphosphate; CE, cholesteryl ester; CoA, coenzyme A; CTCF, corrected total cell fluorescence; DHE, dehydroergosterol; ER, endoplasmic reticulum; HPLC, high-performance liquid chromatography; LD, lipid droplet; PM, plasma membrane; UV, ultraviolet; WT, wild type.
Fig 4
Fig 4. Bidirectional transport of ergosterol from the ER to the PM is unaffected in Δ-s-tether cells.
A. Outline of the transport assay. B. Characterization of subcellular fractions. Top, immunoblots using antibodies against Pma1 (PM), Dpm1 (ER), and Vph1 (vacuole). Fraction 2 is designated ER* to indicate that it contains membranes in addition to ER membranes. Data correspond to fractionation of a homogenate of WT cells prepared at the end of the labeling pulse. Middle, quantification of Dpm1 and Pma1 in fractions prepared from homogenates of WT and Δ-s-tether cells taken after a 30 min chase period. The blots were quantified by ImageJ. Bottom, quantification of ergosterol in the different fractions from the middle panel. C. WT and Δ-s-tether cells were processed as in panel A. The SR of ergosterol in each fraction ([3H]ergosterol [cpm] ÷ ergosterol mass) was normalized to the SR of the total homogenate at each time point to obtain an RSR. The figure shows RSR versus time (t = 0 min is the start of the labeling pulse). The lower portion of the graph (solid symbols) is based on 3–4 independent experiments; the upper portion (open symbols) is based on 2–5 independent experiments. The lines are mono-exponential fits of the data that plateau at RSR = 1. D. Transport of ergosterol in Δ-s-tether cells with block in vesicular transport. Mid-log cultures of WT, sec18-1ts (CBY2859), Δ-s-tether (CBY5838), and Δ-s-tether sec18-1ts (CBY5851) cells were grown at 24 °C, shifted to the restrictive temperature of 37 °C for 20 min, pulse-labeled with [3H]methyl-methionine for 4 min and chased for 15 min at the same temperature. The bar chart shows the RSR of the PM fraction from samples taken at the end of the pulse and chase periods. Data are mean ± SEM (n = 3). Numerical data presented in this figure may be found in S1 Data. Δ-s-tether, Δ-super-tether; cpm, counts per minute; ER, endoplasmic reticulum; PM, plasma membrane; RSR, relative specific radioactivity; SR, specific radioactivity; WT, wild type.
Fig 5
Fig 5. Functional interactions between ER-PM tethers and PI4P regulators.
A. OSH4 deletion in Δ-s-tether cells results in synthetic lethality. WT (SEY6210), Δtether (ANDY198), Δ-s-tether (CBY5838), osh4Δ Δtether (CBY5940), and osh4Δ Δ-s-tether cells (CBY5988) were transformed with an episomal copy of the SCS2 tether gene (+ [SCS2]; pCB1183) and streaked onto selective solid media with and without choline supplementation. The presence of the SCS2 gene provides an ER-PM tether that confers robust growth, even in the absence of all other tether genes. On growth medium selecting against the SCS2 plasmid (− [SCS2]), osh4Δ Δ-s-tether cells were inviable with or without choline. B. OSH6 expression suppresses the synthetic lethality of osh4Δ in Δ-s-tether cells. WT and osh4Δ Δ-s-tether cells containing an episomal copy of SCS2 were transformed with either the high-copy vector control (YEplac181), OSH4 (pCB598), or OSH6 (pCB1266) and streaked onto solid growth media. On a medium selecting against the SCS2 plasmid, OSH4 or OSH6 expression suppressed osh4Δ Δ-s-tether synthetic lethality, whereas vector control did not. C. Representative images of WT, Δtether, and Δ-s-tether cells by DIC with corresponding fluorescence microscopy showing the localization of the PI4P sensor GFP-2xPHOSH2 (pTL511). Scale bar = 2 μm. D. Bar graphs quantifying the number of GFP-2xPHOSH2 fluorescent Golgi spots (lower and upper boundaries of boxes correspond to data quartiles; the white bar indicates the median; lines represent the range of spots/cell) and the percentage of GFP-2xPHOSH2 fluorescent mothers detected in WT, Δtether, and Δ-s-tether cells. E. SAC1 deletion in Δ-s-tether cells results in a synthetic lethal interaction. WT, Δtether, sac1Δ Δtether (CBY6142), Δ-s-tether, and sac1Δ Δ-s-tether cells (CBY6146) were transformed with an episomal copy of SCS2 and streaked onto selective solid media with and without choline supplementation. On a medium that selects against the SCS2 plasmid, sac1Δ Δ-s-tether cells were inviable whether or not choline was added. Numerical data presented in this figure may be found in S1 Data. Δ-s-tether, Δ-super-tether; DIC, differential interference contrast; ER, endoplasmic reticulum; PI4P, phosphatidylinositol-4-phosphate; PM, plasma membrane; WT, wild type.
Fig 6
Fig 6. Alterations in ergosterol pools and dynamics at the PM in Δ-s-tether cells.
A. Sensitivity of Δ-s-tether cells to nystatin. Tenfold serial dilutions of WT (SEY6210), osh4Δ (HAB821), Δtether (ANDY198), and Δ-s-tether (CBY5838) cultures spotted onto solid rich medium containing no nystatin, 1.25 μM (+) nystatin, or 2.5 μM (++) nystatin and incubated for 3 d at 30 °C. B. Tenfold serial dilutions of WT, Δtether, and Δ-s-tether, lem3Δ (CBY5194) cultures were spotted onto solid rich media containing no drug, 5 μM duramycin, or 60 μM edelfosine and incubated for 2 d at 25 °C and 30 °C. The lem3Δ strain is known to be duramycin-sensitive and was used as a positive control. C. Tenfold serial dilutions of WT, Δtether, Δ-s-tether, and osh3Δ (JRY6202) cultures were spotted onto solid rich media containing no drug or 0.5 μg/mL myriocin and incubated for 2 d at 30 °C. The osh3Δ strain is known to be myriocin resistant and was used as a positive control. D. Assay to measure the proportion of cellular ergosterol that is extracted by MβCD. The PM of a yeast cell is shown, with outer (green) and inner (blue) leaflets delineated. Incubation of cells with MβCD on ice results in extraction of ergosterol from the outer leaflet. The sample is centrifuged to recover MβCD-ergosterol complexes in the supernatant. Ergosterol is extracted from the cell pellet and supernatant with hexane/isopropanol and quantified by HPLC (UV detection). E. The MβCD-accessible pool of ergosterol (quantified as in panel D) is about 20-fold greater in Δ-s-tether cells versus WT cells, and partially restored to WT levels in cells expressing the “ER-PM staple.” The statistical significance of the difference between the measurement of WT cells and each of the different Δ-s-tether samples is p < 0.0001, and between the Δ-s-tether samples is p = 0.0205 (*) and 0.436 (ns). F. Assay to measure transport of newly synthesized ergosterol from the ER to the MβCD-accessible pool. Cells are pulse-labeled with [3H]methyl-methionine to generate [3H]ergosterol in the ER, and chased as described in Fig 3. After a 30 min chase period, energy poisons are added and cells are placed on ice and incubated with MβCD. The ratio of the specific radioactivity of ergosterol in MβCD-ergosterol complexes versus that of the cell homogenate (RSR) provides a measure of transport. G. Transport of newly synthesized ergosterol from the ER to the MβCD-accessible pool. The bar chart shows RSR values for the different samples. The dotted line indicates the average RSR (about 0.82, averaged over both WT and Δ-s-tether samples) after 30 min of chase for the PM fraction, as described in Fig 3. The statistical significance was determined by one-way ANOVA (***p = 0.0003, **p = 0.0027, *p = 0.043). Numerical data presented in this figure may be found in S1 Data. Δ-s-tether, Δ-super-tether; ER, endoplasmic reticulum; HPLC, high-performance liquid chromatography; MβCD, methyl-β-cyclodextrin; ns, not significant; PM, plasma membrane; RSR, relative specific radioactivity; UV, ultraviolet; WT, wild type.
Fig 7
Fig 7. Sterol depletion induces both ER-PM MCS formation and Tcb3 tether expression.
A. Electron micrographs of WT (CBY858) and erg9Δ PMET3-ERG9 (CBY745) cells before (− Met) and after (+ Met) methionine repression of PMET3-ERG9 synthesis of sterols (methionine was also added to WT). Inserts correspond to magnifications of boxed regions at the cell cortex showing PM-associated ER (arrowheads); cER is highlighted in magenta. Scale bar = 2 μm. B. Corresponding to panel A, quantification of cER length expressed as a percentage of the total circumference of the PM in each cell section counted (n = 25 cells for each strain; error bars show SD; p = 7.6 × 10⁻²⁵ for the difference between WT and erg9Δ PMET3-ERG9 (+ Met)). C. WT (CBY5836) and erg9Δ (CBY5834) cells with integrated TCB3-GFP and PMET3-ERG9 constructs in the presence of methionine, which represses ERG9 expression and sterol synthesis in erg9Δ cells. Scale bar = 2 μm. D. Corresponding to panel C, representative immunoblots probed with anti-GFP and anti-actin antibodies showing Tcb3-GFP levels in WT and sterol-depleted erg9Δ PMET3-ERG9 cells, as compared to the actin (Act1) control. Relative to WT, Tcb3-GFP levels increased 5.6 ± 1.6 (mean ± SD; n = 5)-fold in sterol-depleted erg9Δ PMET3-ERG9. E. Continuous Tcb3-GFP and ER-RFP fluorescence along the PM (arrowheads) dissipated with the addition of exogenous cholesterol to sterol-depleted hem1Δ erg9Δ PMET3-ERG9 cells (CBY5995 and CBY5842 pCB1024, respectively). Intense ER-RFP nuclear fluorescence (arrows) also diminished after cholesterol addition. The normal discontinuous dashed line of Tcb3-GFP and ER-RFP around the cell cortex was unaffected in sterol-prototrophic hem1Δ cells (CBY5993 and CBY5844 pCB1024, respectively); scale bar = 2 μm. F. Quantification of contiguous association between cER and the PM after cholesterol addition in hem1Δ, TCB3-GFP hem1Δ cells, and sterol-depleted hem1Δ erg9Δ PMET3-ERG9 cells and TCB3-GFP hem1Δ erg9Δ PMET3-ERG9 cells. Following cholesterol addition to sterol-depleted hem1Δ erg9Δ PMET3-ERG9 cells, reductions in cortical Tcb3-GFP localization were detected 1 h after cholesterol addition, with reductions in cER-RFP lagging slightly behind (n > 100). Numerical data presented in this figure may be found in S1 Data. cER, cortical ER; ER, endoplasmic reticulum; ERG9, squalene synthase; GFP, green fluorescent protein; MCS, membrane contact site; PM, plasma membrane; RFP, red fluorescent protein; Tcb, tricalbin; WT, wild type.

References

    1. Holthuis JC, Levine TP. Lipid traffic: floppy drives and a superhighway. Nat Rev Mol Cell Biol. 2005;6(3):209–20. Epub 2005/03/02. doi: 10.1038/nrm1591 . - DOI - PubMed
    1. Lev S. Non-vesicular lipid transport by lipid-transfer proteins and beyond. Nat Rev Mol Cell Biol. 2010;11(10):739–50. Epub 2010/09/09. doi: 10.1038/nrm2971 . - DOI - PubMed
    1. Holthuis JC, Menon AK. Lipid landscapes and pipelines in membrane homeostasis. Nature. 2014;510(7503):48–57. Epub 2014/06/06. doi: 10.1038/nature13474 . - DOI - PubMed
    1. Pichler H, Gaigg B, Hrastnik C, Achleitner G, Kohlwein SD, Zellnig G, et al. A subfraction of the yeast endoplasmic reticulum associates with the plasma membrane and has a high capacity to synthesize lipids. Eur J Biochem. 2001;268(8):2351–61. . - PubMed
    1. Manford AG, Stefan CJ, Yuan HL, Macgurn JA, Emr SD. ER-to-plasma membrane tethering proteins regulate cell signaling and ER morphology. Dev Cell. 2012;23(6):1129–40. Epub 2012/12/15. - PubMed

Publication types

MeSH terms

LinkOut - more resources