. 2018 May 19;19(5):1521.
doi: 10.3390/ijms19051521.

Cell Propagation of Cholera Toxin CTA ADP-Ribosylating Factor by Exosome Mediated Transfer

Affiliations

Cell Propagation of Cholera Toxin CTA ADP-Ribosylating Factor by Exosome Mediated Transfer

Cristiana Zanetti et al. Int J Mol Sci. .

Abstract

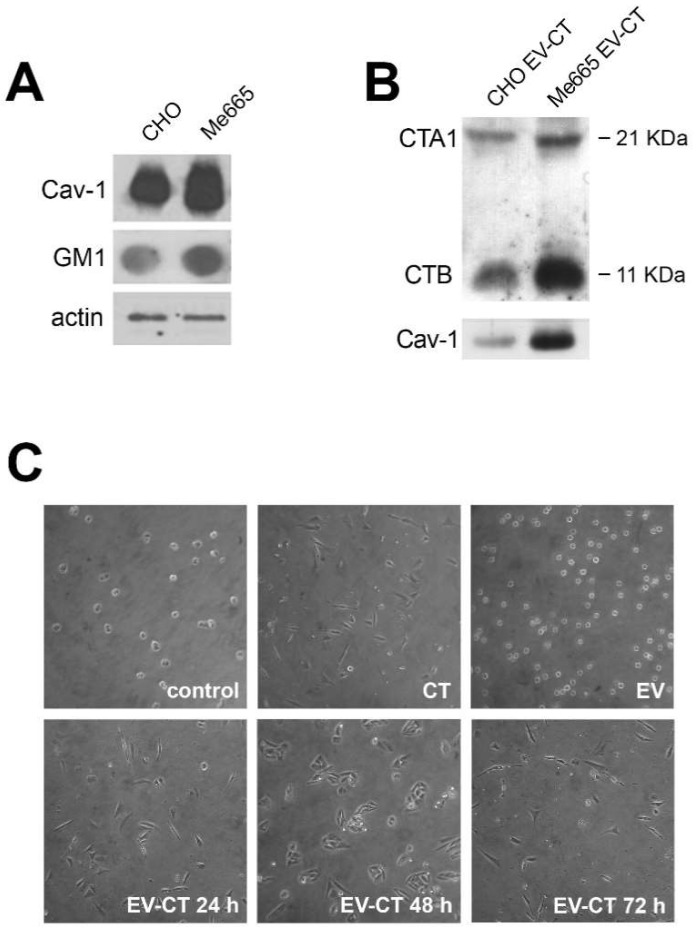
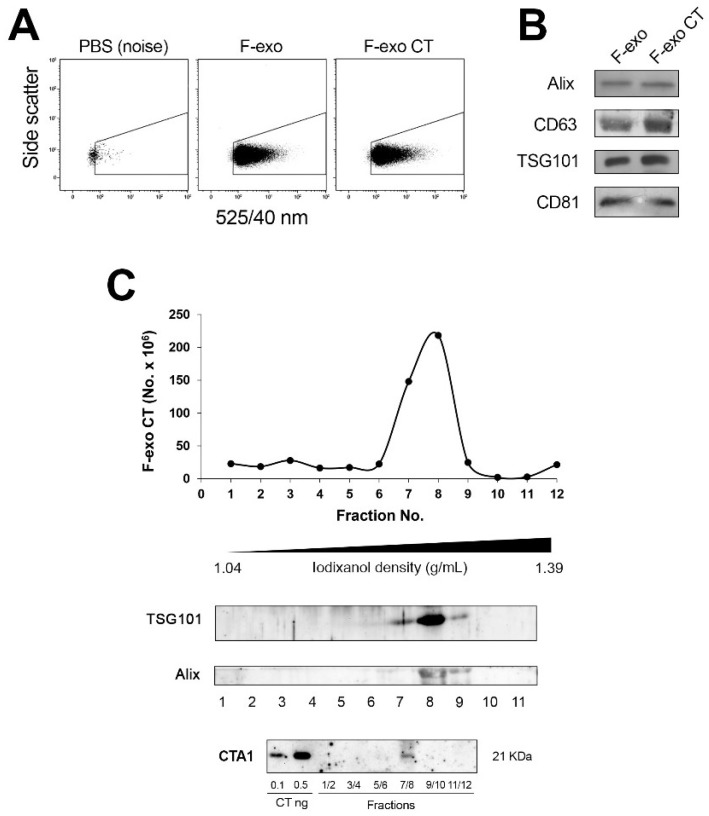
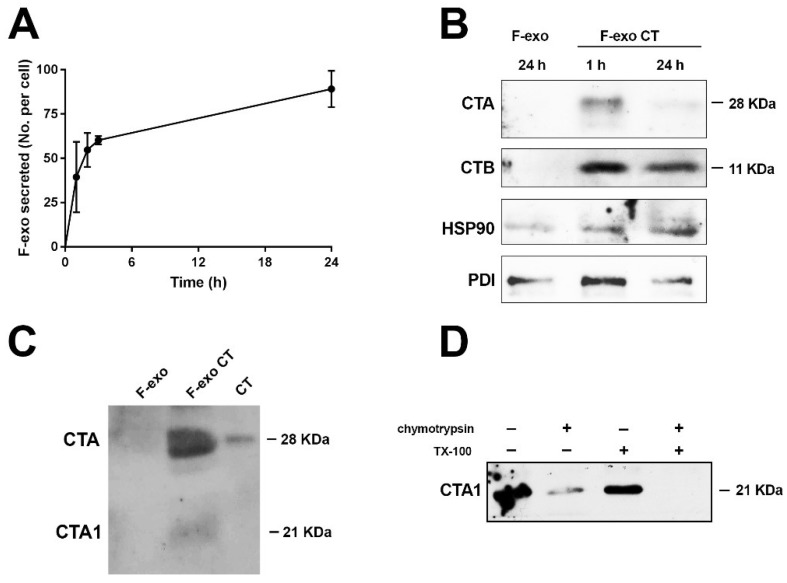
In this study, we report how the cholera toxin (CT) A subunit (CTA), the enzyme moiety responsible for signaling alteration in host cells, enters the exosomal pathway, secretes extracellularly, transmits itself to a cell population. The first evidence for long-term transmission of CT's toxic effect via extracellular vesicles was obtained in Chinese hamster ovary (CHO) cells. To follow the CT intracellular route towards exosome secretion, we used a novel strategy for generating metabolically-labeled fluorescent exosomes that can be counted by flow cytometry assay (FACS) and characterized. Our results clearly show the association of CT with exosomes, together with the heat shock protein 90 (HSP90) and Protein Disulfide Isomerase (PDI) molecules, proteins required for translocation of CTA across the ER membrane into the cytoplasm. Confocal microscopy showed direct internalization of CT containing fluorescent exo into CHO cells coupled with morphological changes in the recipient cells that are characteristic of CT action. Moreover, Me665 cells treated with CT-containing exosomes showed an increase in Adenosine 3',5'-Cyclic Monophosphate (cAMP) level, reaching levels comparable to those seen in cells exposed directly to CT. Our results prompt the idea that CT can exploit an exosome-mediated cell communication pathway to extend its pathophysiological action beyond an initial host cell, into a multitude of cells. This finding could have implications for cholera disease pathogenesis and epidemiology.

Keywords: Caveolin-1; cholera toxin; endocytic pathway; exosomes; monosialganglioside GM1.


Conflict of interest statement

The authors declare no conflict of interest.

Figures

Figure 1
Figure 1
Expression of Cav-1 and GM1 in CHO and Me665 cells and morphological changes in CHO cells induced by CT-positive EVs (EV-CT) (A) Western blot analysis for Cav-1 and Dot blot analysis for GM1 of CHO and Me665 cell lines. For SDS-PAGE 30 µg of cell lysates were used and for Dot Blot 40 µg/dot. The presence of GM1 was assessed using horseradish peroxidase (HRP)-conjugated CTB. Actin is shown for normalization; (B) EVs collected from supernatants of CHO and Me665 cells treated with CT were run on a SDS-PAGE gel in reducing conditions Western blot analysis with a polyclonal antibody for Cav-1 and CT is shown; (C) Optical light microscope (Nikon, magnification ×10) analysis of CHO cells upon addition of extracellular vesicles from control or CT treated CHO cells. EV were collected at different times from cell-conditioned medium, and isolated by differential ultracentrifugation. After isolation, 5 µg of EV were incubated for 6 h with CHO cells. 12 nM CT is used as positive control. At the end of the incubation, cells were analyzed with a light microscope.
Figure 2
Figure 2
Characterization and distribution of F-exo CT purified from Me665 cells on an iodixanol gradient. (A) FACS analysis of F-exo and F-exo CT deriving from Me665 cells incubated with or without 12 nM CT. To design the F-exo region above instrument background noise only phosphate buffered saline (PBS) was acquired. Note that no events were registered in this region; (B) Western blot analysis of F-exo and F-exo CT probed with antibodies against exosome markers Alix, Tumor Susceptibility Gene (TSG)101, CD63 and CD81; (C) The F-exo CT sample was loaded at the bottom of an iodixanol discontinuous density gradient and subjected to ultracentrifugation for 18 h. The resulting fractions (1–12) with increasing density were analyzed for vesicles number by FACS and for the presence of exosome markers TSG101 and ALIX by Western blotting. The fluorescent peak displays a density ranging from 1.085 to 1.142. Fractions 1–2, 3–4, 5–6, 7–8, 9–10, 11–12 were pooled, trichloroacetic acid (TCA) precipitated and analyzed by western blot after running a Sodium dodecyl sulfate polyacrylamide gel electrophoresis (SDS-PAGE) in reducing condition for the presence of CTA subunit. For Western blot, an equal volume of each sample was analyzed.
Figure 3
Figure 3
Intracellular distribution of CT in Me665 cells labeled with BODIPY C16. (A) Confocal microscopy analysis of Me665cells metabolically labeled with BODIPY C16, treated with 12 nM CT for 20 min on ice, and then incubated with CT-free medium for 24 h at 37 °C. Images were taken at T0 and T24 h after the removal of CT. BODIPY C16 is represented in green and CT in red; (B) Cells, immunolabeled for BMP or TSG101 (green) and for CT (red) show colocalization of both with CT, as evidenced in insets. Bar represents 20 µm. For all images DAPI staining was used for nuclear localization.
Figure 3
Figure 3
Intracellular distribution of CT in Me665 cells labeled with BODIPY C16. (A) Confocal microscopy analysis of Me665cells metabolically labeled with BODIPY C16, treated with 12 nM CT for 20 min on ice, and then incubated with CT-free medium for 24 h at 37 °C. Images were taken at T0 and T24 h after the removal of CT. BODIPY C16 is represented in green and CT in red; (B) Cells, immunolabeled for BMP or TSG101 (green) and for CT (red) show colocalization of both with CT, as evidenced in insets. Bar represents 20 µm. For all images DAPI staining was used for nuclear localization.
Figure 4
Figure 4
Exosome biogenesis and analysis of intra/extra localization of CT. (A) Me665 exosome biogenesis. Cells were pulsed with BODIPY C16 for 5 h for cell labeling, washed and complete medium was added. Cell conditioned medium was harvested at different time points for exosome recovery and quantification by FACS. Amount of exo secreted per cell is shown; (B) Western Blot analysis of F-exo CT recovered at 1 h and 24 h subtracted of the 1 h time point. The same number (3 × 10⁷) of F-exo or F-exo CT were run on a non reducing SDS-PAGE gel, and immunoblotted for CTA and CTB subunits, HSP90 and PDI; (C) Western blot analysis of F-exo and F-exo CT (6 × 10⁷) run in non-reducing conditions to show the presence of CTA1 and CTA1 + CTA2 subunits. The monoclonal antibody anti-CTA reveal the presence of both the 28 kDa and the 21 kDa subunits. 0.3 ng of CT were used as positive control; (D) 16 µg of exo CT were incubated with 1 µg of chymotrypsin, in the absence or presence of 0.2% Triton X-100. Samples were then loaded on SDS-PAGE gel in reducing conditions before western blot analysis using a monoclonal antibody anti-CTA.
Figure 5
Figure 5
F-exo transfer to cells induces increase of cellular cAMP. (A) Confocal fluorescence microscopy images of F-exo and F-exo CT transfer on CHO and Me665 cells. 2 × 10⁸ fluorescent exosomes were incubated with 4 × 10⁴ CHO and Me665 cells for 4 h at 37 °C. Cells were then fixed and analysed; Scale bars represent 20 µm; (B) FACS analysis of F-exo and F-exo CT transfer on target cells. 4 × 10⁴ cells were incubated with 1.5 × 10⁷ F-exo or F-exo CT for 4 h at 37 °C. At the end of the incubation cells were FACS analysed. The increase in cell fluorescence demonstrate exo transfer to cells; (C) cAMP assay of Me665 cells treated with F-exo. 2 × 10⁵ cells were incubated with 5.7 × 10⁷ F-exo, F-exo CT or 0.2 ng/mL CT for 4 h at 37 °C. The graph shows the intracellular cAMP production of cells. * p < 0.05 Values are means ± S.D. (n = 3).

References

    1. Chatterjee D., Chaudhuri K. Association of cholera toxin with Vibrio choleraeouter membrane vesicles which are internalized by human intestinal epithelial cells. FEBS Lett. 2011;585:1357–1362. doi: 10.1016/j.febslet.2011.04.017. - DOI - PubMed
    1. Gill D.M., Rappaport R.S. Origin of the Enzymatically Active AI Fragment of Cholera Toxin. J. Infect. Dis. 1979;139:674–680. doi: 10.1093/infdis/139.6.674. - DOI - PubMed
    1. Sandvig K., Deurs B.V. Transport of protein toxins into cells: Pathways used by ricin, cholera toxin and Shiga toxin. FEBS Lett. 2002;529:49–53. doi: 10.1016/S0014-5793(02)03182-4. - DOI - PubMed
    1. Sánchez J., Holmgren J. Cholera toxin structure, gene regulation and pathophysiological and immunological aspects. Cell. Mol. Life Sci. 2008;65:1347–1360. doi: 10.1007/s00018-008-7496-5. - DOI - PMC - PubMed
    1. Parton R.G. Ultrastructural localization of gangliosides; GM1 is concentrated in caveolae. J. Histochem. Cytochem. 1994;42:155–166. doi: 10.1177/42.2.8288861. - DOI - PubMed

LinkOut - more resources