. 2018 Jun 5;115(23):E5373-E5381.
doi: 10.1073/pnas.1802737115. Epub 2018 May 21.

Postsynaptic δ1 glutamate receptor assembles and maintains hippocampal synapses via Cbln2 and neurexin

Affiliations

Postsynaptic δ1 glutamate receptor assembles and maintains hippocampal synapses via Cbln2 and neurexin

Wucheng Tao et al. Proc Natl Acad Sci U S A. .

Abstract

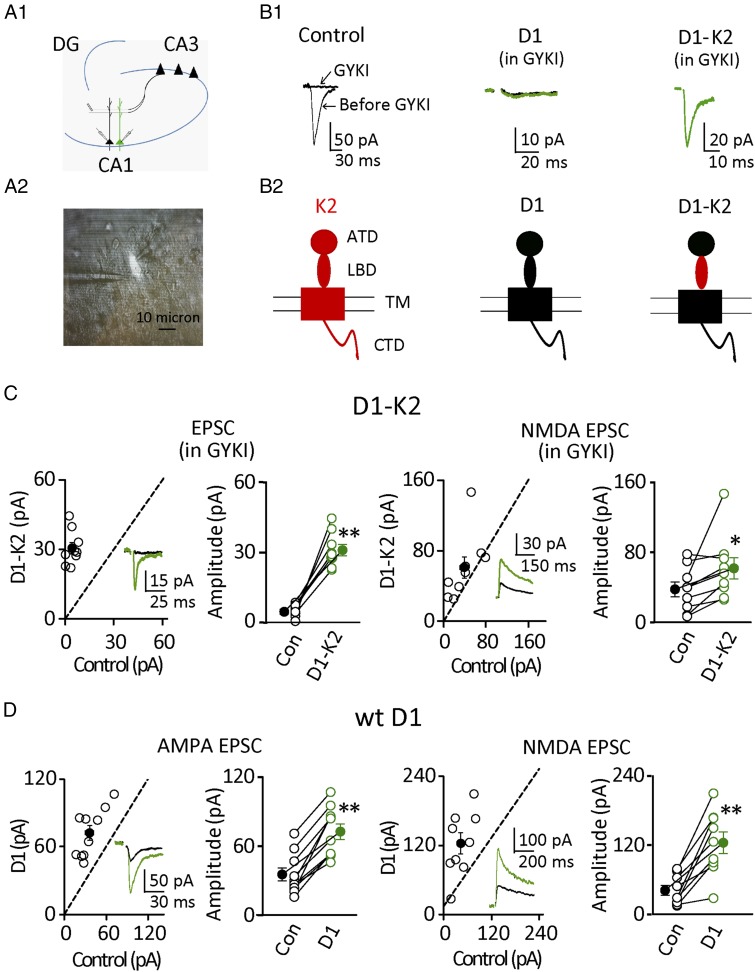
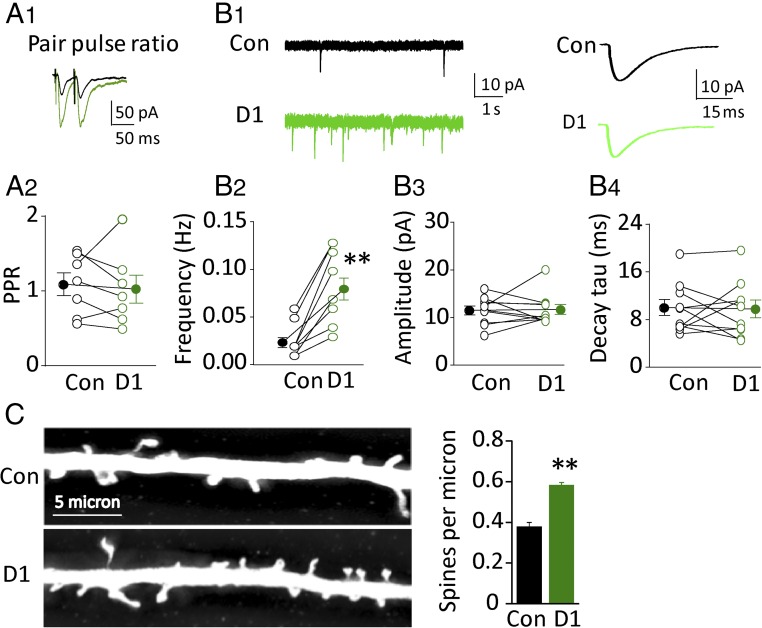
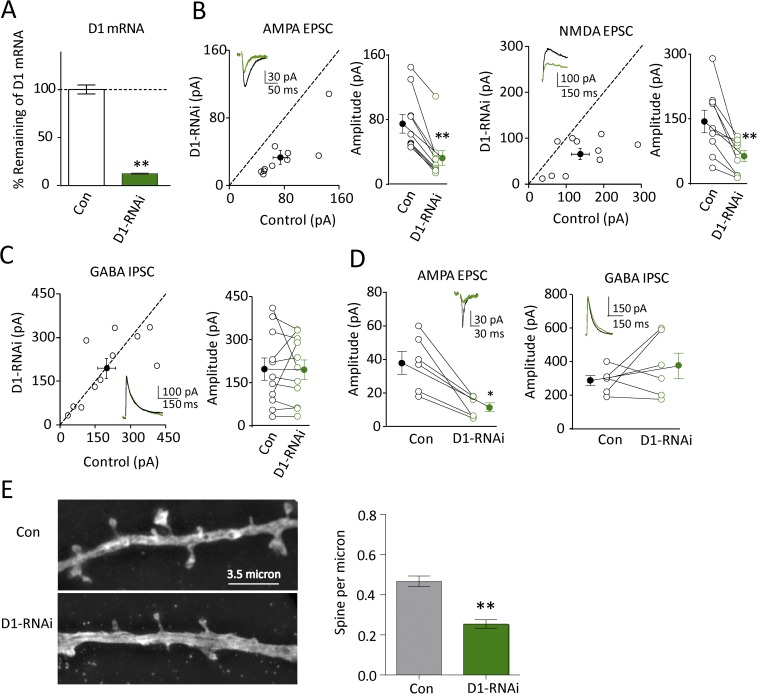
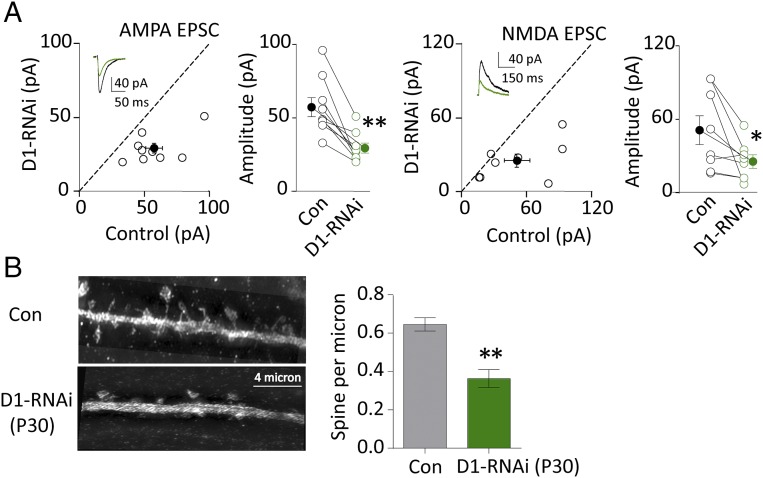
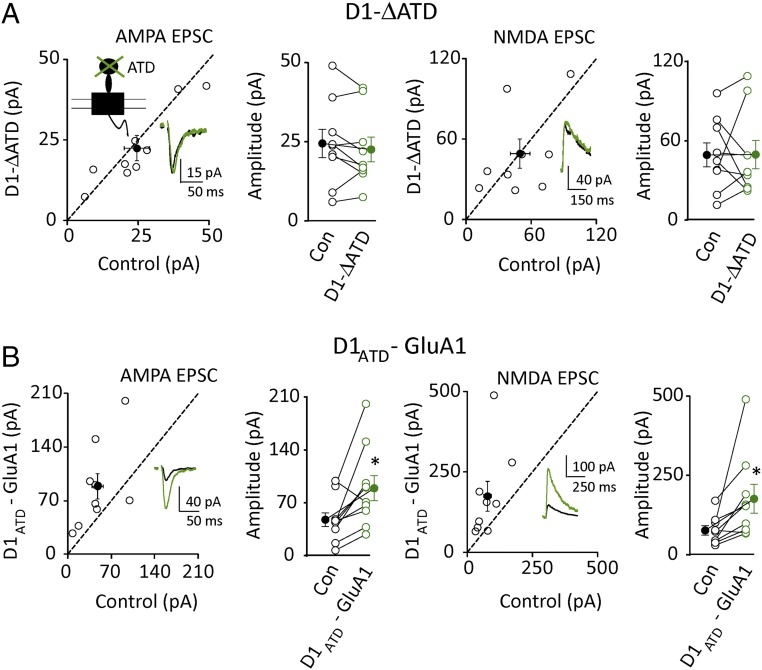
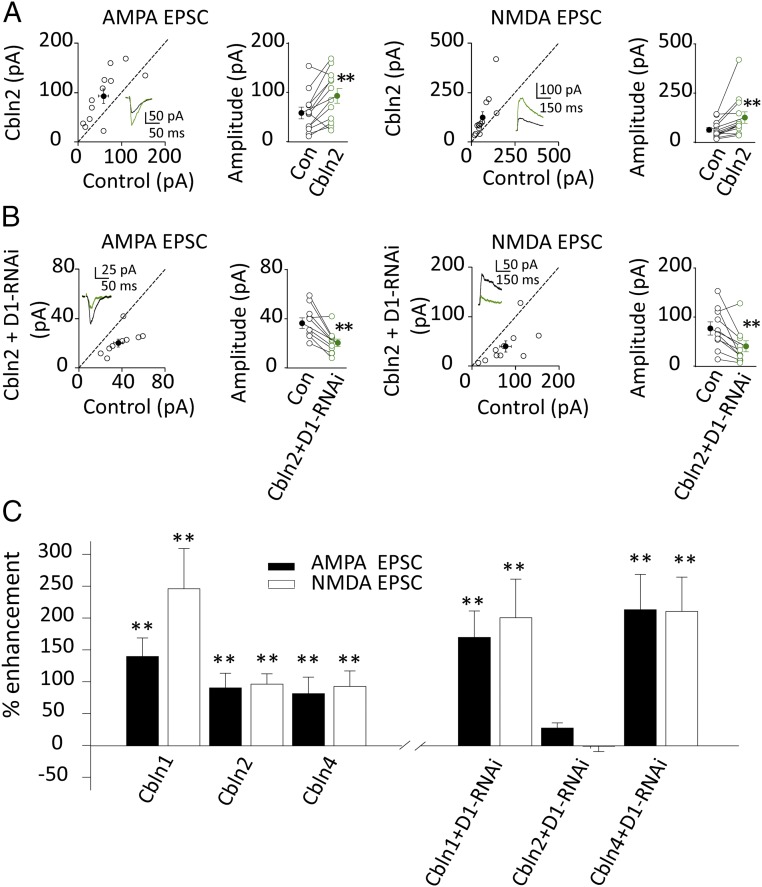
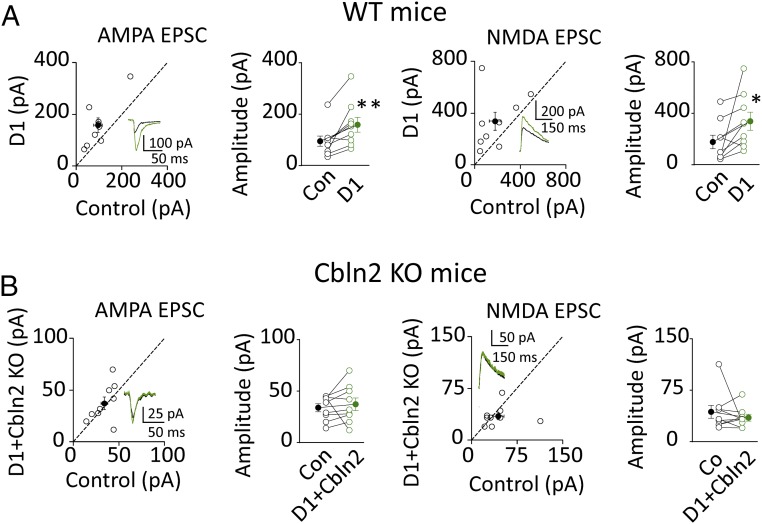
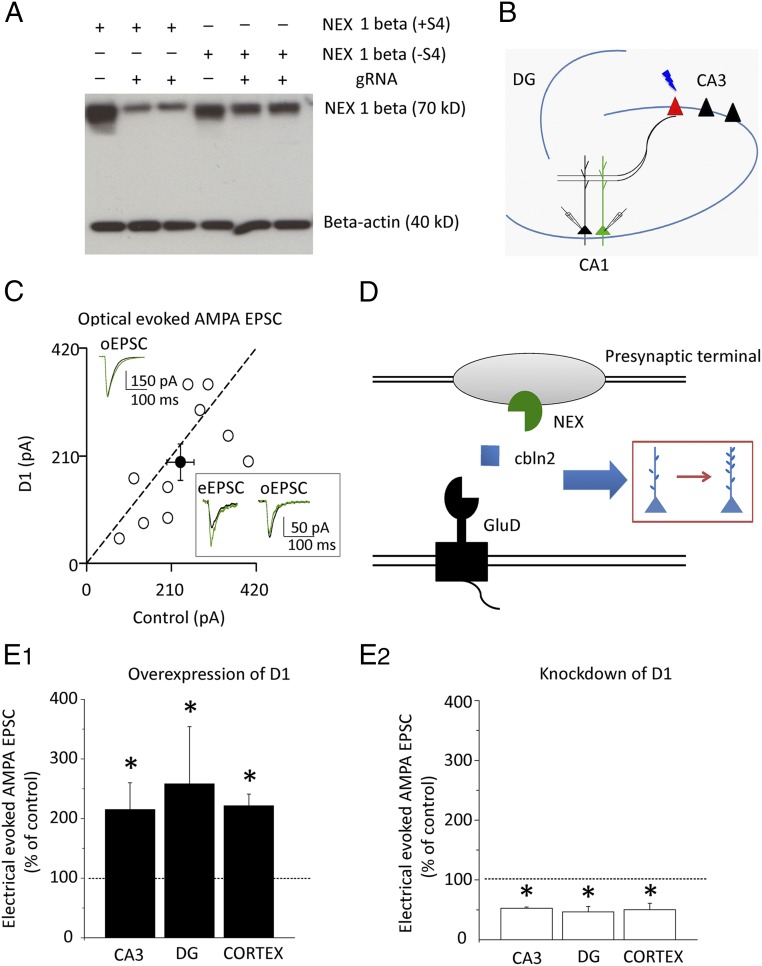
The δ1 glutamate receptor (GluD1) was cloned decades ago and is widely expressed in many regions of the brain. However, its functional roles in these brain circuits remain unclear. Here, we find that GluD1 is required for both excitatory synapse formation and maintenance in the hippocampus. The action of GluD1 is absent in the Cbln2 knockout mouse. Furthermore, the GluD1 actions require the presence of presynaptic neurexin 1β carrying the splice site 4 insert (+S4). Together, our findings demonstrate that hippocampal synapse assembly and maintenance require a tripartite molecular complex in which the ligand Cbln2 binds with presynaptic neurexin 1β (+S4) and postsynaptic GluD1. We provide evidence that this mechanism may apply to other forebrain synapses, where GluD1 is widely expressed.

Keywords: Cbln2; GluD1; hippocampus; neurexin; synapse.


Conflict of interest statement

The authors declare no conflict of interest.

Figures

Fig. 1.
Fig. 1.
Synaptic GluD1 receptors enhanced excitatory synaptic transmission. (A1) Cartoon diagram of paired recordings from D1 biolistic transfected cell (shown in green) and neighboring control cell in CA1, evoked by electrical stimulation of Schaffer collateral pathway. (A2) IR-DIC image of culture slice and paired recordings from D1 transfected cell (bright cell with black gold particle dot) and control cell. (B1) Basic characterizations of D1 receptors: (Left) GYKI (30 µM) completely inhibited AMPA current in control cells; (Center) GYKI (30 µM) completely inhibited AMPA currents in both control and D1 overexpression cells; (Right) D1-K2 overexpression cells generated a GYKI (30 µM) -resistant current. Black traces are control, green are transfected. (B2) Cartoon models of GluK2 (K2), GluD1 (D1), and GluD1-K2 (D1-K2). (C) Summary data of D1-K2 mediated synaptic current in the presence of GYKI [30 µM, control cell (Con): 4.0 ± 0.9 pA; D1-K2: 30.8 ± 2.4 pA; n = 9, P < 0.01]; Overexpression of D1-K2 increased NMDA current (Con: 37.7 ± 8.4 pA; D1-K2: 61.8 ± 12.2 pA; n = 9, P < 0.05). Open circles are individual pairs, filled circle is mean ± SEM. (D) Overexpression of WT D1 increased AMPA (Left, Con: 35.5 ± 5.5 pA; D1: 72.6 ± 6.6 pA; n = 10, P < 0.01) and NMDA currents (Right, Con: 41.8 ± 8.4 pA; D1: 124.2 ± 18.5 pA; n = 9, P < 0.01). **P < 0.01, *P < 0.05.
Fig. 2.
Fig. 2.
Mechanism of synaptic enhancement by GluD1 overexpression. (A1) Representative traces of PPR in control cell (black trace) and D1 overexpression cell (green trace); PPR, two consecutive stimulations separated by 40 ms. (A2) Summary data of PPR (second EPSC normalized to first EPSC) in control cells and D1 overexpression cells [control cell (Con): 1.1 ± 0.1; D1: 1.0 ± 0.2; n = 7, P > 0.05]. Open circles are individual pairs, filled circle is mean ± SEM. (B1, Left) Representative traces of mEPSC in control cell and D1 overexpression cell; (Right) average trace of 100 individual mEPSC events in control cell and D1 overexpression cell. (B2B4) D1 overexpression increased frequency of mEPSC (Con: 0.13 ± 0.06 Hz; D1: 0.54 ± 0.19 Hz; n = 10, P < 0.01), but had no effect on amplitude (Con: 11.49 ± 0.92 pA; D1: 11.7 ± 1.03 pA; n = 10, P > 0.05) and decay time constant (Con: 9.7 ± 1.3 ms; D1: 9.5 ± 1.5 ms; n = 10, P > 0.05) of mEPSC. (C, Left) Representative pictures of a dendrite in Con and D1 overexpression cell (D1); (Right) summary data showing D1 overexpression increased spine density (Con: 0.38 ± 0.03; D1: 0.58 ± 0.01; n = 15, P < 0.01). Spine density expressed as spines per micrometer ± SEM **P < 0.01.
Fig. 3.
Fig. 3.
Knockdown of GluD1 reduced excitatory synaptic transmission but had no effect on inhibitory synaptic transmission. (A) RT-PCR analysis of GluD1 mRNA levels by GluD1 [control cell (Con): 100 ± 4%; D1-RNAi: 12 ± 1%; n = 3, P < 0.01]. (B) Knockdown of D1 reduced AMPA current (Left, Con: 74.8 ± 11.4 pA; D1-RNAi: 32.5 ± 8.9 pA; n = 10, P < 0.01) and NMDA current (Right, Con: 144 ± 26.1 pA; D1-RNAi: 63.3 ± 12.8 pA; n = 10, P < 0.01). Black traces are control, green are transfected. Open circles are individual pairs, filled circle is mean ± SEM. (C) Knockdown of D1 did not change GABA IPSC (Con: 197.4 ± 39.0 pA; D1-RNAi: 195.0 ± 34.2 pA; n = 11, P > 0.05). (D) Simultaneous recordings of AMPA eEPSC (Con: 35.2 ± 8.2 pA; D1-RNAi: 12.7 ± 2.7 pA; n = 6, P < 0.05) and GABA eIPSC (Con: 284 ± 30 pA; D1-RNAi: 373 ± 75 pA; n = 6, P > 0.05) in the same cell. eEPSC and eIPSC were recorded when membrane potential was held at −70 mV and 0 mV, respectively. (E, Left) Representative pictures of a dendrite in Con and D1 knockdown cells (D1-RNAi) of day 6 biolistic-transfected hippocampus culture slice; (Right) summary data showing knockdown of D1 decreased spine density of day 6 transfected hippocampal CA1 pyramidal neuron (Con: 0.46 ± 0.02, n = 11; D1-RNAi: 0.25 ± 0.02, n = 14; P < 0.01). Spine density expressed as spines per micrometer ± SEM *P < 0.05, **P < 0.01.
Fig. 4.
Fig. 4.
GluD1 maintains excitatory synaptic transmission in the adult hippocampus. (A) Knockdown of D1 decreased both AMPA [Left, control cell (Con): 57.3 ± 6.4 pA; D1-RNAi: 29.4 ± 3.3 pA; n = 9, P < 0.01] and NMDA currents (Right, Con: 51.1 ± 11.7 pA; D1-RNAi: 25.5 ± 5.5pA; n = 8, P < 0.05) in P30 virus infected hippocampus CA1 pyramidal neuron; black traces are control, green are transfected. Open circles are individual pairs, filled circle is mean ± SEM. (B, Left) Representative pictures of a dendrite in Con and D1 knockdown cells (D1-RNAi) of postnatal day (P) 30 virus-infected acute slices; (Right) summary data showing knockdown of D1 decreased spine density of P30 virus infected hippocampal CA1 pyramidal neuron (Con, 0.64 ± 0.03, n = 14; D1-RNAi, 0.36 ± 0.04, n = 10; P < 0.01). Spine density expressed as spines per micrometer ± SEM. Note that the spine images shown here are a montage from maximum intensity projection, which processes all images captured at different “z” axes. *P < 0.05, **P < 0.01.
Fig. 5.
Fig. 5.
GluD1 required the ATD for its function. (A) Deletion of ATD of D1 blocked the effects of D1 on both AMPA [Left, control cell (Con): 24.4 ± 4.4 pA; D1-ΔATD: 22.5 ± 3.9 pA; n = 9, P > 0.05] and NMDA currents (Right, Con: 49.3 ± 9.0 pA; D1-ΔATD: 49.6 ± 10.7 pA; n = 9, P > 0.05). (Inset) Schematic topology of a GluD1 receptor showing the following domains: ATD, LBD, transmembrane (TM), C-terminal domain (CTD). Black traces are control, green are transfected. Open circles are individual pairs, filled circle is mean ± SEM. (B) Replacing GluA1 ATD with D1 ATD increased both AMPA (Left, Con: 47.5 ± 9.0 pA; D1ATD- GluA1: 89.2 ± 16.4 pA; n = 10, P < 0.05) and NMDA currents (Right, Con: 76.4 ± 15.0 pA; D1ATD- GluA1: 176.2 ± 45.5 pA; n = 9, P < 0.05). *P < 0.05.
Fig. 6.
Fig. 6.
GluD1 actions require its ligand Cbln2. (A) Overexpression of Cbln2 increased both AMPA [Left, control cell (Con): 58.4 ± 11.9 pA; Cbln2: 93.0 ± 14.7 pA; n = 12, P < 0.01] and NMDA currents (Right, Con: 63 ± 11.4 pA; Cbln2: 125.4 ± 29.1 pA; n = 13, P < 0.01); black traces are control, green are transfected. Open circles are individual pairs, filled circle is mean ± SEM. (B) Cbln2 did not rescue the depression of GluD1-RNAi on excitatory synaptic transmission (Left, AMPA current, Con: 36.4 ± 4.3 pA; Cbln2+D1-RNAi: 20.4 ± 3.0 pA, n = 10, P < 0.01; Right, NMDA currents, Con: 76.9 ± 13.4 pA; Cbln2+D1-RNAi: 40.5 ± 11.2 pA, n = 10, P < 0.01). (C) Summary of Cblns and GluD1-RNAi on excitatory synaptic transmission, all data were normalized to their own control. **P < 0.01.
Fig. 7.
Fig. 7.
GluD1 actions are absent in Cbln2 knockout mice. (A) Overexpression of D1 in WT mouse increased both AMPA current [Left, control cell (Con): 95.1 ± 19.7 pA; D1: 158.8 ± 28.9 pA, n = 9, P < 0.01] and NMDA current (Right, Con: 177.3 ± 52.9 pA; D1: 338.5 ± 70.0 pA, n = 9, P < 0.05). Black traces are control, green are transfected. Open circles are individual pairs, filled circle is mean ± SEM. (B) Overexpression of D1 in Cbln2 KO mice did not increase AMPA current (Left, Con: 33.8 ± 3.9 pA; D1: 37.2 ± 6.1 pA, n = 9, P > 0.05) and NMDA current (Right, Con: 43.5 ± 9.3 pA; D1: 35 ± 4.9 pA, n = 9, P > 0.05). *P < 0.05, **P < 0.01.
Fig. 8.
Fig. 8.
GluD1 actions require presynaptic neurexin 1β (+S4). (A) CRISPR targeting at neurexin 1β (+S4) reduced the protein expression of neurexin 1β (+S4). HA-tagged neurexin 1β (+S4), HA-tagged neurexin 1β (−S4), and gRNA targeting at neurexin 1β (+S4) were transfected in HEK293 cells according to experiment designs. px458 DNA which contains Cas-9 gene was included in all conditions. (B) Experimental designs showing paired recordings from optical stimulation-evoked responses. Green is biolisitc expression of D1 in CA1, while red is the AAV transfection of CRISPR targeting neurexin 1β (+S4) in CA3. (C) AAV injection of CRISPR construct targeting neurexin 1β (+S4) blocked GluD1 actions on AMPA current evoked by optical stimulus [control cell (Con): 231.6 ± 32.7 pA; D1: 198.7 ± 34.9 pA, n = 10, P > 0.05]. Black traces are control, green are transfected. Open circles are individual pairs, filled circle is mean ± SEM. Note, Inset box, a group of representative traces in the same cell showing that AAV blocked GluD1 actions on AMPA current evoked by optical stimulus, but not the effect on AMPA current evoked by electrical stimulus. (D) Cartoon model showing the tripartite molecular complex in which the ligand Cbln2 binds with presynaptic neurexin 1β (+S4) and postsynaptic GluD1 that assemble hippocampus synapses. (E1) D1 overexpression increased AMPA current in CA3 (normalized, 2.2 ± 0.4, n = 6, P < 0.05), DG (normalized, 2.6 ± 0.9, n = 6, P < 0.05), and cortical layer 2/3 pyramidal neurons (normalized, 2.2 ± 0.2, n = 7, P < 0.05). (E2) D1-RNAi reduced AMPA current in CA3 (normalized, 0.52 ± 0.02, n = 6, P < 0.05), DG (normalized, 0.46 ± 0.08, n = 5, P < 0.05), and cortical layer 2/3 pyramidal neurons (normalized, 0.50 ± 0.1, n = 6, P < 0.05), indicating that D1 actions are widely spread in forebrain synapses. *P < 0.05.

References

    1. Traynelis SF, et al. Glutamate receptor ion channels: Structure, regulation, and function. Pharmacol Rev. 2010;62:405–496. - PMC - PubMed
    1. Schmid SM, Hollmann M. Bridging the synaptic cleft: Lessons from orphan glutamate receptors. Sci Signal. 2010;3:pe28. - PubMed
    1. Kashiwabuchi N, et al. Impairment of motor coordination, Purkinje cell synapse formation, and cerebellar long-term depression in GluR delta 2 mutant mice. Cell. 1995;81:245–252. - PubMed
    1. Hirai H, et al. New role of delta2-glutamate receptors in AMPA receptor trafficking and cerebellar function. Nat Neurosci. 2003;6:869–876. - PubMed
    1. Uemura T, et al. Trans-synaptic interaction of GluRdelta2 and neurexin through Cbln1 mediates synapse formation in the cerebellum. Cell. 2010;141:1068–1079. - PubMed

Publication types

MeSH terms