. 2018 Jun 5;115(23):6082-6087.
doi: 10.1073/pnas.1800795115. Epub 2018 May 21.

Distinct encoding of decision confidence in human medial prefrontal cortex

Affiliations

Distinct encoding of decision confidence in human medial prefrontal cortex

Dan Bang et al. Proc Natl Acad Sci U S A. .

Abstract

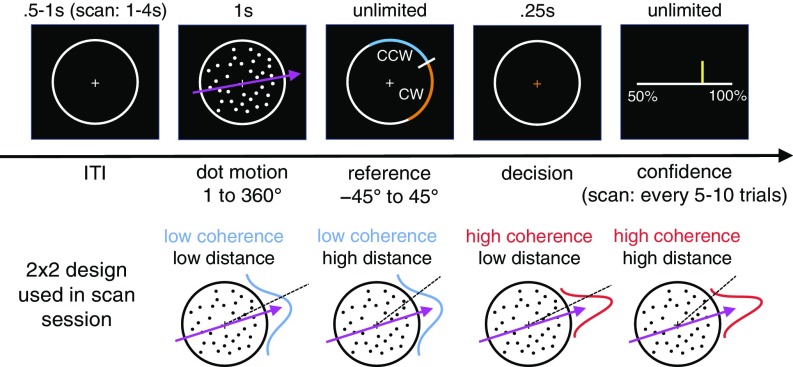
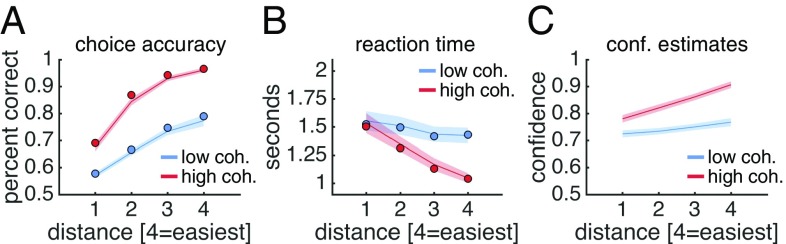
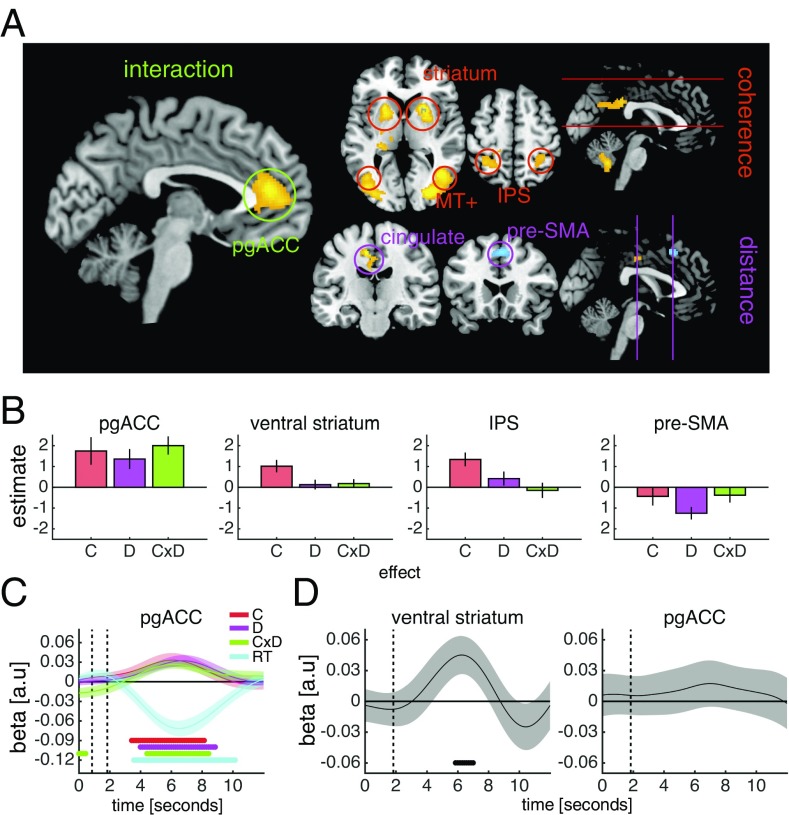
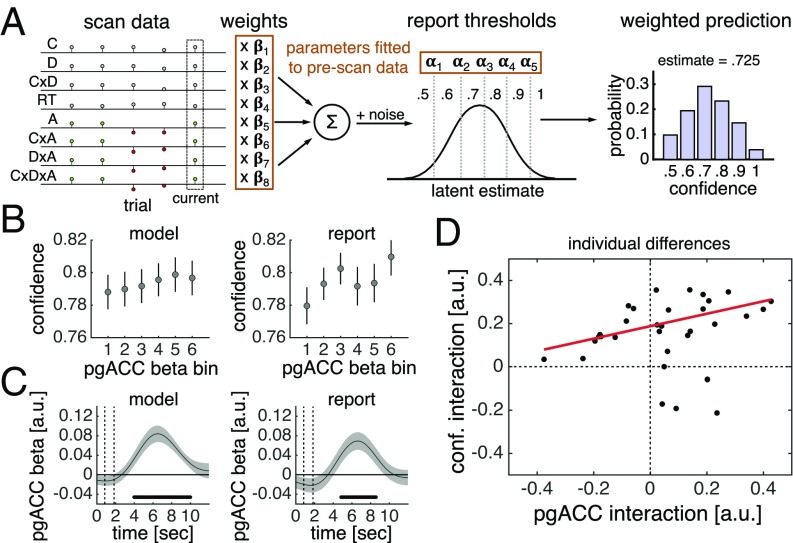
Our confidence in a choice and the evidence pertaining to a choice appear to be inseparable. However, an emerging computational consensus holds that the brain should maintain separate estimates of these quantities for adaptive behavioral control. We have devised a psychophysical task to decouple confidence in a perceptual decision from both the reliability of sensory evidence and the relation of such evidence with respect to a choice boundary. Using human fMRI, we found that an area in the medial prefrontal cortex, the perigenual anterior cingulate cortex (pgACC), tracked expected performance, an aggregate signature of decision confidence, whereas neural areas previously proposed to encode decision confidence instead tracked sensory reliability (posterior parietal cortex and ventral striatum) or boundary distance (presupplementary motor area). Supporting that information encoded by pgACC is central to a subjective sense of decision confidence, we show that pgACC activity does not simply covary with expected performance, but is also linked to within-subject and between-subject variation in explicit confidence estimates. Our study is consistent with the proposal that the brain maintains choice-dependent and choice-independent estimates of certainty, and sheds light on why dysfunctional confidence often emerges following prefrontal lesions and/or degeneration.

Keywords: confidence; decision making; fMRI; medial prefrontal cortex.


Conflict of interest statement

The authors declare no conflict of interest.

Figures

Fig. 1.
Fig. 1.
Continuous-direction random-dot motion task with variable reference. Subjects had to judge whether the net direction of dot motion was counterclockwise or clockwise to a reference that appeared after stimulus offset. We varied the percentage of coherently moving dots and the absolute angular distance between the motion direction and the reference. In the prescan session, confidence estimates (50–100% in steps of 10%) were elicited on every trial. In the scan session, confidence estimates were elicited every 5–10 trials. Information on stimulus calibration is provided in SI Appendix, Fig. S1.
Fig. 2.
Fig. 2.
Behavioral results. (A) Choice accuracy. (B) Reaction time measured from reference onset. (C) Confidence estimates. In A and B, the solid dots represent posterior predictive values from a hierarchical DDM fit to subjects’ responses separately for each condition. In AC, data are from the prescan session. SI Appendix, Fig. S3 provides equivalent plots from the scan session. Data are presented as group mean ± SEM.
Fig. 3.
Fig. 3.
Neural signatures of expected performance, sensory reliability, and boundary distance. (A) Whole-brain factorial analysis of the effects of coherence, distance, and the coherence × distance interaction. Activations are masked as detailed in the text. Cluster colors denote positive (warm) and negative (cold) effects. Clusters are significant at P < 0.05, FWE-corrected for multiple comparisons; the cluster-defining threshold is P < 0.001, uncorrected. Images are shown at P < 0.001, uncorrected. All clusters surviving whole-brain correction postmasking and premasking are detailed in SI Appendix, Tables S1 and S2. SI Appendix, Fig. S5 presents control GLMs. (B) ROI contrast estimates from factorial analysis of the effects of coherence (C), distance (D), and the coherence × distance interaction (C × D). (C) GLM analysis of the effects of coherence (C), distance (D), the coherence × distance interaction (C × D), and choice reaction time (RT) on ROI activity time courses. Vertical dashed lines indicate the onset of the motion stimulus and the choice phase. SI Appendix, Fig. S6 shows additional ROIs. (D) GLM analysis of the effect of reward magnitude on ROI activity time courses on confidence trials. The vertical dashed line indicates the onset of the reward magnitude cue. SI Appendix, Fig. S7 shows additional ROIs. In BD, to avoid biasing subsequent analyses, ROIs were specified using simple contrasts from our factorial analysis (coherence, distance, and coherence × distance) before masking, except for the ventral striatum, which was specified anatomically. To avoid circularity, a leave-one-out cross-validation procedure was used for ROI specification. Data are represented as group mean ± SEM. In C and D, dots below the time course indicate significant excursions of t statistics assessed using two-tailed permutation tests.
Fig. 4.
Fig. 4.
Activity in the pgACC predicts decision confidence. (A) Model of subjective confidence. We fitted an ordinal regression model to each subject’s confidence estimates in the prescan session. The model has a set of weights, which parameterize the effects of stimulus and choice features on confidence estimates, and a set of thresholds, which parameterize report biases. By applying the fitted model to each trial of a subject’s scan data (stimulus and choice features), we generated a prediction about the subject’s subjective confidence in that trial. The prediction is a probability distribution over possible responses (e.g., 0.5 has a 10% probability, 0.6 has a 20% probability, and so forth). We used the expectation over possible responses as our current estimate of subjective confidence. SI Appendix, Fig. S8 presents model evaluation. A, accuracy; C, coherence; D, distance; RT, reaction time. (B) Visualization of encoding of model-derived subjective confidence (all trials) and reported confidence (confidence trials) in single-trial pgACC activity estimates. (C) GLM analysis of encoding of model-derived subjective confidence (all trials) and reported confidence (confidence trials) in pgACC activity time courses. Dots below the time course indicate significant excursion of t statistics assessed using two-tailed permutation tests. In B and C, data are presented as group mean ± SEM. (D) Correlation between the interaction of coherence and distance in pgACC activity and confidence estimates. Interaction effects were calculated as a “difference of differences” in our 2 × 2 design. The pgACC interaction was calculated using all trials; the confidence interaction was calculated using confidence trials only. We used robust linear regression because in high-coherence trials, four outlying subjects were more confident when distance was low than when distance was high—a pattern inconsistent with normative predictions for decision confidence and the behavioral results shown in Fig. 2C.

References

    1. Pouget A, Drugowitsch J, Kepecs A. Confidence and certainty: Distinct probabilistic quantities for different goals. Nat Neurosci. 2016;19:366–374. - PMC - PubMed
    1. Meyniel F, Sigman M, Mainen ZF. Confidence as Bayesian probability: From neural origins to behavior. Neuron. 2015;88:78–92. - PubMed
    1. Kepecs A, Uchida N, Zariwala HA, Mainen ZF. Neural correlates, computation and behavioural impact of decision confidence. Nature. 2008;455:227–231. - PubMed
    1. Bang D, et al. Confidence matching in group decision-making. Nat Hum Behav. 2017;1:0117.
    1. Kiani R, Shadlen MN. Representation of confidence associated with a decision by neurons in the parietal cortex. Science. 2009;324:759–764. - PMC - PubMed

Publication types

LinkOut - more resources