. 2018 Jul;19(7):776-786.
doi: 10.1038/s41590-018-0121-3. Epub 2018 May 21.

Integration of multi-omics data and deep phenotyping enables prediction of cytokine responses

Affiliations

Integration of multi-omics data and deep phenotyping enables prediction of cytokine responses

Olivier B Bakker et al. Nat Immunol. 2018 Jul.

Abstract

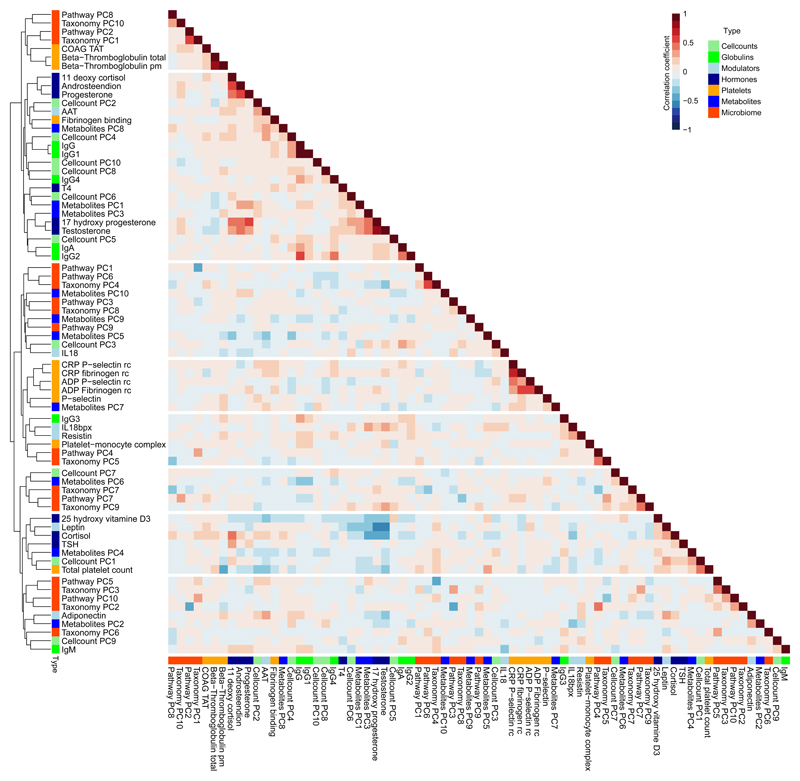
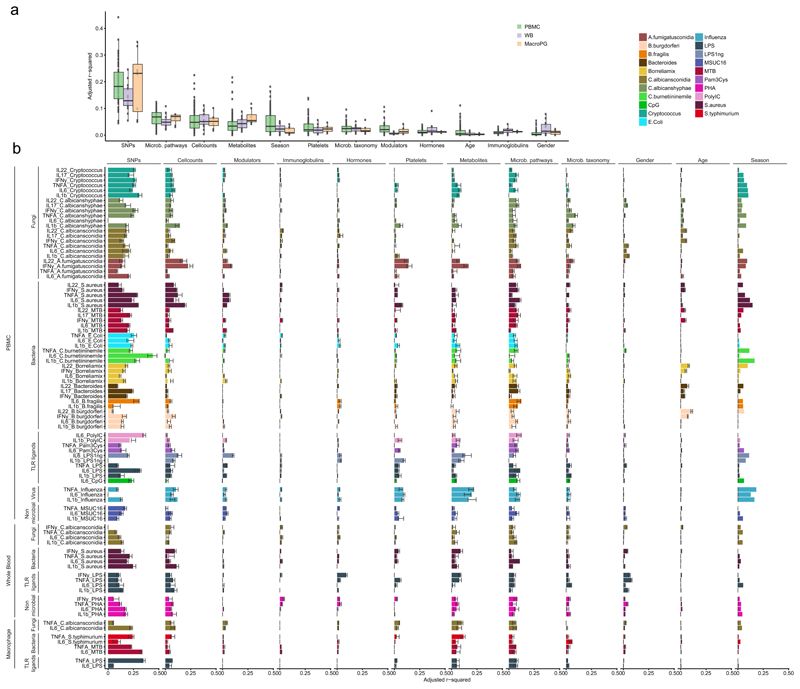
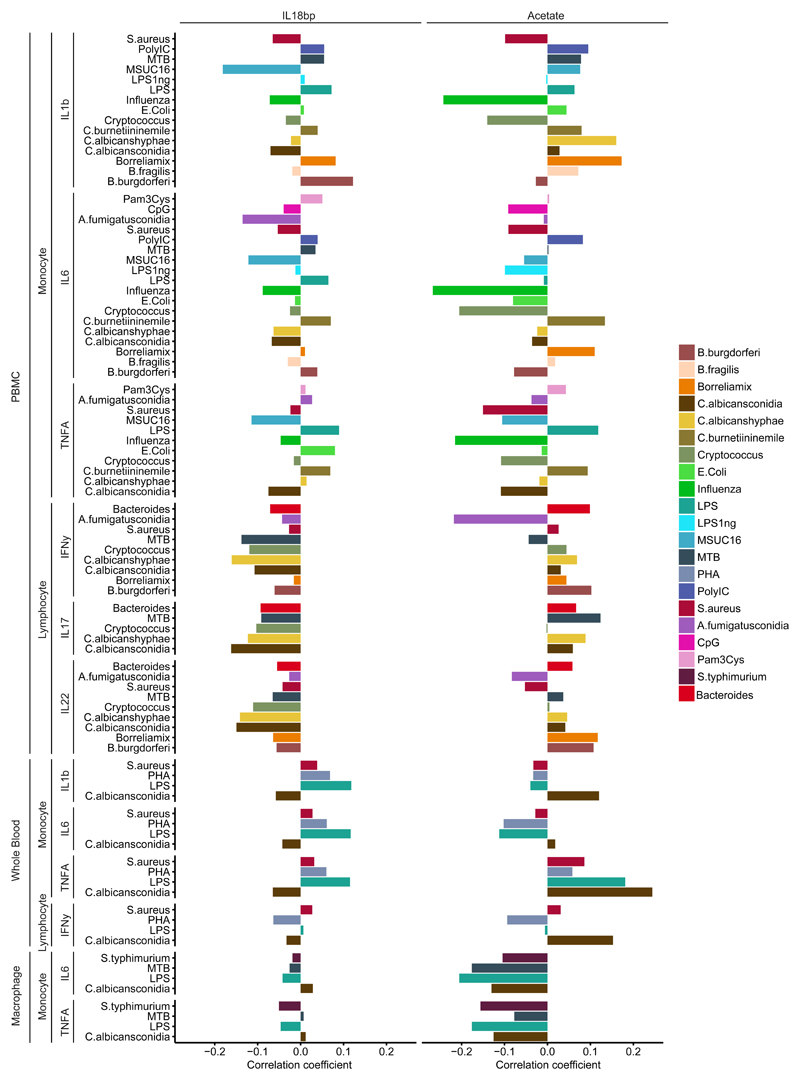
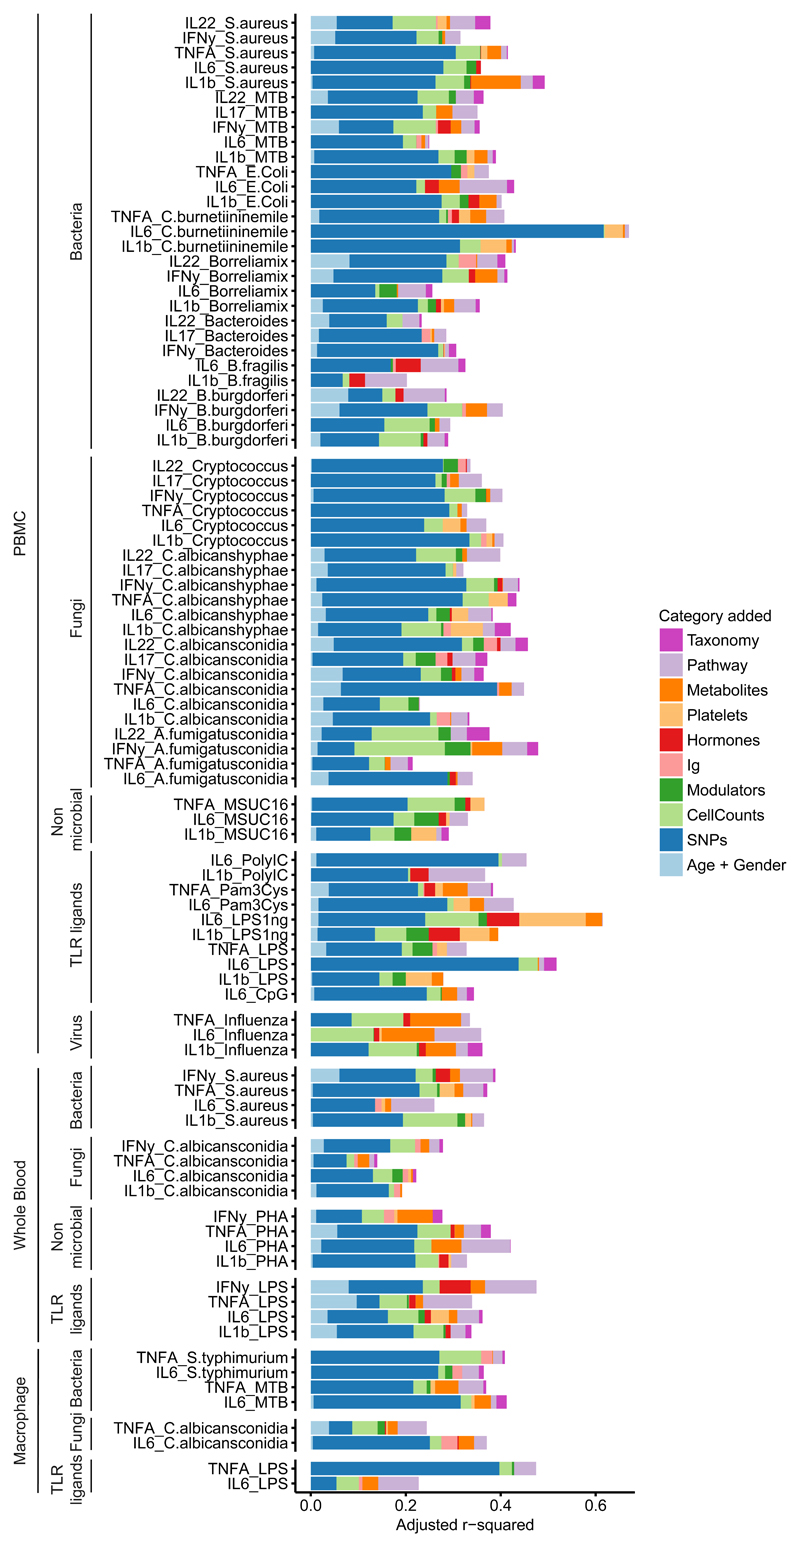
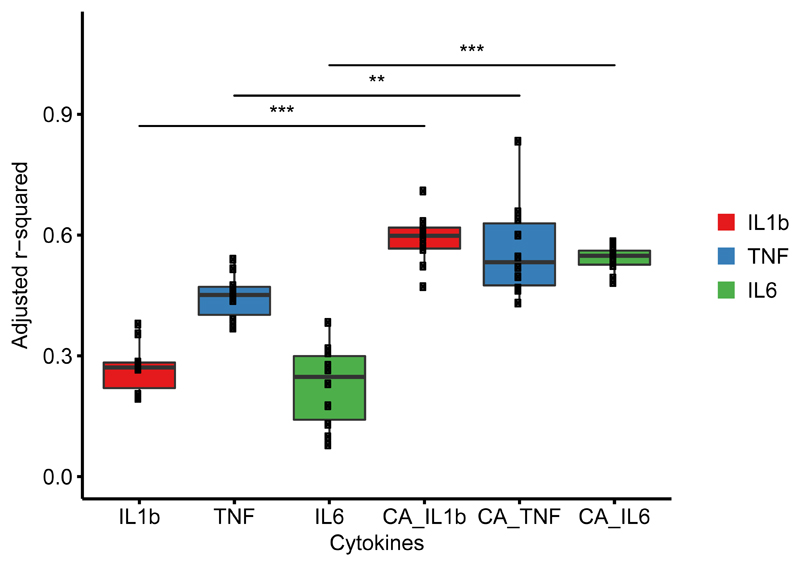
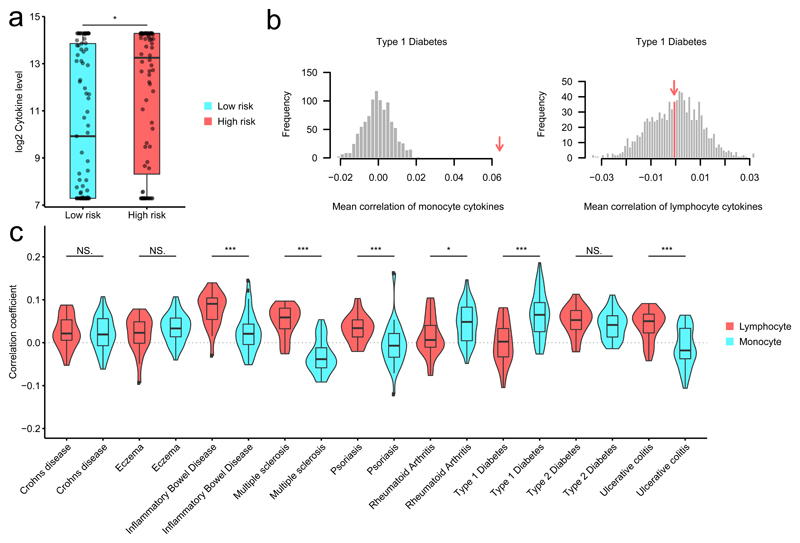
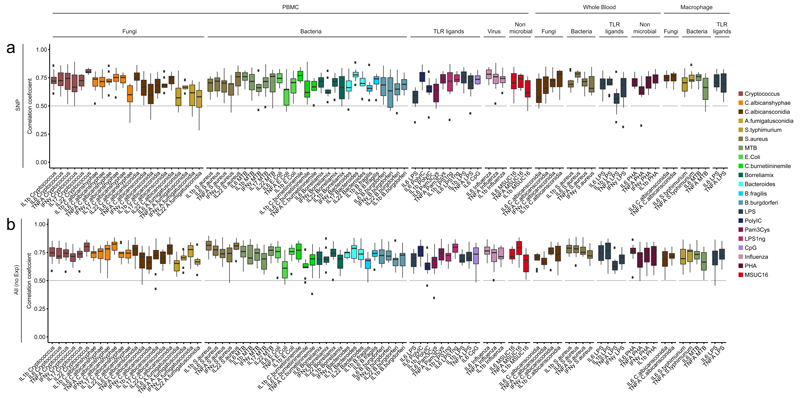
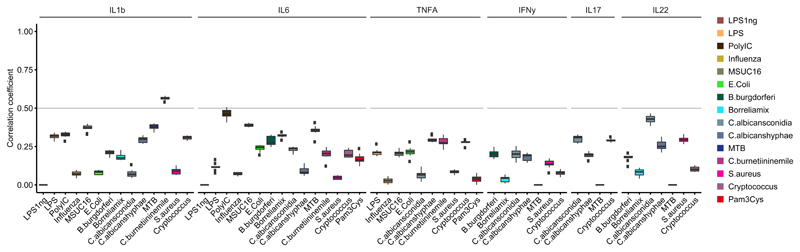
The immune response to pathogens varies substantially among people. Whereas both genetic and nongenetic factors contribute to interperson variation, their relative contributions and potential predictive power have remained largely unknown. By systematically correlating host factors in 534 healthy volunteers, including baseline immunological parameters and molecular profiles (genome, metabolome and gut microbiome), with cytokine production after stimulation with 20 pathogens, we identified distinct patterns of co-regulation. Among the 91 different cytokine-stimulus pairs, 11 categories of host factors together explained up to 67% of interindividual variation in cytokine production induced by stimulation. A computational model based on genetic data predicted the genetic component of stimulus-induced cytokine production (correlation 0.28-0.89), and nongenetic factors influenced cytokine production as well.


Conflict of interest statement

Competing Financial Interests

The authors declare no competing interests.

Figures

Figure 1
Figure 1. Analysis of baseline immune parameters and molecular profiling shows baseline parameters are inter-correlated.
Spearman’s Rank correlations between both immune traits and baseline molecular profiles show that they are inter-correlated (n = 282). For the cell count and omics datasets, the first 10 principal components were extracted and used for calculating the correlation. Colors beside the cluster dendrogram indicate the type of measurements. Every sample represents an individual.
Figure 2
Figure 2. Contribution of baseline immune parameters and multi-omics to cytokine variation.
(a) Percentage of variation in stimulated cytokine production explained by each category of measurements. The distribution indicates the adjusted R2 of a set multivariate linear models (MVLM) representing cytokine stimulation pairs from PBMC (n=67 models), whole blood (n=16 models) and PBMC derived macrophages (n=8 models). Each dot represents the adjusted R2 of a MVLM for a specific cytokine stimulation pair. (b) Contribution of each category to inter-individual cytokine variation. X-axis denotes the adjusted R2 values for the MVLMs. Bars indicate the adjusted R2 estimated on the full dataset. Error bars indicate the standard deviation in adjusted R2 of 10 MVLMs trained on a random subset of samples from the full data (90% of all samples). Y-axis denotes the cytokine-stimulation pairs. Colors indicate different stimulations applied in the experiments. Sample sizes differ between the different categories with the platelet, immune modulator, immunoglobulin and classical phenotypes having n = 489, the immune cell counts n = 472, the metabolites n = 377, microbial pathways n = 384, microbial taxonomy n = 411, hormones n = 486 and SNPs n = 392 samples. Every sample represents an individual.
Figure 3
Figure 3. Examples of baseline molecules which associate differentially to cytokine responses
IL-18BP, a circulating inhibitor of IL-18, displays negative Spearman correlations with general cytokine production capacity of lymphocytes after correcting for age and gender effects (n=489). The metabolite acetate positively correlates with stimulated cytokine production in response to influenza and displays a mostly positive effect on lymphocyte-derived cytokines after correcting for age and gender effects (n=377). Each sample represents an individual.
Figure 4
Figure 4. Cumulative contribution of multiple baseline traits to the variation in stimulated cytokine production.
Adjusted R2 values (x-axis) obtained from multivariate linear models (MVLM) increase when measurements from 10 categories are added sequentially. Each colored bar represents how much additional variation (on top of the preceding colors) the MVLM for that category explains. The order in which features from a dataset were added is from left to right. The combined dataset consisted of 266 samples. Each sample represents an individual. Gene expression was not included in this analysis because of the relatively small sample size of the RNA-seq experiment after overlapping with the other datasets (n = 69). X-axis denotes adjusted R2 values. Y-axis denotes different cytokine-stimulation pairs.
Figure 5
Figure 5. Integrating gene expression profiles and cytokine production in response to C. albicans.
Percentage of inter-individual variation (y-axis, adjusted R2) in stimulated cytokine level of TNF-α, IL-6 and IL-1β explained by gene expression measured at baseline and upon C. albicans stimulation (denoted by CA) is significantly (Wilcox rank sum test, * P < 0.05, ** P < 0.01, *** P < 0.001) higher in the multivariate linear models (MVLM) fitted on stimulated gene expression data. Exact P values of the Wilcox rank sum test are as follows: IL-1β (P = 1.08e-05), TNF-α (P = 8.93e-04) and IL6 (P = 1.08e-05). The distribution shows adjusted R2 (y-axis) of 10 MVLMs fitted after re-sampling using a random subset of samples (90% of all samples each time). Each dot represents the adjusted R2 of a MVLM. The dataset consisted of 64 samples from the GoNL cohort. Each sample represents an individual.
Figure 6
Figure 6. Stimulated cytokine production correlates with genetic risk score for autoimmune diseases.
(a) Example individuals with high genetic risk for (auto)immune disease tend to be high producers of cytokines in response to pathogens. * indicates the significance of the Wilcox rank sum test between low- and high-risk groups for T1D (P=0.011). Low- and high-risk groups (x-axis) were selected by taking the top and bottom quantile of the PRS for T1D. Y-axis indicates the IL-6 level after stimulation of PBMCs with influenza. (b) Distribution mean correlations between T1D risk in monocyte-derived cytokines (left panel) and lymphocyte cytokines (right panel) for 1000 permutations. The measured estimate is indicated by the red arrow. T1D shows significance for monocyte derived cytokines (left) but not for the lymphocyte derived cytokines (right). (c) Distribution of Spearman correlation coefficients between stimulated cytokine production and genetic risk score for immune disease in 430 individuals, shown for PBMC. Genetic risk scores calculated based on genome-wide association studies for different diseases. Significant differences in mean correlation between the lymphocyte- and monocyte-derived cytokines are shown by Wilcox rank sum test (* P < 0.05, ** P < 0.01, *** P < 0.001). Exact p-values are as follows Crohns disease P=7.28E-01, Eczema P=2.55E-01, Inflammatory Bowel Disease P=9.34E-06, Multiple sclerosis P=4.85E-11, Psoriasis P=1.40E-04, Rheumatoid Arthritis P=1.41E-02, Type P=1 Diabetes P=1.00E-05, Type P=2 Diabetes P=1.65E-01, Ulcerative colitis P=1.34E-05.
Figure 7
Figure 7. Cytokine production in response to pathogens can be predicted using genetics and baseline immune profiles.
Spearman correlation between predicted and measured cytokine levels (y-axis) are shown for each of the 10 multivariate linear models from cross validation for all available cytokine stimulation pairs. Cytokine production in response to pathogens can be predicted using SNPs (n = 392 individuals). Prediction accuracy increases when baseline immune parameters and molecular profiles (immune cell frequencies, immune modulators, immunoglobulins, hormone levels, blood platelets, circulating metabolites, gut microbiome composition) are added to the model (n = 353 individuals).
Figure 8
Figure 8. Prediction using the genetic model in an independent dataset. shows some cytokine stimulation pairs can be predicted successfully.
Spearman correlations between predicted cytokine level by the multivariate linear models (MVLM) built using genetics (n = 336) and the measured values in an independent set of stimulation experiments (n = 56). The boxplots show the variation in Spearman correlations from each of the 10 MVLMs predictions from the cross validation strategy.

Similar articles

Cited by

References

    1. Fairfax BP, et al. Innate immune activity conditions the effect of regulatory variants upon monocyte gene expression. Science. 2014;343:1246949. - PMC - PubMed
    1. Kumar V, Wijmenga C, Xavier RJ. Genetics of immune-mediated disorders: from genome-wide association to molecular mechanism. Current Opinion in Immunology. 2014;31:51–57. - PMC - PubMed
    1. Lee MN, et al. Common genetic variants modulate pathogen-sensing responses in human dendritic cells. Science. 2014;343:1246980. - PMC - PubMed
    1. Netea MG, Wijmenga C, O’Neill LAJ. Genetic variation in Toll-like receptors and disease susceptibility. Nat Immunol. 2012;13:535–542. - PubMed
    1. Ye CJ, et al. Intersection of population variation and autoimmunity genetics in human T cell activation. Science. 2014;345:1254665. - PMC - PubMed

Publication types