. 2018 Jun;20(6):677-687.
doi: 10.1038/s41556-018-0108-1. Epub 2018 May 21.

Clonal analysis of Notch1-expressing cells reveals the existence of unipotent stem cells that retain long-term plasticity in the embryonic mammary gland

Affiliations

Clonal analysis of Notch1-expressing cells reveals the existence of unipotent stem cells that retain long-term plasticity in the embryonic mammary gland

Anna M Lilja et al. Nat Cell Biol. 2018 Jun.

Abstract

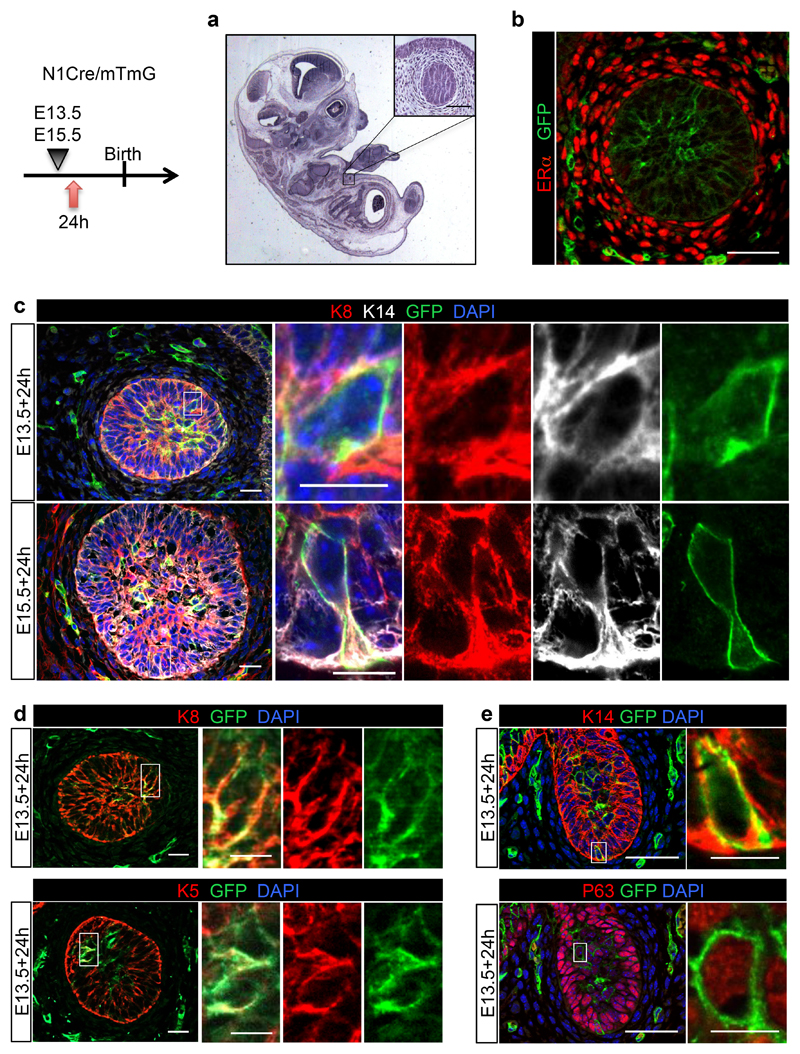
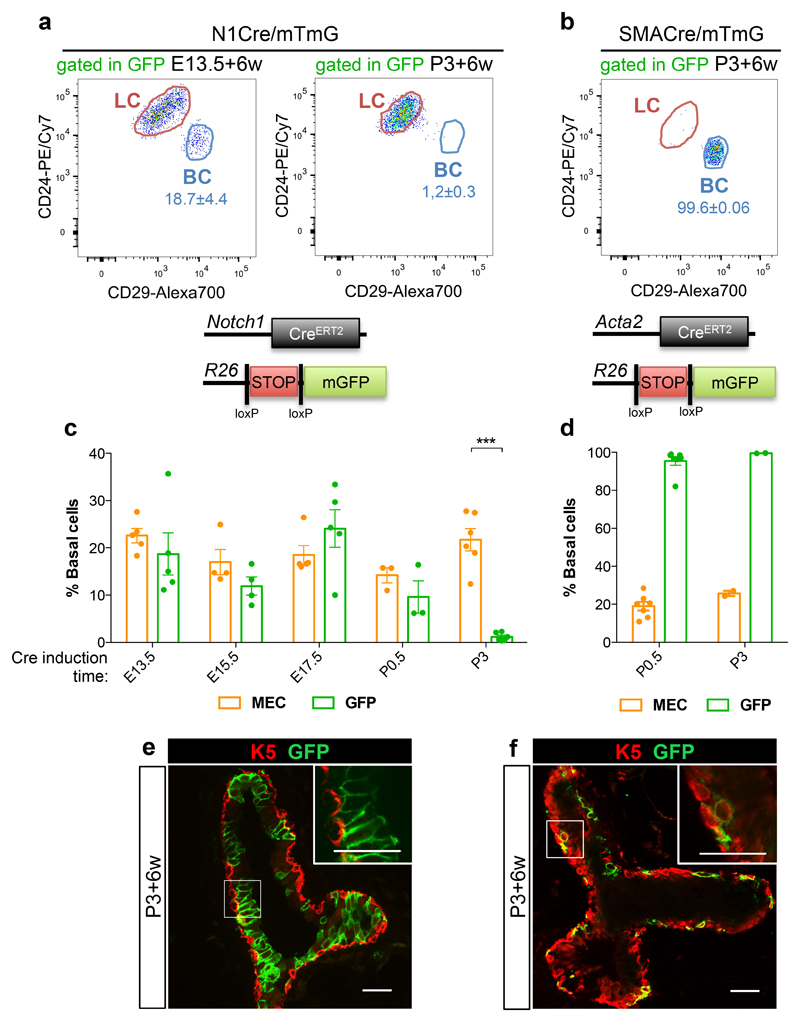
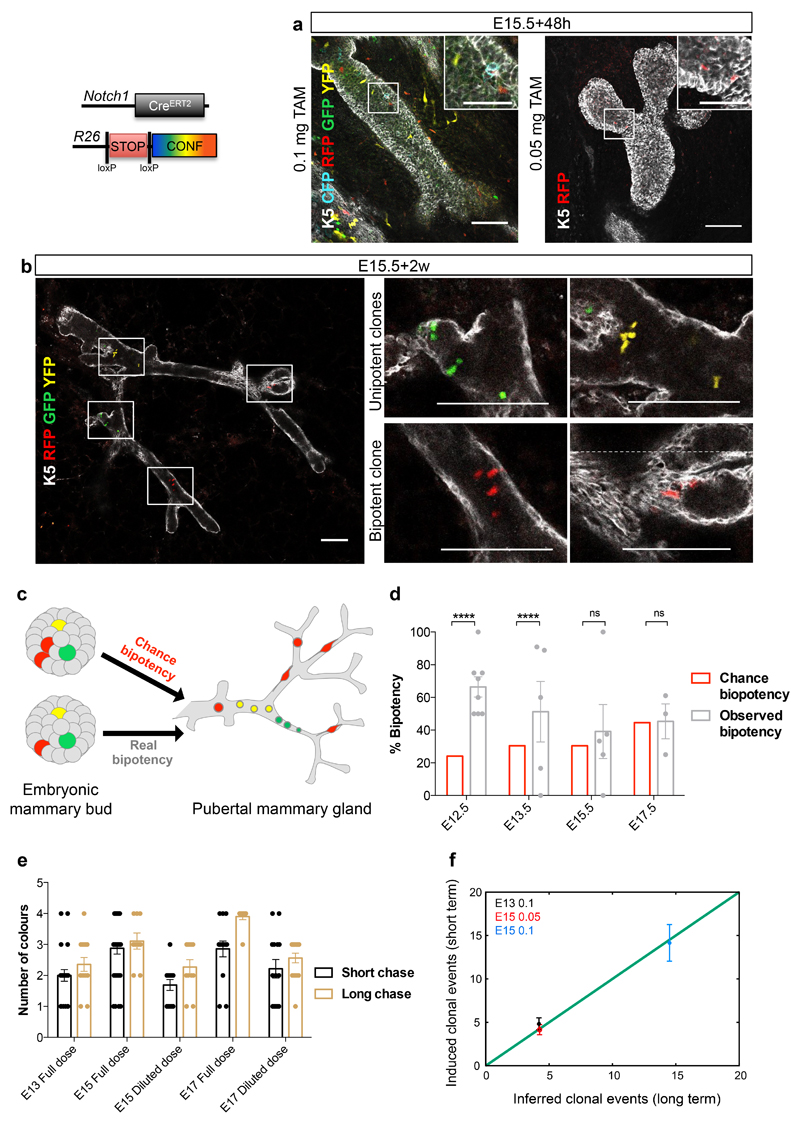
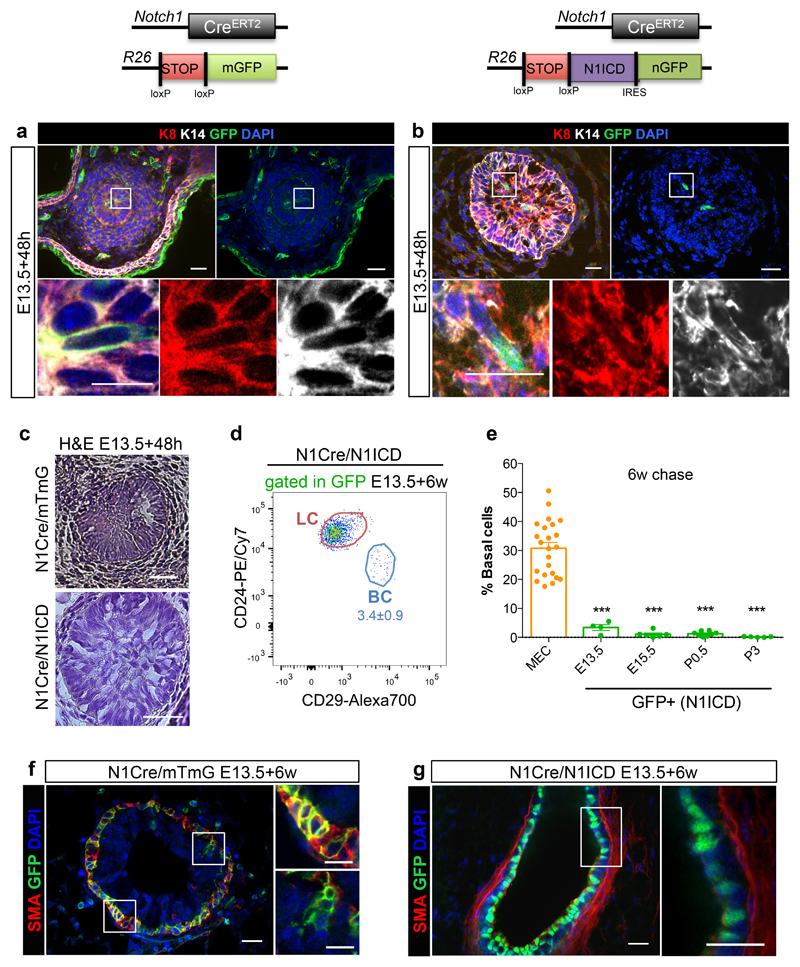
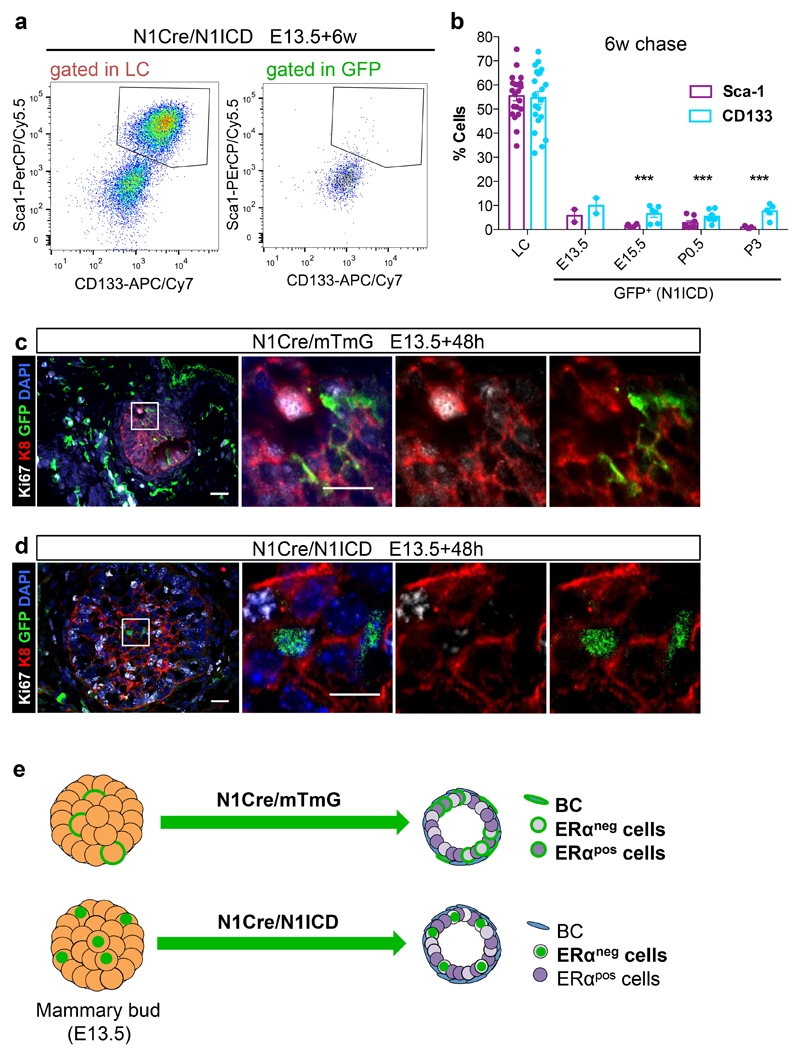
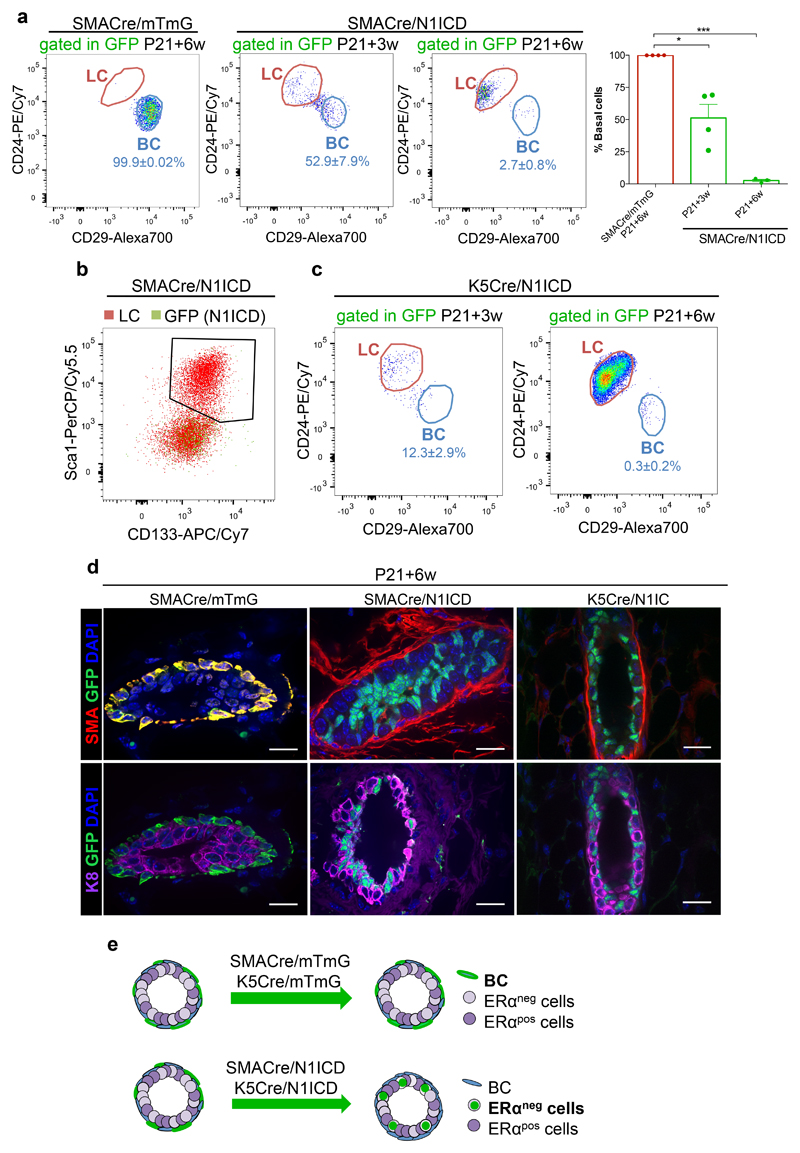
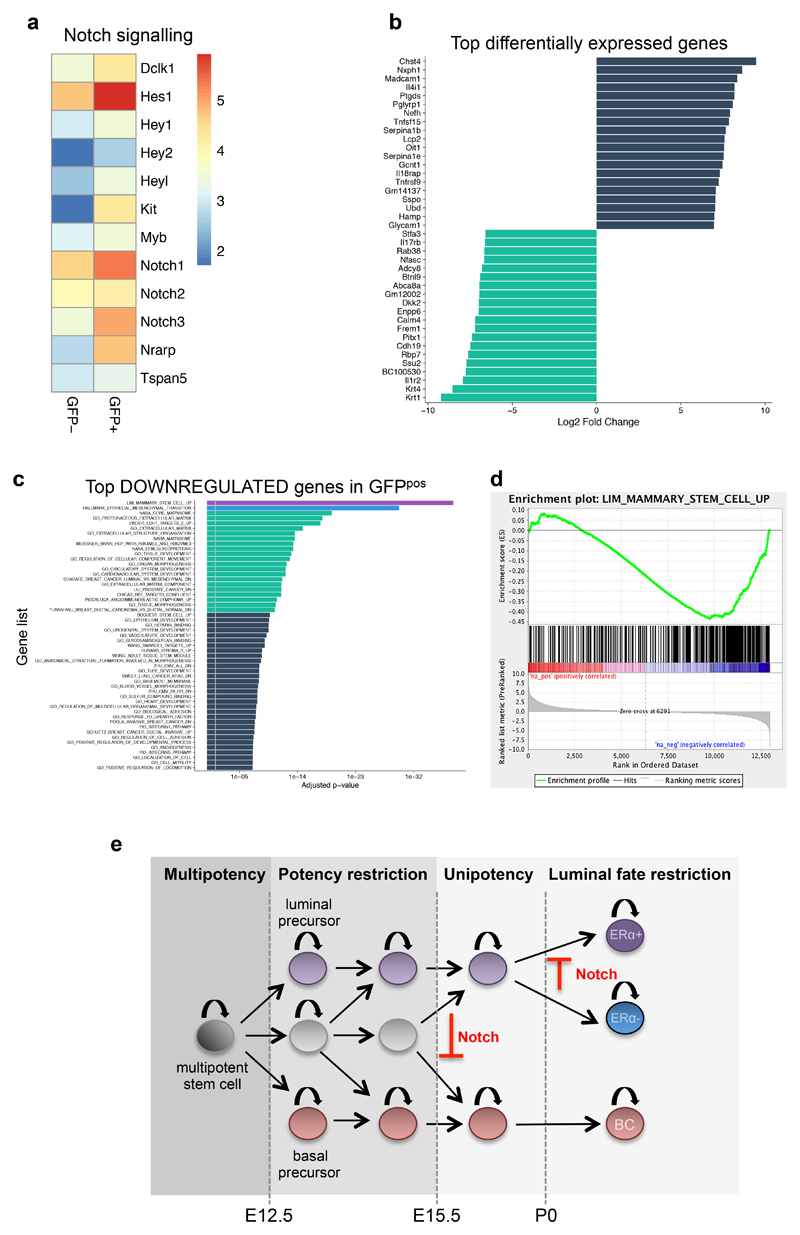
Recent lineage tracing studies have revealed that mammary gland homeostasis relies on unipotent stem cells. However, whether and when lineage restriction occurs during embryonic mammary development, and which signals orchestrate cell fate specification, remain unknown. Using a combination of in vivo clonal analysis with whole mount immunofluorescence and mathematical modelling of clonal dynamics, we found that embryonic multipotent mammary cells become lineage-restricted surprisingly early in development, with evidence for unipotency as early as E12.5 and no statistically discernable bipotency after E15.5. To gain insights into the mechanisms governing the switch from multipotency to unipotency, we used gain-of-function Notch1 mice and demonstrated that Notch activation cell autonomously dictates luminal cell fate specification to both embryonic and basally committed mammary cells. These functional studies have important implications for understanding the signals underlying cell plasticity and serve to clarify how reactivation of embryonic programs in adult cells can lead to cancer.


Conflict of interest statement

Competing Financial Interest. All authors declare no competing financial interests.

Figures

Figure 1
Figure 1. Embryonic mammary buds co-express luminal and basal markers.
Representative sections of mammary embryonic buds of N1Cre/mTmG embryos induced with tamoxifen at E13.5 (a, b, c, upper panel, d, e), or at E15.5 (c lower panel) and analysed 24h later by: hematoxylin coloration (a); immunostaining using an anti-ERα antibody (in red in b); immunofluorescence for the luminal marker K8 (in red, in c and d, upper panel) and the basal markers K14 (in white in c and in red in e, upper panel); K5 (in red, bottom panel in d); and p63 (in red, lower panel in e). GFPpos cells in green represent N1Cre-labelled embryonic cells in b-e. DAPI stains the nuclei in blue in c, e. Split channels for each colour are shown in the inset magnifications in c-d. 3 individual embryos for induction at E13.5 and 3 individual embryos for induction at E15.5. Scale bars correspond to 20 μm in b-e, and 10 μm in the magnifications in c-e.
Figure 2
Figure 2. Luminal and basal identities are specified at birth.
a-b. Representative FACS dot plots of luminal (LC) and basal cells (BC) gated within the GFPpos population in N1Cre/mTmG (a) or SMACre/mTmG (b) mice 6 weeks after tamoxifen induction at E13.5 (a) or at P3 (a-b) quantified in c and d. c-d. FACS quantification of GFPpos BC (in green) as compared to the proportion of BC within Mammary Epithelial Cells (MEC, in orange) in N1Cre/mTmG (c) or SMACre/mTmG (d) mice, 6 weeks after tamoxifen induction at the indicated developmental times; n=5, 4, 5, 3 and 6 independent mice for N1Cre/mTmG induced at E13.5, E15.5, E17.5, P0.5 (MEC: 19.01±2.27, GFP: 95.45±2.26) and P3 (MEC: 25.67±1.37 and GFP: 99.56±0.06), respectively; n=7 and 2 biologically independent animals for SMACre/mTmG induced at P0.5 and P3, respectively. Schematic diagrams of the Notch1-CreERT2 and SMA-CreERT2 (Acta2-CreERT2) crossed to Rosa26mTmG mice are shown above each graph. e-f. Representative sections of mammary ducts analysed by immunofluorescent staining for K5 (in red) in N1Cre/mTmG (e) and SMACre/mTmG (f) mice, 6 weeks after tamoxifen induction at P3. Lineages derived from Notch1pos or SMApos cells are marked by membrane-bound GFP in green; 2 mice for each line. Scale bars correspond to 20 μm in e-f and 10 μm in the insets. Graphs show mean ± SEM. p=0.000006 in (c) and p=0.00000000002 and 0.0003 for P0.5 and P3 respectively (d), using two-tailed unpaired Welsh’s t-test. *** p<0.001. Source data are available in Supplementary Table 1.
Figure 3
Figure 3. Notch1pos embryonic mammary cells show unipotent cell fate potential.
a-b. Single Z-stacks of wholemount immunostaining of mammary trees from N1Cre/Confetti mice, induced with 0.05mg or 0.1mg of tamoxifen at E15.5, analysed 48h (a) and 2 weeks later (b). Immunostaining for K5 (white) marks basal cells. GFP (green), Cyan (blue), YFP (yellow), RFP (red) mark Notch1-derived lineages considered as unique clones derived from one ESC; 98 glands in 30 embryos and 139 clones from 65 glands in 21 mice. Images were acquired as different tiles without overlap and stitched juxtaposed. Dotted line in (b) demarcates the stitching. c. Schematic diagram illustrating how 2 independent labelling events of unipotent cells (red cells, “chance bipotency”) can be confused with the unique labelling of a multipotent stem cell (red cell, “real bipotency”). d. Percentage of theoretical chance bipotency (red) compared to experimentally scored bipotency (grey) in 1-2 week-old N1Cre/Confetti mice induced with tamoxifen at indicated embryonic stages. n= 8, 5, 5, 3 independent animals induced at E12.5, E13.5, E15.5, E17.5. p values = P<0.0001, P<0.0001, P=0.5 and P=0.43. Tamoxifen dose was adjusted at each time point to reach comparable recombination efficiency, indicated by the average number of floxed colours/gland (see Methods). e. Average number of colours/gland from mice induced at indicated time points, with indicated doses, analysed after 48h (short chase, in black) or at P7 (long chase, in brown). Recombination efficiency (short chase) reflects the number of colours found at P7 (long chase) at each tamoxifen dose (differences not significant). n=22, 32, 13, 14, 14 independent mammary glands for short times, and n=14, 9, 11, 10, 16 for long chase. f. Number of induced clonal events scored after a short chase vs number of inferred clonal events estimated from a long chase. n=12, 9, 8 biologically independent animals induced at E13.5 full dose (black dots), E15.5 diluted dose (red dots) and E15.5 full dose (blue dots). Two-tailed binomial test was applied to assess statistical differences between groups. Graphs show mean ± SEM. Source data in Supplementary Table 1. Scale bars are 100 μm or 50 μm in the magnifications in (a), 100 μm in (b).
Figure 4
Figure 4. Notch1 activation in embryos locks multipotent stem cells into a luminal unipotent cell fate.
a-c. Representative sections of N1Cre/mTmG (a, c) and N1Cre/N1ICD (b, c) induced at E13.5 and analysed 48h later, by immunofluorescent staining for the basal marker K14 (in white), the luminal marker K8 (in red) and anti-GFP (green) (a, b), or stained with hematoxylin (c). Notch1-derived lineages are labelled in green by membrane-bound GFP in the N1Cre/mTmG model (a) and by nuclear GFP in N1Cre/N1ICD mice (b). DAPI stains nuclei in blue in a, b; 2 embryos per genotype. Schematic diagrams of the N1Cre/mTmG and the N1Cre/N1ICD mice are shown above panel a and b respectively. d. Representative FACS dot plot of luminal (LC) and basal cells (BC) within the GFPpos population in N1Cre/N1ICD mice 6 weeks after tamoxifen induction at E13.5; n=4 mice. e. FACS quantification of the percentage of BC within MEC (in orange) or within GFPpos cells (in green) in N1Cre/N1ICD mice induced with tamoxifen at the indicated developmental times and analysed after a 6-week chase; n=4, 6, 8, and 5 biologically independent animals induced at E13.5, E15.5, P0.5 and P3, respectively. The orange dots represent the MEC population from all mice analysed (n=23). p-values were calculated using Mann-Whitney test: p=0.0001, p<0.0001, p<0.0001 and p<0.0001, respectively. f-g. Representative sections of N1Cre/mTmG (f) and N1Cre/N1ICD (g) induced at E13.5 and analysed 6 weeks later, by immunofluorescent staining for the basal marker SMA (in red) and anti-GFP (green). Notch1-derived lineages are labelled in green by membrane-bound GFP in the N1Cre/mTmG model (f) and by nuclear GFP in N1Cre/N1ICD (g) mice. DAPI stains nuclei in blue; 5 and 4 mice, respectively. Scale bars correspond to 20 μm or 10 μm (in magnifications). Graphs indicate average values ± SEM. ***p< 0.001. Source data are available in Supplementary Table 1.
Figure 5
Figure 5. Notch1 dictates luminal ERαneg cell fate.
a. Representative FACS dot plots of CD133 and Sca1 expression in total luminal cells (gated in LC) or GFPpos LC (gated in GFP) in N1Cre/N1ICD mice 6 weeks after tamoxifen induction at E13.5, 2 independent mice. b. FACS data quantification showing the percentage of luminal cells (LC) or of N1ICD-expressing cells (GFP) that presents Sca1 (in purple) or CD133 (in blue) expression, after a 6-week chase of N1Cre/N1ICD mice induced with tamoxifen at the indicated times. N=2, 6, 8, and 5 biologically independent animals induced at E13.5, E15.5, P0.5 and P3, respectively; n=21 in the LC graph. Graphs show mean ± SEM: 5.7±2.6 for Sca-1 and 9.9±3.2 for CD133 (E13.5), 1.7±0.3 for Sca-1 and 6.5±1.4 for CD133 (E15.5), 2.8±0.8 for Sca-1 and 5.4±0.9 for CD133 (P0.5), 0.9±0.2 for Sca-1 and 7.6±1.3 for CD133 (P3). p=***p<0.001 using two-tailed unpaired Welsh’s t-test. c-d. Representative sections of N1Cre/mTmG (c) and N1Cre/N1ICD (d) mice induced at E13.5 and analysed 48h later, by immunofluorescent staining for the luminal marker K8 (in red) and the proliferation marker Ki67 (in white). Notch1-derived lineages are labelled in green by membrane-bound GFP in the N1Cre/mTmG model (c) and by nuclear GFP in N1Cre/N1ICD (d) mice. DAPI stains nuclei in blue; 2 biologically independent animals. e. Schematic diagram illustrating how Notch1 activation (N1Cre/N1ICD) imposes a luminal ERαneg cell fate to embryonic cells (E13.5), which would otherwise be able to give rise to all mammary cell types (N1Cre/mTmG). Source data are available in Supplementary Table 1.
Figure 6
Figure 6. Ectopic Notch1 activation switches the fate of committed mammary cells.
a. Representative FACS plots and quantification of the percentage of BC within the GFPpos population of SMACre/mTmG (left panel, n=4 biologically independent animals) or SMACre/N1ICD (right panel) induced at P21 and analysed after 3 weeks (n=5 mice) or 6 weeks (n=3 mice). Graphs show mean ± SEM: 51.3±10.5 (3w chase) and 2.6±1.0 (6w chase). P-vales were calculated using two-tailed unpaired Welsh’s t-test: p= 0.0189 and p<0.0001. b. Dot plot of Sca1pos/CD133pos cells among total LC (in red) and GFPpos cells (in green) in SMACre/N1ICD mice (P21+6-week chase); n=4 biologically independent animals. c. Representative FACS plots of K5Cre/N1ICD induced at P21 and analysed after 3 weeks or 6 weeks; n=3 independent animals. d. Representative paraffin sections of mammary ducts from SMACre/mTmG (left panel) or cryosections of glands from SMACre/N1ICD (middle panel) or K5Cre/N1ICD (right panel) females induced with tamoxifen at P21 and analysed 6 weeks later by immunofluorescent staining using anti-SMA (in red) or anti-K8 (in purple) antibodies. SMA-derived lineages are labelled in green by membrane-bound GFP in the SMACre/mTmG model and by nuclear GFP in SMACre/N1ICD mice; 4 biologically independent animals. Scale bars correspond to 20 μm. e. Schematic diagram illustrating how ectopic Notch1 activation in basal cells (SMACre/N1ICD or K5Cre/N1ICD) imposes a luminal ERαneg cell fate even to already committed basal cells. ***p<0.001 and *p<0.05. Source data are available in Supplementary Table 1.
Figure 7
Figure 7. Transcriptomic analysis of the basal to luminal switch induced by Notch1 activation.
a. Heatmap of Notch1 related genes, using the log(fpkm) of the average expression values (fpkm) of 3 replicates each for GFPneg and GFPpos cells. b. Transcripts with more than five Log2 Fold Change (FC) differences obtained by RNA-seq of GFPneg and GFPpos sorted cells from SMA/N1ICD mice 72h after TAM induction; the blue bars correspond to the transcripts that are overexpressed, and the green bars indicate the transcripts that are downregulated. c. Over-represented GO categories among the top genes significantly downregulated upon Notch activation. d. Gene Set Enrichment analysis (GSEA) showing the inverse correlation between genes expressed upon Notch activation (in GFPpos cells) compared to the GO signature of “Mammary_Stem_Cell_Up”. A set of 12984 genes from three replicates was pre-ranked based on log2 fold changes. e. Model of the differentiation hierarchy during embryonic mammary gland development. Multipotent mammary stem cells are present in the early mammary placode, but at E12.5 some lineage restriction starts to occur, as unipotent luminal or basal precursor can be found at a frequency of about 30-40%, while the remaining MaSCs are still multipotent. Starting at embryonic day E15.5, no statistically discernable multipotency can be observed, suggesting that prenatal growth and branching of the mammary gland is supported by unipotent luminal or basal progenitors. At P0, an additional degree of fate restriction establishes two independently sustained luminal lineages, ERpos and ERneg luminal cells. Notch signalling prevents the generation of basal precursors during mammary embryogenesis and blocks ERpos cell fate specification.

Comment in

References

    1. Wansbury O, et al. Transcriptome analysis of embryonic mammary cells reveals insights into mammary lineage establishment. Breast cancer research: BCR. 2011;13:R79. - PMC - PubMed
    1. Robinson GW. Cooperation of signalling pathways in embryonic mammary gland development. Nat Rev Genet. 2007;8:963–972. doi: 10.1038/nrg2227. - DOI - PubMed
    1. Veltmaat JM, Mailleux AA, Thiery JP, Bellusci S. Mouse embryonic mammogenesis as a model for the molecular regulation of pattern formation. Differentiation. 2003;71:1–17. doi: 10.1046/j.1432-0436.2003.700601.x. - DOI - PubMed
    1. Watson CJ, Khaled WT. Mammary development in the embryo and adult: a journey of morphogenesis and commitment. Development. 2008;135:995–1003. doi: 10.1242/dev.005439. - DOI - PubMed
    1. Stingl J, Raouf A, Eirew P, Eaves CJ. Deciphering the mammary epithelial cell hierarchy. Cell Cycle. 2006;5:1519–1522. - PubMed

Publication types

MeSH terms