. 2018 Jun;20(6):666-676.
doi: 10.1038/s41556-018-0095-2. Epub 2018 May 21.

Early lineage segregation of multipotent embryonic mammary gland progenitors

Affiliations

Early lineage segregation of multipotent embryonic mammary gland progenitors

Aline Wuidart et al. Nat Cell Biol. 2018 Jun.

Erratum in

Abstract

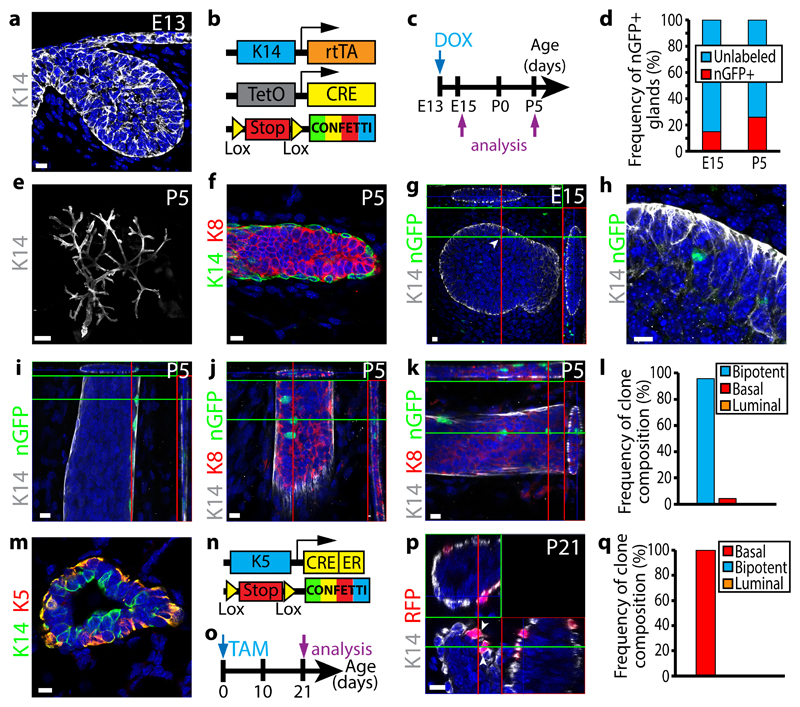
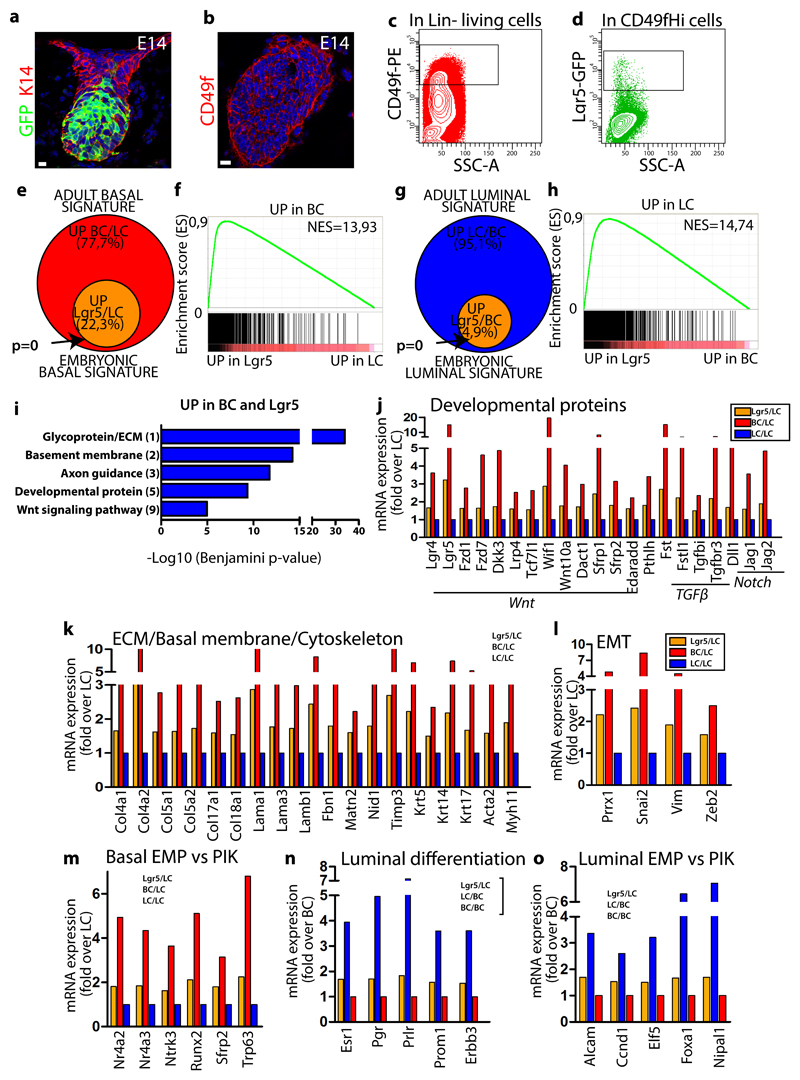
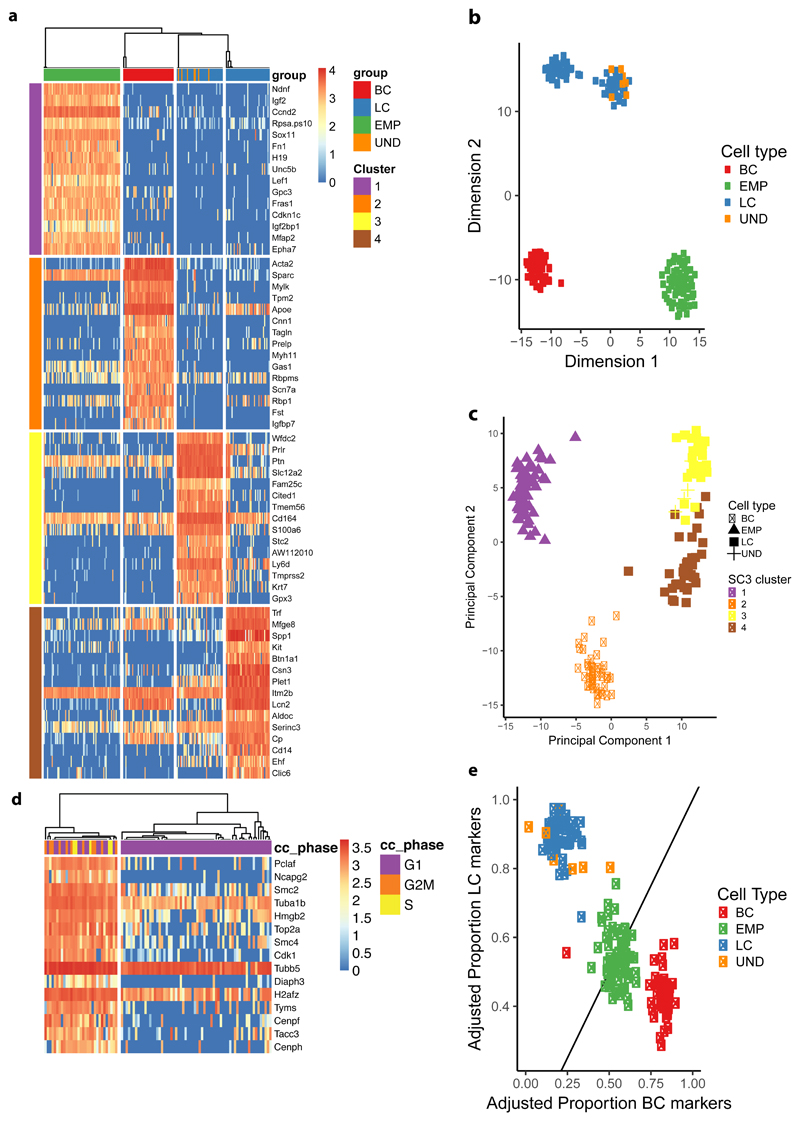
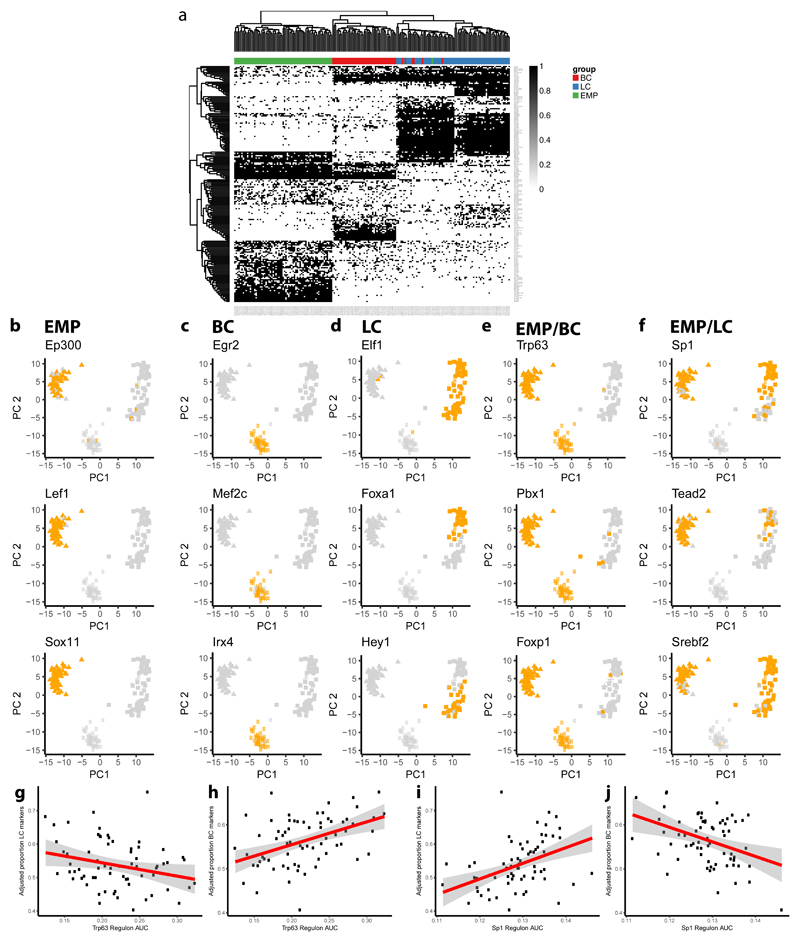
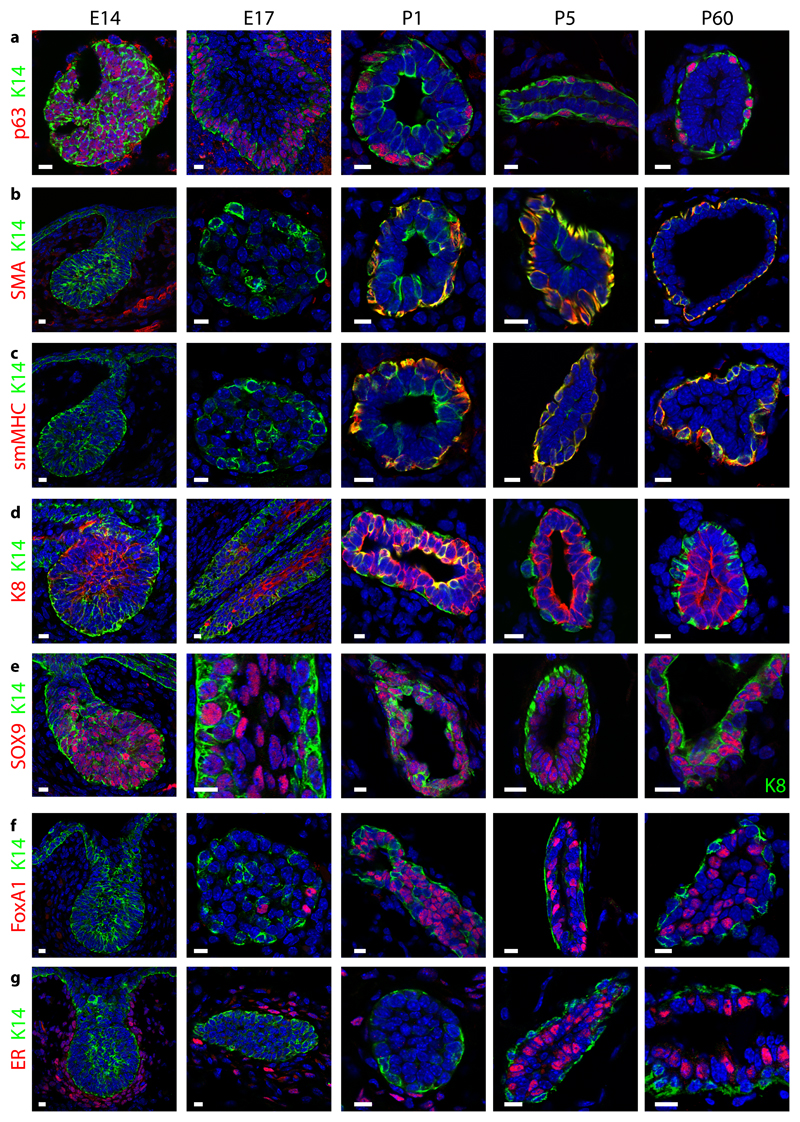
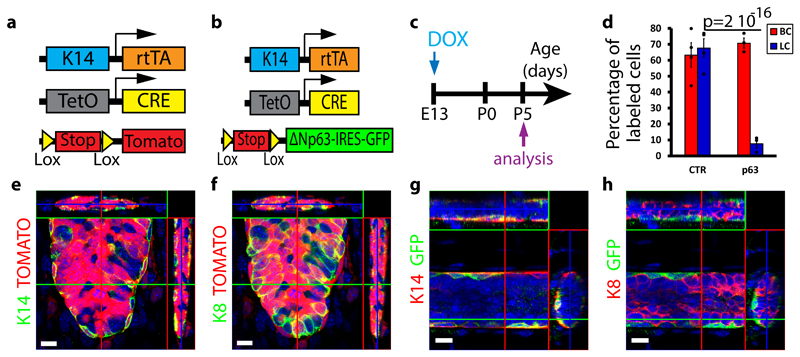
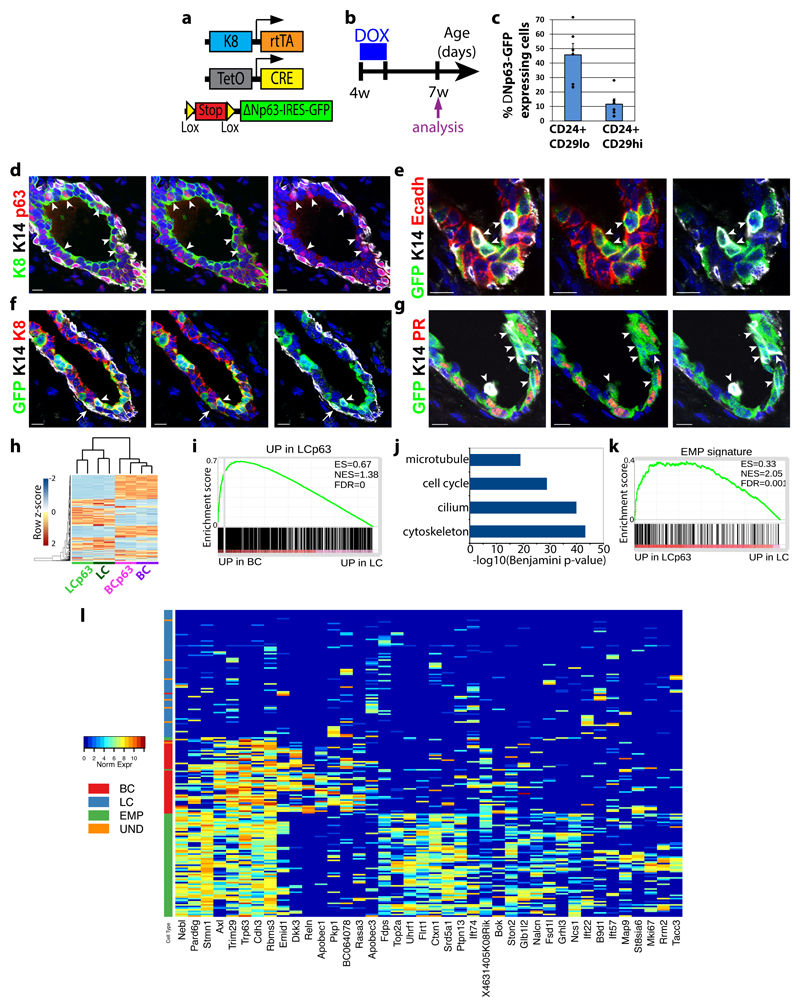
The mammary gland is composed of basal cells and luminal cells. It is generally believed that the mammary gland arises from embryonic multipotent progenitors, but it remains unclear when lineage restriction occurs and what mechanisms are responsible for the switch from multipotency to unipotency during its morphogenesis. Here, we perform multicolour lineage tracing and assess the fate of single progenitors, and demonstrate the existence of a developmental switch from multipotency to unipotency during embryonic mammary gland development. Molecular profiling and single cell RNA-seq revealed that embryonic multipotent progenitors express a unique hybrid basal and luminal signature and the factors associated with the different lineages. Sustained p63 expression in embryonic multipotent progenitors promotes unipotent basal cell fate and was sufficient to reprogram adult luminal cells into basal cells by promoting an intermediate hybrid multipotent-like state. Altogether, this study identifies the timing and the mechanisms mediating early lineage segregation of multipotent progenitors during mammary gland development.


Conflict of interest statement

Financial and Non-Financial Competing Interests

The authors declare to have no financial and non-financial competing interests.

Figures

Figure 1
Figure 1. Clonal analysis demonstrates the switch from multipotency to unipotency during MG development
a, Confocal imaging of immunostaining of K14 in embryonic MG (E13) (8 embryos). b, Genetic strategy used to target Confetti expression in K14-expressing cells. c, Protocol used to study the fate of cells targeted during embryogenesis. d, Graph representing the fraction of glands containing nGFP+ cells at E15 (n= 73 from 8 embryos) and P5 (n=85 from 13 mice). e-f, Confocal imaging of immunostaining of K14 in P5 postnatal MG at low magnification (e) and of K14 and K8 in P5 postnatal MG (f) (85 glands from 13 mice). g-h, Confocal imaging of immunostaining of K14 and nGFP in E15 K14rtTA/TetO-Cre/Rosa-Confetti embryo induced at E13 with 1μg/g of DOX shows clonal induction in mammary buds (arrow) (g) and zoom onto the labelled cell (h) (73 glands from 8 embryos). i-k, Confocal imaging of immunostaining of K14, nGFP and/or K8 in P5 K14rtTA/TetO-Cre/Rosa-Confetti glands induced at E13 with 1μg/g of DOX shows the presence of isolated BCs (i), isolated LCs (j) and adjacent BCs and LCs (k) (85 glands from 13 mice). l, Graph representing the frequency of nGFP clone composition observed in P5 K14rtTA/TetO-Cre/Rosa-Confetti mice induced at E13 with 1μg/g of DOX (n=85 gland from 13 mice). m, Confocal imaging of immunostaining of K14 and K5 in P5 MG (3 mice). n, Genetic strategy used to target Confetti expression in K5-expressing cells. o, Protocol used to study the fate of cells targeted at birth. p, Confocal imaging of immunostaining of K14 and nGFP in P21 K5CreER/Rosa-Confetti mice induced at birth with 50μg of TAM (12 glands from 3 mice). q, Graph representing the frequency of clone composition observed in P21 K5CreER/Rosa-Confetti mice induced at birth with 50μg of TAM (n=36 clones from 12 glands from 3 mice). g, i, j, k, p represent orthogonal projections of 3D stacks. Scale bars, 10 μm, except E : 500μm. Arrowheads represent labelled nGFP cells at E15 (g) and labelled BCs at P21 (p). See Supplementary Table1 for source data related to d, l and q.
Figure 2
Figure 2. Transcriptional profiling of EMPs reveals their compound basal and luminal gene signature
a-b, Confocal imaging of immunostaining of K14 and GFP in Lgr5-IRES-GFP embryo at E14 (a) and of CD49f in wild type E14 embryo (b) (5 embryos analysed). c-d, FACS analysis of CD49f and GFP expression in Lin- epithelial cells (c) and Lin-CD49fHi mammary cells (d) in E14 Lgr5-GFP embryos (5 embryos analysed). e, Venn diagram showing the overlap between the genes upregulated by 1.5 fold in BCs compared to LCs (adult basal signature) and in Lgr5 cells compared to LCs (embryonic basal signature). f, GSEA of the upregulated genes in BCs (vs LCs) with the genes upregulated in Lgr5 cells (vs LCs), showing the enrichment of the basal signature in Lgr5 cells. g, Venn diagram showing the overlap between the genes upregulated in LCs compared to BCs (adult luminal signature) and in Lgr5 cells compared to BCs (embryonic luminal signature). h, GSEA of the upregulated genes in LCs (vs BCs) with the genes upregulated in Lgr5 cells (vs BCs), showing the enrichment of the LC signature in Lgr5 cells. i, Gene ontology (GO) analysis of genes upregulated >1.5-fold in both BCs and Lgr5 cells compared to LCs. Histograms represent –log10 of Benjamini score. j-m, Graph representing mRNA expression measured by microarray analysis of upregulated genes in FACS-isolated BCs and Lgr5 cells (fold over LC), showing the transcriptional priming of BC genes in Lgr5 cells. n-o, Graph representing mRNA expression measured by microarray analysis of upregulated genes in FACS-isolated LCs and Lgr5 cells (fold over BC), showing the transcriptional priming of LC genes in Lgr5 cells. Analysis presented in e-o are derived from the fold change ratio of the mean of Lgr5 microarray data (n=3) over the mean of BC (n=2) or LC (n=2) microarray data. Enrichment P-value in e, g derived from hypergeometric test performed with R software without adjustment (n= 2958 and 3999 genes respectively for BC/LC and LC/BC signatures). Scale bars, 10 μm.
Figure 3
Figure 3. Single cell RNA-seq shows the EMP hybrid gene signature
a, Unsupervised clustering using SC3 on EMPs (n=68), adult BC (n=45) and LCs (n=73) using clustering parameter k=4. Heatmaps of the top 15 marker genes for each cluster and their corresponding normalized expression are displayed (AUC > 0.8 and Wilcoxon signed rank test FDR adjusted p-value < 0.01). Columns represent single cells, colour-coded by their respective lineage. UND (undetermined significance) represents few FACS isolated CD29HiCD24+ cells with LC gene signature, which probably represent errors during cell sorting. b-c, Dimensionality reduction using t-Distributed Stochastic Neighbor Embedding (b) and Principal Component Analysis (c), every dot (n=193) represents one cell with the colour representing either cell-type or the assigned SC3 cluster represented in (a) respectively. d, SC3 clustering of EMPs (n=68) using clustering parameter k=2. Heatmap of top 15 marker genes for each cluster and their corresponding normalized expression are displayed (AUC > 0.9 and Wilcoxon signed rank test FDR adjusted p-value < 0.01). Columns represent single cells, colour-coded by their assigned cell-cycle phase. e, Scatter plot with the X-axis representing the adjusted proportion of BC-specific marker genes detected by SC3 (n=53) and the Y-axis LC-specific marker genes (n=47). Marker genes were selected to be expressed in at least 75% of the respective cell type and in less than 50% of the opposite cell type. The proportion of expressed markers is computed as the fraction of markers with > 0 expression over the total number of markers. Every dot (n=193) represents one cell and are colour-coded according to cell type.
Figure 4
Figure 4. SCENIC analysis of EMP, LC and BC scRNA-seq data.
a, Binary activity matrix for regulons inferred by SCENIC: Regulons were determined to be active (black) if they exceeded a manually adjusted AUC regulon-specific threshold or inactive under this threshold (white). Columns represent cells (n=193) colour-coded by cell type, rows represent regulons. Hierarchical clustering is performed and clusters of regulons can be observed specific for each cell population but also shared between the different cell populations. Only regulons with an absolute correlation with any other regulon > 0.3 and at least active in 1% of cells are shown. b-f, PCA plots showing the binary activity of regulons inferred by SCENIC: PCA was performed on scRNAseq data on the normalized expression values of top 500 most variable genes. Every dot (n=193) represents a single cell whereas the activity of the respective regulon is colour-coded as active (orange) or inactive (light grey) for each cell. Examples of regulons are grouped by their respective populations: only active in EMPs (b), only active in BCs (c), only active in LCs (d), active in both EMPs and BCs but not active in LCs (e), active in both EMPs and BCs but not in LCs (f). g-j, Scatter plots depicting the linear relationship in the EMP population (n=68) between regulon activity and the adjusted proportion of specific LC (g, i) and BC markers (h, j) for Trp63 (g, h) and Sp1 regulons (i, j). Regulon activity is measured as the regulon AUC which is a function of the number of inferred target genes of that regulon being expressed (0 meaning no genes, and 1 meaning all genes being expressed). The red line represents a linear model fitted using the lm function in R, the grey area represents the 95% confidence interval.
Figure 5
Figure 5. Asymmetrical expression of basal and luminal markers marks the early step of MG lineage segregation
Confocal imaging of immunostaining of K14 and p63 (a), SMA (b), smMHC (c), K8 (d), Sox9 (e), FoxA1 (f) and ER (g) in E14, E17, P1, P5 and P60 MG shows the temporality of cellular heterogeneity during MG development (except in e where the MG at P60 is represented with K8 staining). Representative images from 3 independent mice analysed per time point. Scale bars, 10 μm.
Figure 6
Figure 6. p63 promotes unipotent BC fate in EMPs
a-b, Scheme summarizing the genetic strategy used to target tdTomato (a) or ΔNp63-IRES-GFP (b) expression in K14-expressing cells at E13. c, Scheme summarizing the protocol used to study the fate of cells targeted during embryogenesis using K14rtTA/TetO-Cre/Rosa-tdTomato or Rosa-ΔNp63-IRES-GFP mice. d, Graph representing the mean percentage of labelled BCs and LCs in control versus p63-overexpressing mice. Respectively n=4 and n=3 independent mice were analysed in K14rtTA/TetO-Cre/Rosa-tdTomato and in Rosa-ΔNp63-IRES-GFP mice. Individual data points are represented as dots. Error bars, s.e.m. P-value derived from Fisher exact test without adjustment. See Supplementary Table 1 for source data related to d. e-f, Confocal imaging of immunostaining of K14 (e) or K8 (f) and Tomato in K14rtTA/TetO-Cre/Rosa-tdTomato mice induced at E13 with 15μg/g of DOX. Representative images from 4 mice analysed. g-h, Confocal imaging of immunostaining of K14 (g) or K8 (h) and GFP in K14rtTA/TetO-Cre/Rosa-ΔNp63-IRES-GFP mice induced at E13 with 15μg/g of DOX. Representative images from 3 mice analysed. e-h represent orthogonal projections of 3D stacks. Scale bars, 10 μm.
Figure 7
Figure 7. In vivo reprogramming of adult LC into BC by p63
a, Genetic strategy to target ΔNp63-IRES-GFP expression in LCs. b, Protocol used to study the fate of cells targeted using K8rtTA/TetO-Cre/Rosa-ΔNp63-IRES-GFP mice. c, Percentage of GFP-labelled LCs (CD24+ CD29lo) and newly formed BCs (CD24+ CD29Hi) following expression of ΔNp63-IRES-GFP in adult LCs (n=6 mice) (mean + sem). Dots, individual data points. See Supplementary Table 1 for source data. d-g, Immunofluorescence of p63, K14 and K8 (d), GFP, K14 and Ecadh (e), GFP, K14 and K8 (f) and GFP, K14 and PR (g) 2 weeks following p63-IRES-GFP expression in LCs. Representative images from 6 mice. h, Heatmap representing the similarities between the different BC (CD24+ CD29Hi) and LC populations (CD24+ CD29lo) populations (n=2 RNAseq datafor each population). The top 500 most variable genes across the 8 samples are plotted in the heatmap. The dendrogram shows hierarchical gene expression clustering of BCs and LCs with or without p63 overexpression. Blue and red correspond to low and high expressed genes, respectively. The two major branches of the tree perfectly discriminate between LCs and BCs and between WT and ΔNp63 cells. i, GSEA of the genes upregulated by p63 in LCs (vs WT LCs) with upregulated genes in BCs (vs LCs), showing the enrichment of basal genes in p63 upregulated genes in LCs. j, Bar chart of Benjamini corrected enrichment p-value of the first four functional annotation clusters for the 902 genes overexpressed in ΔNp63 expressing LC compared to WT LCs. k, GSEA of the upregulated genes in EMPs (vs LCs) with the genes upregulated by p63 in LCs (vs WT LCs), showing the enrichment of the EMP signature in p63 upregulated genes in LCs. l, Heatmap representing genes overexpressed in ΔNp63 expressing LC bulk RNA-seq data. The top 200 overexpressed genes are chosen and the 40 genes with the highest variance amongst the single cells are plotted in the heatmap. Columns represent single cells colour-coded by cell type. Colours in the heatmap represent normalized expression values. RNA-seq analysis in i-k are derived from the means of two RNAseq datasets per condition.

References

    1. Watson CJ, Khaled WT. Mammary development in the embryo and adult: a journey of morphogenesis and commitment. Development. 2008;135:995–1003. - PubMed
    1. de Visser KE, et al. Developmental stage-specific contribution of LGR5(+) cells to basal and luminal epithelial lineages in the postnatal mammary gland. J Pathol. 2012;228:300–309. - PubMed
    1. Lafkas D, et al. Notch3 marks clonogenic mammary luminal progenitor cells in vivo. J Cell Biol. 2013;203:47–56. - PMC - PubMed
    1. Prater MD, et al. Mammary stem cells have myoepithelial cell properties. Nat Cell Biol. 2014;16:942–950. 941–947. - PMC - PubMed
    1. Rodilla V, et al. Luminal progenitors restrict their lineage potential during mammary gland development. PLoS Biol. 2015;13:e1002069. - PMC - PubMed

Publication types

MeSH terms