. 2018 May 21;9(1):2000.
doi: 10.1038/s41467-018-04380-9.

Multiple convergent supergene evolution events in mating-type chromosomes

Affiliations

Multiple convergent supergene evolution events in mating-type chromosomes

Sara Branco et al. Nat Commun. .

Abstract

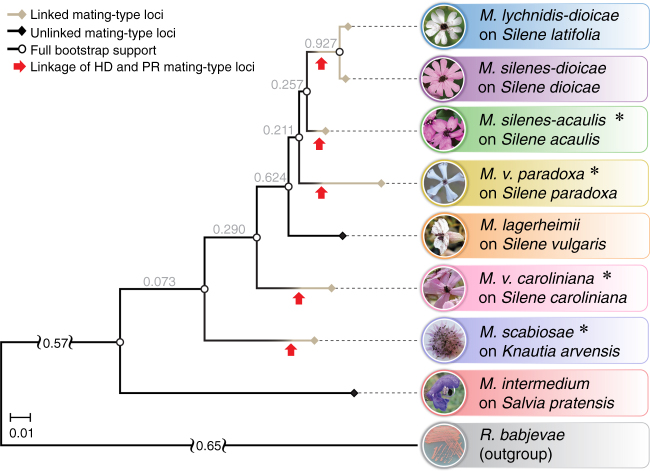
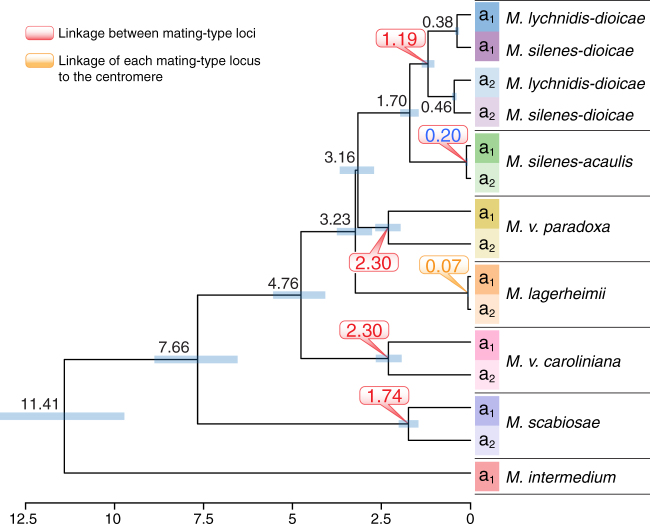
Convergent adaptation provides unique insights into the predictability of evolution and ultimately into processes of biological diversification. Supergenes (beneficial gene linkage) are striking examples of adaptation, but little is known about their prevalence or evolution. A recent study on anther-smut fungi documented supergene formation by rearrangements linking two key mating-type loci, controlling pre- and post-mating compatibility. Here further high-quality genome assemblies reveal four additional independent cases of chromosomal rearrangements leading to regions of suppressed recombination linking these mating-type loci in closely related species. Such convergent transitions in genomic architecture of mating-type determination indicate strong selection favoring linkage of mating-type loci into cosegregating supergenes. We find independent evolutionary strata (stepwise recombination suppression) in several species, with extensive rearrangements, gene losses, and transposable element accumulation. We thus show remarkable convergence in mating-type chromosome evolution, recurrent supergene formation, and repeated evolution of similar phenotypes through different genomic changes.


Conflict of interest statement

The authors declare no competing interests.

Figures

Fig. 1
Fig. 1
Phylogenies of anther-smut fungi and their breeding systems. Phylogenetic tree of the studied Microbotryum species (shown in the anthers of their host plants) and the outgroup Rhodotorula babjevae, based on 4229 orthologous genes. Species whose genomes were obtained in the present study are indicated by asterisks. Branch color and symbol indicate linked (gray branches and diamonds) or unlinked (black branches and diamonds) mating-type loci. The white circles indicate full bootstrap support. Red arrows indicate independent mating-type locus linkage events. Tree internode certainty with no conflict bipartitions (the normalized frequency of the most frequent bipartition across gene genealogies relative to the summed frequencies of the two most frequent bipartitions) is provided below the branches, indicating good support for the nodes. Relative certainty for this tree is 0.397
Fig. 2
Fig. 2
Routes of mating-type chromosome evolution in Microbotryum. Model for mating-type chromosomal rearrangement events, as inferred from comparisons with the two mating-type chromosomes of M. lagerheimii (used as a proxy for the ancestral mating-type chromosomes in the genus). Mating-type chromosome content across Microbotryum species is illustrated by colors referring to different parts of the two M. lagerheimii mating-type chromosomes (Supplementary Figs. 5–8). The inferred ancestral locations of putative centromeres and mating-type loci are indicated in yellow and black, respectively, and the regions of suppressed recombination are dashed. Chromosome sizes are indicated by their relative scales; the last stage in the evolution of recombination suppression often involves increases in chromosome size due to the accumulation of repetitive elements. Mating-type chromosome evolution in a M. lychnidis-dioicae, b M. silenes-acaulis, c M. violaceum caroliniana, d M. scabiosae, and e M. v. paradoxa, in which the top edge of the mating-type chromosome corresponds to a rearrangement from the middle of the chromosome, supporting complete recombination suppression up to the end of the chromosome
Fig. 3
Fig. 3
Divergence between a1- and a2-associated alleles. Per-gene synonymous divergence and standard error (dS ± SE) between alleles associated with the a1 and a2 mating types within Microbotryum diploid individuals, following the ancestral gene order for the mating-type chromosome. Synonymous divergence is plotted against the genomic coordinates of the a1 mating-type chromosomes of M. lagerheimii for all single-copy genes common to both mating-type chromosomes. The limits of the PR and HD M. lagerheimii mating-type chromosomes are indicated and oriented according to the fusion in each species (i.e., not in the same orientation in all species). Divergence between the a1 and a2 pheromone receptor (PR) genes was too extensive and dS could not be calculated (depicted as “Un” for unalignable). The yellow boxes indicate the positions of M. lagerheimii putative centromeres. The red vertical arrows at the bottom indicate the 17 genes used for inferring HD–PR linkage dates in all species except for M. silenes-acaulis, for which we used a restricted set of 13 genes ancestrally located between the HD locus and the putative centromere (blue vertical arrows). Ancient evolutionary strata that evolved at the base of the Microbotryum clade are indicated in purple (around PR) and blue (around HD), as in the previous study in which they were discovered. The genes involved in the more recent evolutionary strata previously identified in M. lychnidis-dioicae are indicated with red and green bars at the bottom. a M. silenes-acaulis; b M. v. caroliniana, with a recent stratum indicated in light blue and enlarged in an inset; the current location of these genes is indicated in Supplementary Fig. 6a; c M. scabiosae; d M. v. paradoxa, with recent strata depicted in pink and white (the current location of these genes is indicated in Supplementary Fig. 8a). The light blue bar at the bottom indicates the genes involved in the young evolutionary stratum of M. v. caroliniana
Fig. 4
Fig. 4
Dates of mating-type loci linkage. Reconstructed phylogenetic tree based on 17 concatenated genes ancestrally located between the mating-type loci after chromosomal fusion in all the studied species with linked mating-type loci but M. silenes-acaulis and including alleles from both a1 and a2 genomes. Numbers on tree nodes indicate the inferred dates of speciation (in black) and the events of mating-type loci linkage, either one to each other or to their respective putative centromeres (in red and orange, respectively). The blue bars correspond to 95% confidence intervals. The scale at the bottom indicates the time before present (million years). None of the individual genes showed trans-specific polymorphism, except between the sister species M. lychnidis-dioicae and M. silenes-dioicae (Supplementary Fig. 3). We used a restricted set of 13 genes (Fig. 3) for estimating the M. silene-acaulis mating-type loci linkage because not all 17 genes were located in its non-recombining region
Fig. 5
Fig. 5
Differential degeneration across strata and species. We quantified the TE content and gene loss in genomes of both mating types (a1 and a2) of all species under study. For each species, we measured the TE accumulation separately for one fully assembled autosome (as a control), recombining regions (RR), and non-recombining regions (NRR) on mating-type chromosomes (MAT), separating the youngest evolutionary strata (light blue, red, green pink, and white strata) from the remaining of the NRR where applicable. Strata were ordered from the youngest to the oldest per species. In M. lagerheimii, the NRRs correspond to the regions between the mating-type loci and the putative centromeres, while in the other species they mostly correspond to the regions ancestrally between the HD and PR loci. The purple and blue strata were too rearranged within the large non-recombining region to quantify their specific gene loss or TE content except in M. lagerheimii. a Transposable element (TE) content (percent of base pairs); b Gene loss (genes with an allele present in the genome of one mating type but absent from the genome of the opposite mating type). Numbers at the top of the bars indicate the numbers of genes missing in the a2 mating-type chromosome, present only in the a1 mating-type chromosome

References

    1. Gould, S. Wonderful Life - The Burgess Shale and the Nature of History (Norton, New York, 1989).
    1. Wake DB, Wake MH, Specht CD. Homoplasy: from detecting pattern to determining process and mechanism of evolution. Science. 2011;331:1032–1035. doi: 10.1126/science.1188545. - DOI - PubMed
    1. Stern DL, Orgogozo V. Is genetic evolution predictable? Science. 2009;323:746–751. doi: 10.1126/science.1158997. - DOI - PMC - PubMed
    1. Elmer KR, Meyer A. Adaptation in the age of ecological genomics: insights from parallelism and convergence. Trends Ecol. Evol. 2011;26:298–306. doi: 10.1016/j.tree.2011.02.008. - DOI - PubMed
    1. Elmer KR, et al. Parallel evolution of Nicaraguan crater lake cichlid fishes via non-parallel routes. Nat. Commun. 2014;5:5168. doi: 10.1038/ncomms6168. - DOI - PubMed

Publication types

LinkOut - more resources