. 2018 Jun;50(6):825-833.
doi: 10.1038/s41588-018-0129-5. Epub 2018 May 21.

Genetic identification of brain cell types underlying schizophrenia

Affiliations

Genetic identification of brain cell types underlying schizophrenia

Nathan G Skene et al. Nat Genet. 2018 Jun.

Abstract

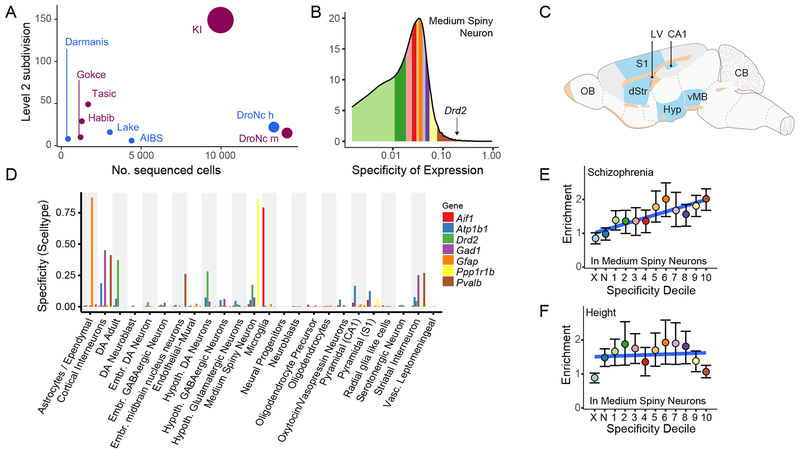
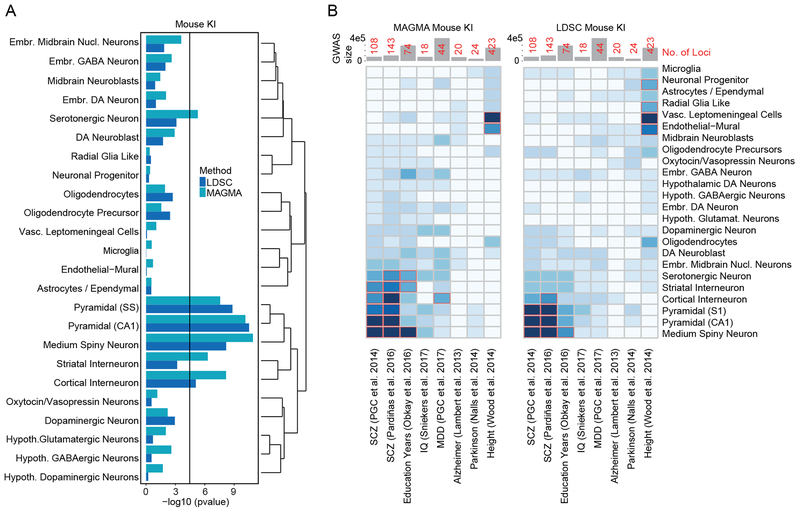
With few exceptions, the marked advances in knowledge about the genetic basis of schizophrenia have not converged on findings that can be confidently used for precise experimental modeling. By applying knowledge of the cellular taxonomy of the brain from single-cell RNA sequencing, we evaluated whether the genomic loci implicated in schizophrenia map onto specific brain cell types. We found that the common-variant genomic results consistently mapped to pyramidal cells, medium spiny neurons (MSNs) and certain interneurons, but far less consistently to embryonic, progenitor or glial cells. These enrichments were due to sets of genes that were specifically expressed in each of these cell types. We also found that many of the diverse gene sets previously associated with schizophrenia (genes involved in synaptic function, those encoding mRNAs that interact with FMRP, antipsychotic targets, etc.) generally implicated the same brain cell types. Our results suggest a parsimonious explanation: the common-variant genetic results for schizophrenia point at a limited set of neurons, and the gene sets point to the same cells. The genetic risk associated with MSNs did not overlap with that of glutamatergic pyramidal cells and interneurons, suggesting that different cell types have biologically distinct roles in schizophrenia.


Conflict of interest statement

Conflicts of Interest

The authors reports the following potentially competing financial interests. PF Sullivan: Lundbeck (advisory committee), Pfizer (Scientific Advisory Board member), and Roche (grant recipient, speaker reimbursement). J Hjerling-Leffler: Cartana (Scientific Adviser) and Roche (grant recipient).

Figures

Figure 1.
Figure 1.. Specificity metric calculated from single cell transcriptome sequencing data can be used to test for increased burden of schizophrenia SNP-heritability in brain cell types.
(A) Comparison of Level 2 cell type categories and number of cells with snRNAseq or scRNAseq from adult brain tissue. Plum colored circles are mouse studies and blue are human studies. The number of different tissues is reflected in size of circle. See Supplementary Table 2 for citations. AIBS=Allen Institute for Brain Science. KI=Karolinska Institutet. (B) Histogram of specificity metric (SMSN,KI) for medium spiny neurons from the KI superset level 1. Colored regions indicate deciles (the brown region contains the genes most specific to MSNs). Specificity value for dopamine receptor D2 (Drd2, SMSN,KI,Drd2=0.17) is indicated by the arrow. (C) Schematic highlighting the brain regions sampled in the KI dataset in blue (D) Specificity values in the KI level 1 dataset for a range of known cell type markers. (E) Enrichment of schizophrenia SNP-heritability in each of the specificity deciles for medium spiny neurons (calculated using LDSC). Color of dots corresponds to regions of the specificity matrix in B. Error bars indicate the 95% confidence intervals. The light blue dot (marked ‘X’) represents all SNPs which map onto named transcripts which are not MGI annotated genes or which map onto a gene which does not have a 1:1 mouse:human homolog. The dark blue dot (marked ‘N’) represents all SNPs which map onto genes not expressed in MSNs. Blue line slows the linear regression slope fitted to the enrichment values. (F) Enrichment of height SNP-heritability in each of the specificity deciles for MSNs.
Figure 2.
Figure 2.. Evaluation of enrichment of common variant CLOZUK schizophrenia GWA results in the KI brain scRNAseq dataset from mouse.
(A) KI Level 1 brain cell types. Both LDSC and MAGMA show enrichment for pyramidal neurons (somatosensory cortex and hippocampus CA1), striatal medium spiny neurons, and cortical interneurons. The black line is the Bonferroni significance threshold (0.05/((24+149)*8). (B) Heat map of association pvalues of diverse human GWA with KI Level 1 mouse brain cell types using MAGMA (left panel) and LDSC (right panel). Bonferroni significant results are marked with red borders (0.05/((24+149)*8). Total number of cases and controls used in the GWAS are shown in the top bar plots, where numbers in red indicate the amount of genome-wide significant loci identified. The CLOZUK results do not generalize indiscriminately across human diseases/traits. In the more sensitive MAGMA analysis major depressive disorder (MDD) is primarily enriched in cortical interneurons and embryonic midbrain neurons, unlike schizophrenia. Similar but non-significant trends can be observed using LDSC.
Figure 3.
Figure 3.. Comparison of single-cell and single-nuclei RNAseq, and evaluation of enrichment of common variant CLOZUK schizophrenia GWA results in brain single-nuclei RNAseq datasets from adult human.
(A) Each bar represents a comparison between two datasets (X vs Y), with the bootstrapped Z-scores representing the extent to which dendritically enriched transcripts have lower specificity for pyramidal neurons in dataset Y relative to X. Larger Z-scores indicate greater depletion of dendritically enriched transcripts, and red bars indicate a statistically significant depletion. Supplementary Table 2 describes the studies. (B) Human mid-temporal cortex brain cell type enrichment. Cortical pyramidal neurons and cortical interneurons show significant enrichment. Oligodendrocyte precursors also show enrichment that was not observed in the KI Level 1 data. The black line is the Bonferroni significance threshold (6×8 comparisons). (C) Human prefrontal cortex and hippocampus brain cell type enrichments from. These data show enrichment in cortical and hippocampal glutamatergic (i.e., pyramidal and granule) cells. There is also an enrichment in cortical interneurons with the highest level in Reln/Vip cells. The black line is the Bonferroni significance threshold (15×8 comparisons). (D) Heat map of enrichment of diverse human GWA studies with human mid-temporal cortex Level 1 brain cell types using MAGMA and LDSC. The CLOZUK results do not generalize across human diseases. MDD again shows significant enrichments in cortical interneurons. Common variant genetic associations for Alzheimer’s disease were enriched in microglia. Bonferroni significant results are marked with red borders.
Figure 4.
Figure 4.. Cell type enrichment of gene sets associated with schizophrenia, neurological disorders, and the evolutionary divergence between human and mouse.
(A) Antipsychotic medication targets. (B-F) Gene sets previously shown to be enriched for schizophrenia SNP-heritability. (B) Genes intolerant to loss-of-function variation. (C) Synaptic gene sets. (D) Gene sets mediating DNA or RNA interactions. (E) Gene sets associated with neurological disorders. (F) The top 500 genes with lowest or highest dN/dS ratios between human and mouse (i.e., non-synonymous to synonymous exon changes). The Level 1 cell types associated with schizophrenia (MSNs, pyramidal CA1, pyramidal SS, and cortical interneurons) show enrichment in A-D but neurological diseases do not. Asterisks denote Benjamini–Hochberg corrected p-value <0.05 calculated using EWCE.
Figure 5.
Figure 5.. CA1 pyramidal neurons, medium spiny neurons, and cortical Interneurons are independently associated with schizophrenia and distinct molecular pathways contribute to each cell type.
(A) Conditional enrichment analysis accounting for correlated gene expression between cell types. The left column shows baseline cell type enrichment probabilities values for schizophrenia calculated by fitting a linear model to specificity deciles against MAGMA gene enrichment Z-scores. The central four columns show the enrichment probabilities calculated using bootstrapping to control for correlated expression in other cell types; these probabilities approaching zero indicate that after accounting for expression of the other cell type, there is no enrichment remaining. The red box highlights that there is no longer enrichment in somatosensory pyramidal neurons after accounting for expression in CA1 pyramidal neurons; however, the converse is not true. The bar plot on the right shows the minimum value of the conditional probabilities (excluding self-self-comparisons). (B) Overlap of genes in the schizophrenia-associated cell types. Venn-diagram of the top 1,000 schizophrenia-associated genes from the highest enrichment-deciles in the four Level 1 cell types. (C) Benjamini-Hochberg corrected p-values for hypergeometric enrichment of genes in Figure 5b. We note enrichment for Rbfox in CA1 pyramidal cells, Mir137 targets and dopamine signaling in MSNs, along with shared synaptic genes between pyramidal cells but separate for GABAergic cells. Areas with striped shading indicates region with gene number <10.

Similar articles

Cited by

References

    1. Sullivan PF, Daly MJ & O’Donovan M Genetic architectures of psychiatric disorders: the emerging picture and its implications. Nature Reviews Genetics 13, 537–51 (2012). - PMC - PubMed
    1. Purcell SM et al. A polygenic burden of rare disruptive mutations in schizophrenia. Nature 506, 185–90 (2014). - PMC - PubMed
    1. Schizophrenia Working Group of the Psychiatric Genomics Consortium. Biological insights from 108 schizophrenia-associated genetic loci. Nature 511, 421–7 (2014). - PMC - PubMed
    1. Fromer M et al. De novo mutations in schizophrenia implicate synaptic networks. Nature 506, 179–84 (2014). - PMC - PubMed
    1. Genovese G et al. Increased burden of ultra-rare protein-altering variants among 4,877 individuals with schizophrenia. Nature Neuroscience 19, 1433–1441 (2016). - PMC - PubMed

Publication types