. 2018 Jun;24(6):823-833.
doi: 10.1038/s41591-018-0020-z. Epub 2018 May 21.

Targeting skeletal endothelium to ameliorate bone loss

Affiliations

Targeting skeletal endothelium to ameliorate bone loss

Ren Xu et al. Nat Med. 2018 Jun.

Abstract

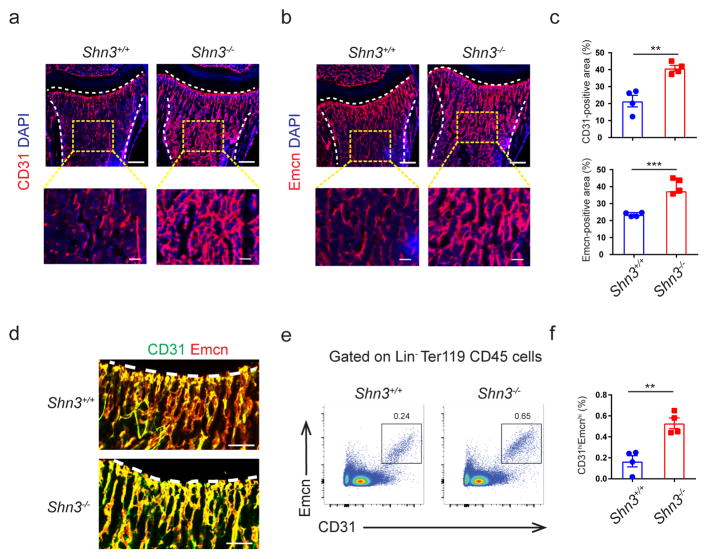
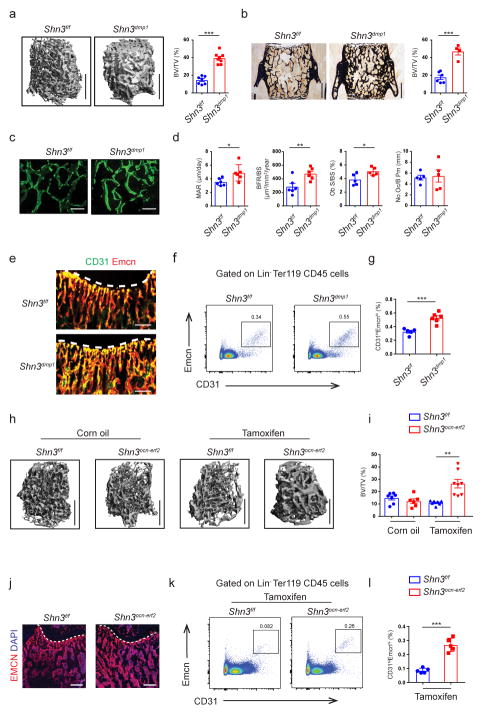
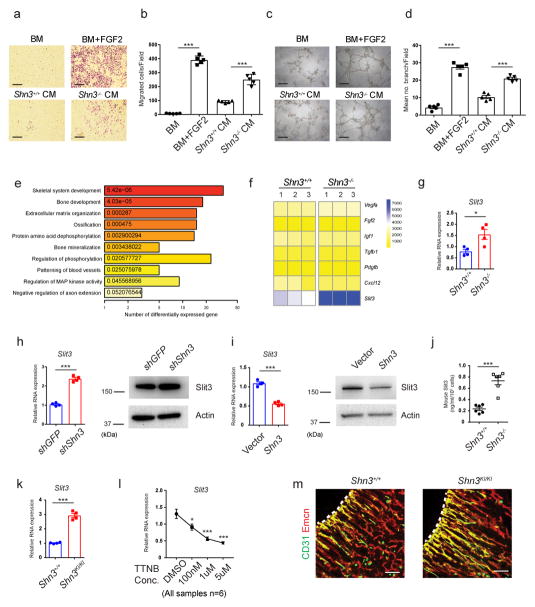
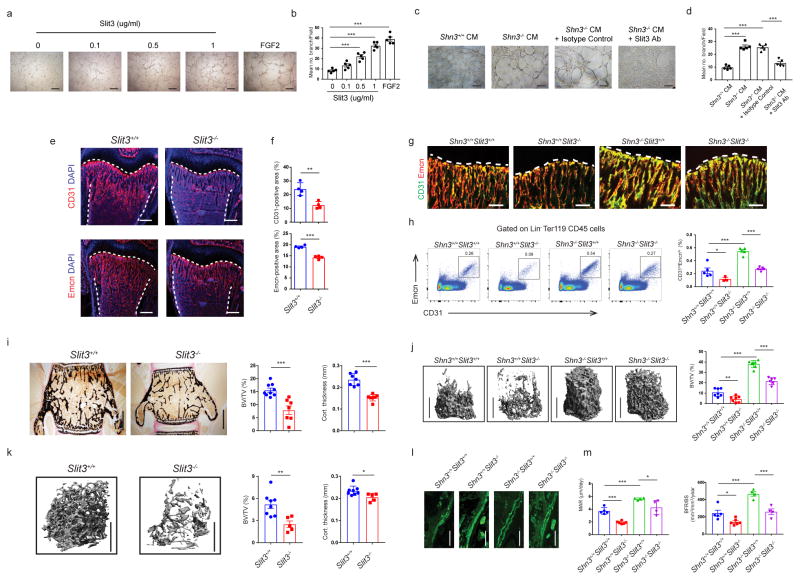
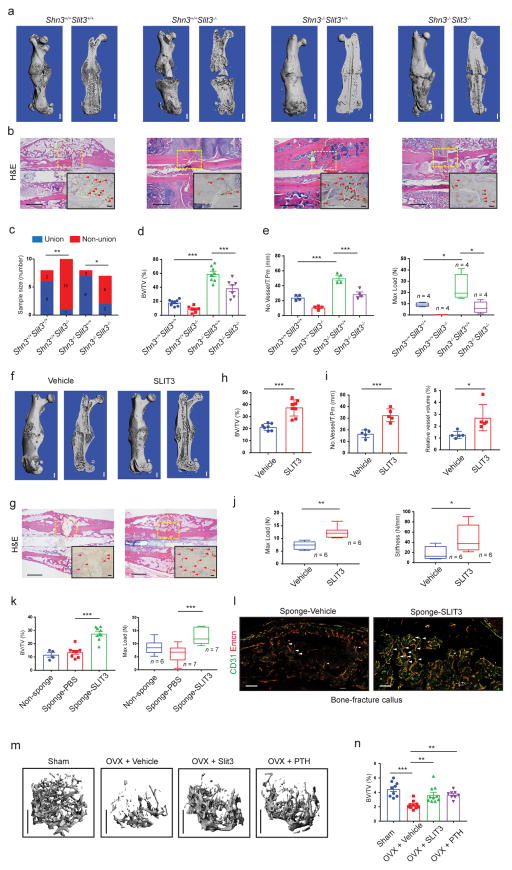
Recent studies have identified a specialized subset of CD31hiendomucinhi (CD31hiEMCNhi) vascular endothelium that positively regulates bone formation. However, it remains unclear how CD31hiEMCNhi endothelium levels are coupled to anabolic bone formation. Mice with an osteoblast-specific deletion of Shn3, which have markedly elevated bone formation, demonstrated an increase in CD31hiEMCNhi endothelium. Transcriptomic analysis identified SLIT3 as an osteoblast-derived, SHN3-regulated proangiogenic factor. Genetic deletion of Slit3 reduced skeletal CD31hiEMCNhi endothelium, resulted in low bone mass because of impaired bone formation and partially reversed the high bone mass phenotype of Shn3-/- mice. This coupling between osteoblasts and CD31hiEMCNhi endothelium is essential for bone healing, as shown by defective fracture repair in SLIT3-mutant mice and enhanced fracture repair in SHN3-mutant mice. Finally, administration of recombinant SLIT3 both enhanced bone fracture healing and counteracted bone loss in a mouse model of postmenopausal osteoporosis. Thus, drugs that target the SLIT3 pathway may represent a new approach for vascular-targeted osteoanabolic therapy to treat bone loss.


Conflict of interest statement

Conflicts of Interest

LHG is on the board of directors of and holds equity in the GlaxoSmithKline and Waters Corporations. She is also a founder of Quentis Pharmaceuticals.

Figures

Figure 1
Figure 1
Shn3−/− mice have higher levels of CD31hiEMCNhi endothelium. (a, b) Representative confocal images (n = 4 total images per group) of 2-week-old Shn3+/+ and Shn3−/− male mouse femurs stained with CD31 (a) or Endomucin (EMCN) (b) (red) and 4′,6-diamidino-2-phenylindole (DAPI, blue). Growth plate and cortical bone are marked with a dashed line. Scale bars, 300μm (top) and 50μm (bottom). (c) Quantification of relative CD31-postive (top) and EMCN-positive vessel area (bottom) in the bone marrow (BM) cavity of the femur sections in 2-week-old Shn3+/+ and Shn3−/− male mice (n = 4 per group). (d) Representative images (n = 3 total images per group) of CD31 (green) and EMCN (red) dual immunostained femur sections from the femur in 2-week-old male mice. The growth plate is marked. Scale bars, 100μm. (e, f) Representative flow cytometry plots (e) with quantification (f) of CD31hiEMCNhi endothelial cells from the femurs of 2-week-old Shn3+/+ and Shn3−/− mice (n = 4 per group). Values represent mean ± s.e.m.; **P < 0.01, ***P < 0.001 by an unpaired two-tailed Student’s t-test in all panels.
Figure 2
Figure 2
Ablation of Shn3 in osteoblasts enhances osteogenesis and angiogenesis in vivo. (a) Representative μCT images of the trabecular bone in the distal femur (left) and bone volume/total volume (BV/TV) (right) in Shn3f/f (n = 7) and Shn3dmp1 (n = 8) male mice at 8-weeks of age. Scale bars, 1mm. (b) Representative histomorphometric images of the L3 vertebrae (left) and BV/TV (right) in Shn3f/f (n = 6) and Shn3dmp1 (n = 4) male mice at 8-weeks of age. Scale bars, 500μm. (c, d) Representative images of calcein double labeling (c) and quantification of histomorphometric parameters (d) of the L3 vertebrae in Shn3f/f and Shn3dmp1 male mice at 8-week of age. Trabecular mineral apposition rate (MAR, mm day−1), bone formation rate/bone surface (BFR/BS, mm3 mm−2 yr−1), osteoclast number/bone perimeter (No. Oc./B. Pm) and osteoblast surface/bone surface (Ob.S/BS, %). Scale bars, 300μm. MAR and BFR/BS: n = 6 per group; No. Oc./B. Pm and Ob.S/BS: n = 5 per group. (e) Representative confocal images (n = 3 total images per group) of femur sections from 2-week old Shn3f/f and Shn3dmp1 male mice with EMCN (red) and CD31 (green). Growth plate is marked with a dashed line. Scale bars, 100 μm. (f, g) Representative flow cytometry plots (f) and relative frequency of CD31hiEMCNhi endothelial cells (g) from the femurs of 2-week-old male Shn3dmp1 (n = 6) and Shn3f/f (n = 5) mice. (h, i) Representative μCT images of the trabecular bone in the distal femur metaphysis (h) and relative quantitative analysis of BV/TV (i) in Shn3f/f (oil =7; tamoxifen =7) and Shn3ocn-ert2 male mice (oil =6; tamoxifen =8). Analysis was performed 12-weeks after tamoxifen injection into 4-week old mice. Scale bars, 1mm. (j) Representative confocal images (n = 3 total images per group) of EMCN (red) and DAPI (blue) immunostained femur sections from Shn3f/f and Shn3ocn-ert2 male mice at 4-weeks after tamoxifen injection into 4-week old mice. Growth plate is marked with a dashed line. Scale bars, 300 μm. (k, l) Representative flow cytometry plots (k) and relative frequency of CD31hiEMCNhi endothelial cells (l) from the femurs of Shn3f/f and Shn3ocn-ert2 male mice (n = 5 per group), 6-weeks after tamoxifen injection into 4-weeks old mice. Values represent mean ± s.e.m.; *P < 0.05, **P < 0.01, ***P < 0.001 all by an unpaired two-tailed Student’s t-test or by one-way ANOVA followed by a Dunnett’s test in all panels.
Figure 3
Figure 3
Inhibition of Shn3 enhances Slit3 expression in osteoblasts. (a, b) Representative images (a) and relative quantification (b) of a transwell migration assay of BM-derived endothelial progenitor outgrowth cells (EPOCs). Basal medium, (BM); Conditioned medium, (CM). n = 5 per group. (c, d) Representative images (c) and relative quantification of tube branch numbers (d) of a Matrigel tube formation assay with EPOCs. n = 5 per group. (e) Gene ontology (GO) enrichment analysis of genes differentially expressed in Shn3−/− osteoblasts relative to Shn3+/+ osteoblasts (f) Proangiogenic gene expression in primary Shn3+/+ and Shn3−/− osteoblasts. (g) Real-time PCR of Slit3 expression in Shn3+/+ and Shn3−/− osteoblasts. n = 4 per group. (h) Messenger RNA (mRNA) (left) and protein (right) levels of Slit3 in human mesenchymal stromal cells (hMSCs) expressing a GFP targeting control or Shn3 shRNAs cultured under osteogenic conditions. n = 4 per group. (i) mRNA (left) and protein (right) levels of Slit3 in hMSCs overexpressing a vector control or Shn3 cultured under osteogenic conditions.. n = 4 per group. (j) ELISA for SLIT3 secretion by Shn3+/+ and Shn3−/− osteoblasts. n = 6 per group. (k) Real-time PCR analysis of Slit3 in Shn3+/+ and Shn3KI/KI osteoblasts (n = 4). (l) Real-time PCR analysis of Slit3 in hMSCs treated with trametinib (TTNB). n = 6 per group. (m) Representative confocal images (n = 3 total images per group) of CD31 (green) and EMCN (red) immunostained sections from the femurs of 2-week-old Shn3+/+ and Shn3KI/KI male mice. Growth plate is marked with a dashed line. Scale bars, 100μm. Values represent mean ± s.e.m.; *P < 0.05, **P < 0.01, ***P < 0.001 by an unpaired two-tailed Student’s t-test or one-way ANOVA followed by a Dunnett’s test in all panels. All immunoblots are cropped from the original.
Figure 4
Figure 4
Slit3−/− mice have reduced skeletal vasculature and bone mass in vivo. (a–d) Representative images (a, c) and relative quantification of tube branch numbers (b, d) in a Matrigel tube formation assay with EPOCs. n = 5 per group. Scale bars, 200μm. (c, d) Where indicated, a SLIT3-neutralizing antibody or isotype control was added. Scale bars, 200μm. (e, f) Representative confocal images of CD31 or EMCN (red) and DAPI (blue) immunostained sections (e) and relative quantification (f) of CD31-postive or EMCN-positive vessel area in the BM cavity of the femurs from male Slit3+/+ and Slit3−/− mice at 2-weeks of age. n = 4 per group. Growth plate and cortical bone are marked with a dashed line. Scale bars, 300μm. (g, h) Representative confocal images (n = 3 total images per group) of CD31 (green) and EMCN (red) immunostained bone sections (g) flow cytometry dot plots (h, left), and relative frequency of CD31hiEMCNhi endothelial cells (h, right) of the femur in 2 week-old Shn3+/+ Slit3+/+ (n = 5), Shn3+/+ Slit3−/− (n = 3), Shn3−/− Slit3+/+ (n = 5) and Shn3−/− Slit3−/− mice (n = 5). Growth plate is marked with a dashed line. Scale bars, 100μm. (i) Representative histological images (left) and relative BV/TV (middle) of the L3 vertebrae (Slit3+/+ = 9, Slit3−/− = 7) and cortical thickness (right) of distal femoral metaphyseal regions (Slit3+/+ = 7, Slit3−/− = 6) at 6-weeks of age. Scale bars, 500μm. (j) Representative μCT images of the trabecular bone in the distal femur metaphysis (left) and relative BV/TV analysis of 6 week-old Shn3+/+ Slit3+/+(n = 7), Shn3+/+ Slit3−/−(n = 7), Shn3−/− Slit3+/+(n = 7) and Shn3−/− Slit3−/− mice (n = 6) (right). Scale bar, 1mm. (k) Representative μCT images of the trabecular bone in the distal femur metaphysis (left) and relative trabecular BV/TV analysis (middle) and cortical bone thickness in the femoral midshaft from male Slit3+/+ mice (n = 8) and Slit3−/− mice (n = 5) at 12-weeks of age. Scale bars, 1mm. (l, m) Representative images of calcein labelling (I) and relative histomorphometric quantification of MAR and BFR/BS in 6 week-old Shn3+/+ Slit3+/+(n = 5), Shn3+/+ Slit3−/−(n = 6), Shn3−/− Slit3+/+(n = 4) and Shn3−/− Slit3−/− male mice (n = 4). Scale bars, 100μm. Values represent mean ± s.e.m.; *P < 0.05, **P < 0.01 and ***P < 0.001 by an unpaired two-tailed Student’s t-test or one-way ANOVA followed by a Dunnett’s test in all panels.
Figure 5
Figure 5
Osteoblast derived Slit3 controls osteogenesis and CD31hiEMCNhi endothelium via ROBO1. (a, b) Representative confocal images (n = 3 total images per group) of CD31 (red) and DAPI (blue) (a) or CD31 (green), EMCN (red) and DAPI (blue) (b) stained femur sections in 2 week-old OSX Cre and Slit3osx male mice. Growth plate and cortical bone are marked with a dashed line. Scale bars, 100μm. (c) Representative μCT images of the trabecular bone in the distal femur metaphysis (left) and relative BV/TV analysis (right) of 3 week-old OSX Cre and Slit3osx male mice. Scale bar, 1mm. n = 6 per group. (d) Representative μCT images of the femoral midshaft (left) and relative cortical bone thickness analysis (right) of 3 week-old OSX Cre and Slit3osx male mice. Scale bar, 1mm. n = 6 per group. (e) Representative μCT images of the trabecular bone in the distal femur metaphysis (left) and relative BV/TV analysis in 12 week-old Robo1+/+ (n = 4) and Robo1−/− female mice (n = 5). Scale bars, 1mm. (f) Representative confocal images (n = 3 total images per group) of CD31 (green) and EMCN (red) with DAPI (blue) stained femur sections from 2 week-old Robo1+/+ and Robo1−/− mice. Growth plate is marked with a dashed line. Scale bars, 100μm. Values represent mean ± s.e.m.; *P < 0.05 and ***P < 0.001 by an unpaired two-tailed Student’s t-test in all panels.
Figure 6
Figure 6
Administration of recombinant SLIT3 has therapeutic effects on bone fracture healing and ovariectomy-induced bone loss. (a, b) Representative μCT (a), H&E staining (b) and EMCN immunohistochemistry (IHC) images (b, insert) (n = 4 total images per group) of mouse femurs 21 days after open femoral midshaft fracture. Dashed line boxes indicate the site of fracture. Arrowheads highlight EMCN positive vessels. Scale bar = 1 mm in μCT, 200μm in H&E and 100 μm in EMCN IHC. (c–f) Non-union frequency (c, Shn3+/+ Slit3+/+ = 8, Shn3+/+ Slit3−/− = 11, Shn3−/− Slit3+/+ = 8 and Shn3−/− Slit3−/− = 8), μCT measurement of BV/TV in callus area (d, Shn3+/+ Slit3+/+ = 8, Shn3+/+ Slit3−/− = 7, Shn3−/− Slit3+/+ = 8 and Shn3−/− Slit3−/− = 7), EMCN positive vessel numbers (e, left, n = 4 per group) and maximum compressive load (e, right, n = 4 per group) of the fractured femora 4 weeks after open femoral midshaft fracture. (f–g) Representative μCT (f), H&E staining (g) and EMCN IHC (g, insert) images (n = 4 total images per group) of mouse femurs 21 days post-fracture after IV injection of SLIT3 or PBS. Scale bar = 1 mm for μCT, 200 μm in H&E and100μm in EMCN IHC. (h–j) μCT analysis of BV/TV in callus area (h, Vehicle = 7; SLIT3 = 8), EMCN positive vessel number and volume (i, n = 5 per group) and maximum compressive load and stiffness (j, n = 5 per group) of femurs 21 days after fracture with IV injection of SLIT3 or PBS. (k) Measurement of fracture callus BV/TV (left) and maximum load (right) of mouse femurs harvested 21 days post-fracture with insertion of a gelatin sponge soaked with SLIT3 or vehicle (BV/TV: Non-sponge = 4, Sponge-PBS = 8, Sponge-SLIT3 = 8; Maximum load: Non-sponge = 6, Sponge-PBS = 7, Sponge-SLIT3 = 7). (l) Representative confocal images (n = 3 total images per group) of CD31 (green) and EMCN (red) dual immunostained callus sections of mouse femurs 21 days post-fracture with insertion of a gelatin sponge soaked with SLIT3 or vehicle (high power, insert). Arrowheads highlight CD31hiEMCNhi vessels. Scale bars, 400μm. (m, n) Representative μCT images of the trabecular bone in the distal femur (m) and relative BV/TV (Sham = 9, OVX+Vehicle = 10, OVX+Slit3 = 9, OVX+PTH = 8). Scale bars, 1mm. Values represent mean ± s.e.m; *P < 0.05, **P < 0.01, ***P < 0.001 by a Fisher’s exact test (panel c) unpaired two-tailed Student’s t-test or by one-way ANOVA followed by a Dunnett’s test in all other panels.

Comment in

  • Endothelium-osteoblast crosstalk.
    Bernard NJ. Bernard NJ. Nat Rev Rheumatol. 2018 Jul;14(7):386. doi: 10.1038/s41584-018-0034-4. Nat Rev Rheumatol. 2018. PMID: 29875380 No abstract available.
  • New horizons for osteoanabolic treatment?
    Ignatius A, Tuckermann J. Ignatius A, et al. Nat Rev Endocrinol. 2018 Sep;14(9):508-509. doi: 10.1038/s41574-018-0069-2. Nat Rev Endocrinol. 2018. PMID: 30050157 No abstract available.

References

    1. Kusumbe AP, Ramasamy SK, Adams RH. Coupling of angiogenesis and osteogenesis by a specific vessel subtype in bone. Nature. 2014;507:323–328. - PMC - PubMed
    1. Ramasamy SK, Kusumbe AP, Wang L, Adams RH. Endothelial Notch activity promotes angiogenesis and osteogenesis in bone. Nature. 2014;507:376–380. - PMC - PubMed
    1. Xie H, et al. PDGF-BB secreted by preosteoclasts induces angiogenesis during coupling with osteogenesis. Nat Med. 2014;20:1270–1278. - PMC - PubMed
    1. Shim JH, et al. Schnurri-3 regulates ERK downstream of WNT signaling in osteoblasts. J Clin Invest. 2013;123:4010–4022. - PMC - PubMed
    1. Jones DC, et al. Regulation of adult bone mass by the zinc finger adapter protein Schnurri-3. Science. 2006;312:1223–1227. - PubMed

Publication types

MeSH terms