. 2018 Jun;24(6):758-769.
doi: 10.1038/s41591-018-0034-6. Epub 2018 May 21.

Resetting the epigenetic balance of Polycomb and COMPASS function at enhancers for cancer therapy

Affiliations

Resetting the epigenetic balance of Polycomb and COMPASS function at enhancers for cancer therapy

Lu Wang et al. Nat Med. 2018 Jun.

Abstract

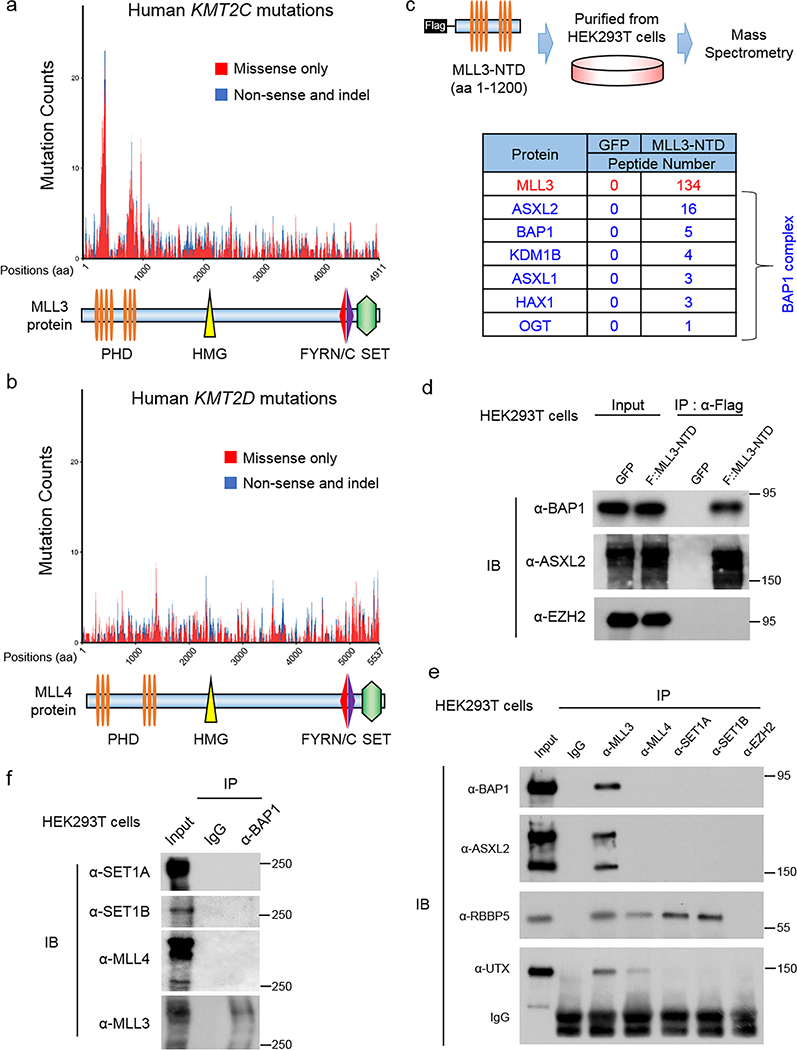
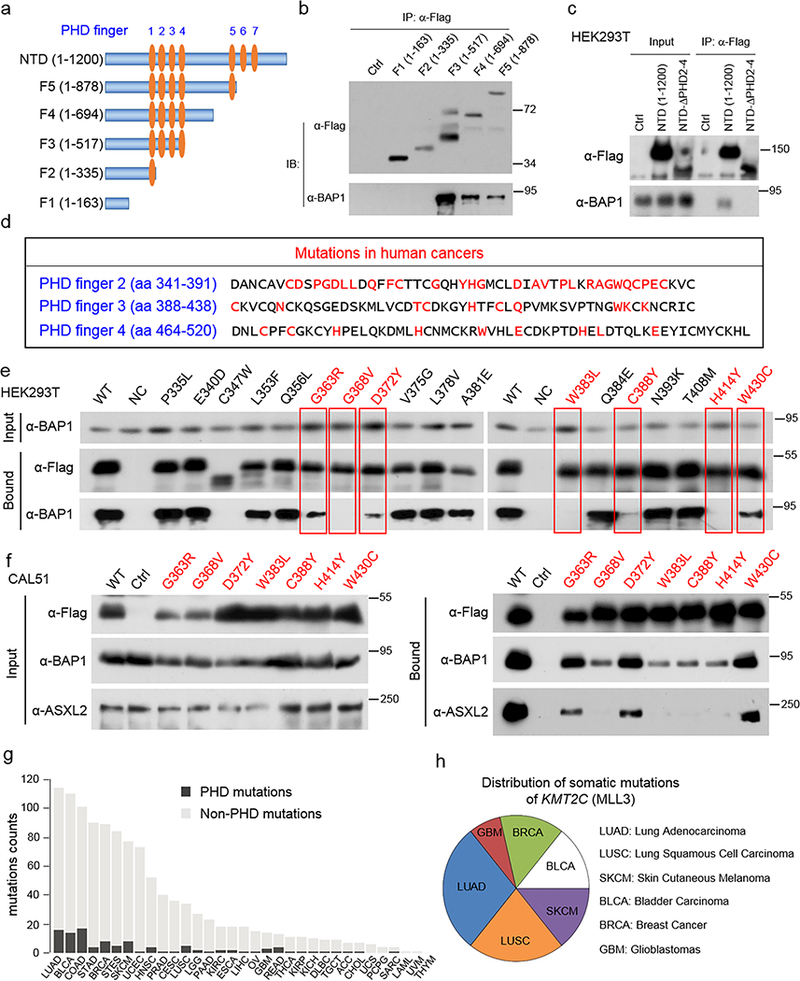
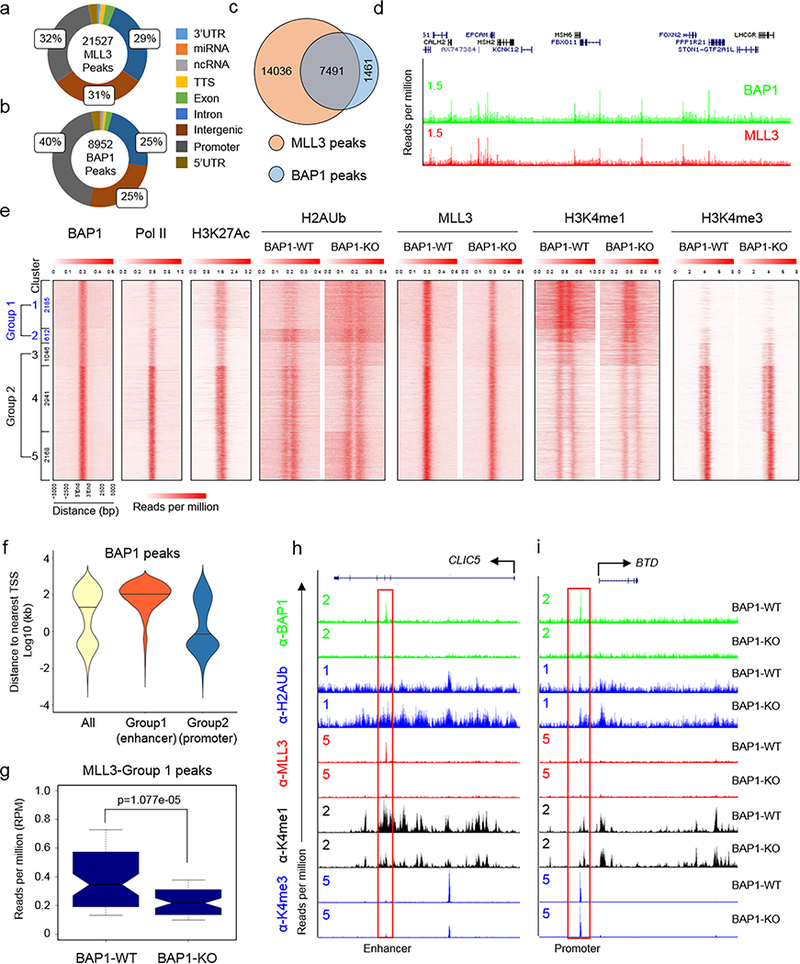
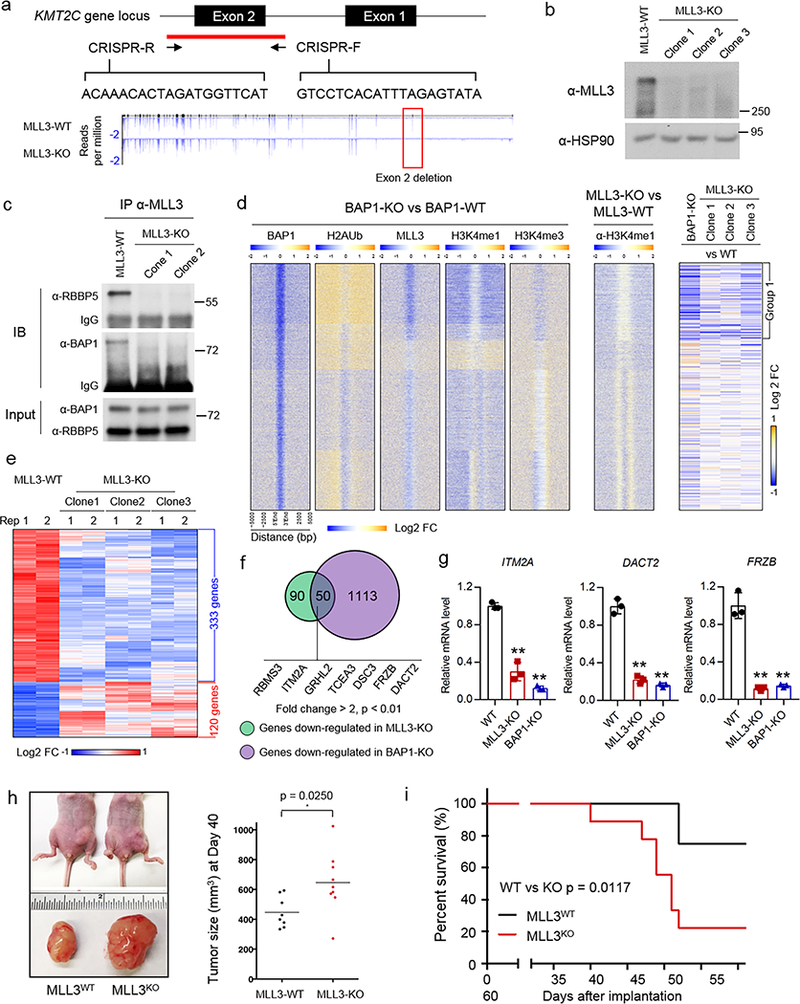
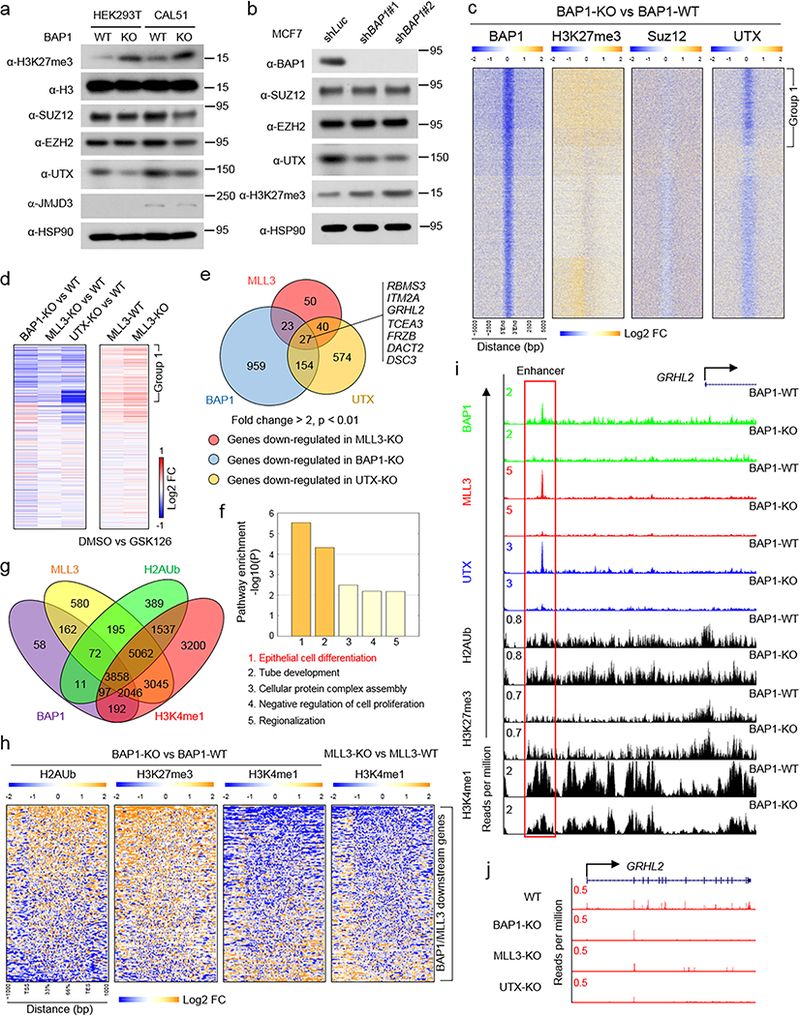
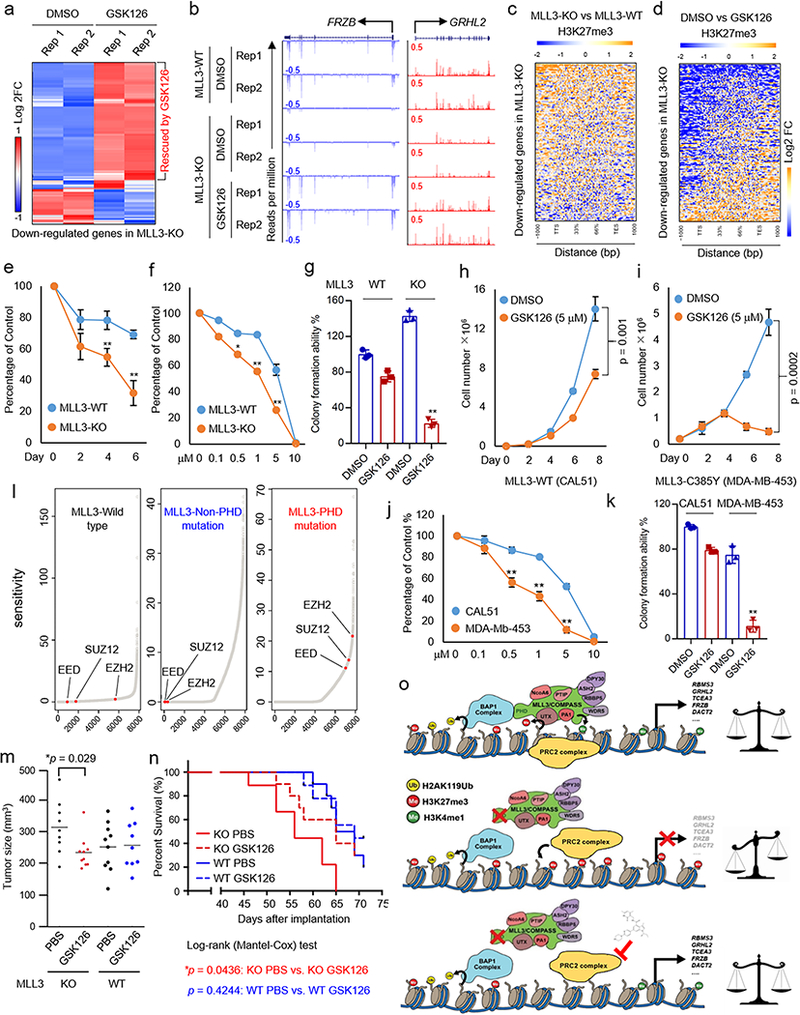
The lysine methyltransferase KMT2C (also known as MLL3), a subunit of the COMPASS complex, implements monomethylation of Lys4 on histone H3 (H3K4) at gene enhancers. KMT2C (hereafter referred to as MLL3) frequently incurs point mutations across a range of human tumor types, but precisely how these lesions alter MLL3 function and contribute to oncogenesis is unclear. Here we report a cancer mutational hotspot in MLL3 within the region encoding its plant homeodomain (PHD) repeats and demonstrate that this domain mediates association of MLL3 with the histone H2A deubiquitinase and tumor suppressor BAP1. Cancer-associated mutations in the sequence encoding the MLL3 PHD repeats disrupt the interaction between MLL3 and BAP1 and correlate with poor patient survival. Cancer cells that had PHD-associated MLL3 mutations or lacked BAP1 showed reduced recruitment of MLL3 and the H3K27 demethylase KDM6A (also known as UTX) to gene enhancers. As a result, inhibition of the H3K27 methyltransferase activity of the Polycomb repressive complex 2 (PRC2) in tumor cells harboring BAP1 or MLL3 mutations restored normal gene expression patterns and impaired cell proliferation in vivo. This study provides mechanistic insight into the oncogenic effects of PHD-associated mutations in MLL3 and suggests that restoration of a balanced state of Polycomb-COMPASS activity may have therapeutic efficacy in tumors that bear mutations in the genes encoding these epigenetic factors.


Figures

Figure 1.
Figure 1.. MLL3 COMPASS associates with the BAP1 complex.
a, b) Mutation counts in MLL3 (KMT2C, a) and MLL4 (KMT2D, b) were obtained from TCGA mutation data retrieved from cBioPortal using the ‘TCGAretriever’ package in R. Mutations occurring in the KMT2C or KMT2D genes were binned based on the position of the affected amino acid and then plotted according to the type of mutation (missense or nonsense/indel). Mutations from 32 provisional TCGA datasets were aggregated and used for the analysis. The mutation counts for each amino acid within MLL3 or MLL4 protein in human cancers were shown. c) Top, schematic of the experimental strategy. An N-terminal 1200 amino acid portion of human KMT2C gene was expressed as a Flag-tagged fusion protein (MLL3-NTD) in HEK293T cells and subjected to Flag-purification from nuclear extracts and used for mass spectrometry analysis. Peptide numbers of each subunit of BAP1 complex purified by MLL3-NTD were shown. d) BAP1 and ASXL2 levels in HEK293T cells 24 hours after transfection with plasmids expressing GFP or Flag-MLL3-NTD. Immunoprecipitation (IP) from whole cell lysates was performed with antibodies directed against the Flag epitope, followed by immunoblotting (IB) with antibodies directed against BAP1 or ASXL2. EZH2 was used as negative control. n=3. e) Immunoprecipitation of endogenous MLL3, MLL4, SET1A and SET1B in HEK293T cells followed by immunoblotting for BAP1 and ASXL2. The core COMPASS subunit RBBP5, and a subunit specific to the MLL3 and MLL4 COMPASS branches, UTX, were used as positive controls. EZH2 immunoprecipitation served as a negative control, n=3. f) Immunoprecipitation of endogenous BAP1 in HEK293T cells followed by immunoblotting for SET1A, SET1B, MLL3 and MLL4, n=3. Image representative of at least two independent experiments. Uncropped images in Supplementary Figure 11.
Figure 2.
Figure 2.. Cancer associated MLL3-PHD mutations disrupt BAP1 binding and correlate with decreased patient survival.
a) Schematic diagram depicting the domain organization of the N-terminus of MLL3. The indicated fragments were sub-cloned as a Flag-tag fusion into pcDNA3.1+ plasmid. b) Whole-cell lysates were used for immunoprecipitation with Flag antibodies followed by immunoblotting for Flag and BAP1 in cells transfected with empty vector (Ctrl) or MLL3-NTD truncations in (a), n=3. c) Whole-cell lysates were used for immunoprecipitation with Flag antibodies followed by immunoblotting for Flag and BAP1 in cells transfected with empty vector (Ctrl), MLL3-NTD or MLL3-NTD-ΔPHD finger 2–4, n=3. d) The protein sequence of PHD fingers 2–4 of human MLL3 protein. Amino acids within the PHD domain that are affected by KMT2C mutation in human cancers are highlighted in red. e) Site-directed mutagenesis of wild-type KMT2C was performed to generate 18 cancer mutations in the second PHD finger. The interaction of wild-type MLL3-NTD-F3 as well as 18 mutated versions of the MLL3-NTD-F3 were assayed for interaction with BAP1 in HEK293T cells as in (b). n=3. The red letters and boxes indicated the mutations that remarkably affect BAP1 and MLL3-NTD binding. f) The interaction of wild-type and MLL3-NTD-F3 mutants in the human breast cancer cell line CAL51. 7 MLL-NTD-F3 mutants exhibiting reduced interaction with BAP1 in HEK293T cells were chosen for validation in CAL51 cells, n=3. g) Counts of somatic mutations within KMT2C, either within or not within the PHD domain, across 32 cancer types in TCGA data. h) The distribution of the seven MLL3 mutations (G363R, G368V, D372Y, W383L, C388Y, H414Y and W430C) in LUAD, BLCA, COAD and BRCA cancer types. Image representative of at least two independent experiments. Uncropped images in Supplementary Figure 12.
Figure 3.
Figure 3.. BAP1-dependent recruitment of MLL3 COMPASS to enhancers.
a, b) Distribution of MLL3 and BAP1 binding to gene regions in the human breast cancer cell line CAL51, as assessed by chromatin immunoprecipitation sequencing (ChIP-seq) using MLL3 and BAP1 specific antibodies. Annotation summaries for MLL3 (a) and BAP1 (b) peaks are presented in the pie chart. c) A Venn diagram presentation of the overlap of MLL3 and BAP1 peaks. d) Representative tracks showing chromatin occupancy by BAP1 and MLL3, n=2. e) Heat maps generated from ChIP-seq data show the occupancy of BAP1, Pol II and H3K27ac as well as H2Aub, MLL3, H3K4me1 and H3K4me3 in BAP1-WT and BAP1-KO CAL51 cells. All rows are centered on BAP1 peaks, and further divided into five clusters based on K-means clustering. Group1 peaks which contain Cluster 1–2 are enriched with enhancer marks, and Group2 peaks which contain Cluster 3–5 are enriched with promoter marks. (See methods for details on the clustering procedure). f) Distances to the nearest TSS are shown for Group 1 and Group 2 peaks, median distances are represented by black lines, n=2. g) Box plot quantifying the changes of MLL3 peaks at Group 1 loci in BAP1-WT and BAP1-KO cells, n=2, P-value from an unpaired Mann-Whitney U test. h) Representative tracks of BAP1, H2Aub, MLL3, H3K4me1 and H3K4me3 at enhancer (h) and promoter (i) BAP1 peaks, n=2.
Figure 4.
Figure 4.. MLL3 regulates tumor suppressor expression from BAP1-depdendent enhancers.
a) Top, schematic of the human KMT2C gene locus and the CRISPR gRNA designed to target exon 2 of the KMT2C gene. Bottom, RNA-seq was performed in MLL3-WT and MLL3-KO cells, and the representative tracks show the depletion of exon 2 (red box) in MLL3-KO cells, n=2. b) MLL3 levels in whole-cell lysates of MLL3-WT and three independent MLL3-KO cells, as assessed by immunoblotting. HSP90 was used as a loading control, n=3. c) The interaction between MLL3 and BAP1 in cell lysates form MLL3-WT and two MLL3-KO cells, as assessed by immunoprecipitation followed by immunoblotting. The core COMPASS subunit RBBP5 was used as a control, n=3. d) The heat map shows log2 fold changes of the occupancy levels of BAP1, H2Aub, MLL3, H3K4me1 and H3K4me3 between BAP-1 KO and BAP-1 WT cells (left) and between MLL3 KO and MLL3 WT cells (middle). Rows are ordered as in Figure 4c. Right, the log2 fold change of nearby gene expression in BAP1-KO cells or MLL3-KO cells as compared to WT cells. e) Heat map showing the common downstream genes in three different MLL3-KO clones. f) Venn diagram showing genes that are down-regulated by both MLL3 and BAP1 loss (p < 0.01, fold change > 2), n=2, P-value from a two-tailed unpaired t-test is shown. Examples of tumor suppressors are shown. g) Expression levels of ITM2A, DACT2 and FRZB as assessed by real-time PCR in wild-type, MLL3-KO and BAP1-KO cells. Data are presented as mean ± sd.; n = 3 independent experiments; two-tailed unpaired Student’s t-test. h) Left, photographs of nude mice (top) and fat pads taken from these mice (bottom) in which 4×10⁶ of MLL3-WT or MLL3-KO breast cancer cells were inoculated into the fat pad. Right, tumor growth in animals at 40 days after inoculation (n=10), P-value from log-rank (Mentel-Cox) test is shown. i) Animal survival at the indicated days after inoculation. Two-tailed unpaired Student’s t test was used for statistical analysis. Image representative of at least two independent experiments. Uncropped images in Supplementary Figure 13.
Figure 5.
Figure 5.. BAP1 depletion leads to increased H3K27me3 due to loss of MLL3 COMPASS containing UTX from chromatin.
a) Levels of H3K27me3, SUZ12, EZH2, JMJD3 and UTX in whole-cell lysates from HEK293T-BAP1-WT, HEK293T-BAP1-KO, CAL51-BAP1-WT and CAL51-BAP1-KO cells, as assessed by immunoblotting. Histone H3 and HSP90 were used as loading controls, n=3. b) Levels of BAP1, SUZ12, EZH2, H3K27me3 and UTX in whole cell lysates of MCF7-shNONT and MCF7-shBAP1 cells, as assessed by immunoblotting, n=3. c) ChIP-seq analysis of H3K27me3, SUZ12 and UTX binding in BAP1-WT and BAP1-KO cells. Rows in the heat maps are centered on BAP1 peaks and show the log2 fold change of occupancy of H3K27me3, SUZ12 and UTX at BAP1 binding regions. d) RNA-seq was performed for wild-type cells, BAP1-KO cells, UTX-KO cells and MLL3-KO cells (left panel), and for MLL3-WT and MLL3-KO cells treated with DMSO or GSK126 (right panel). Left panel, the heat maps show the log2 fold change in expression for the nearest gene of the indicated peaks comparing BAP1-KO, MLL3-KO or UTX-KO cells with wild-type cells. Right panel, the heat maps show the log2 fold change in expression for the nearest gene of the indicated peaks comparing MLL3-WT and MLL3-KO cells treated with DMSO or GSK126. e) Comparison of gene expression between MLL3-KO, BAP1-KO and UTX-KO cells (fold change > 2, p < 0.01). Each circle refers to down-regulated genes in BAP1-KO, MLL3-KO or UTX-KO. Examples of common target genes of BAP1, MLL3 and UTX are shown, n=2. f) Pathway enrichment analysis showing down-regulated genes in common among MLL3, UTX and BAP1 KO cells, n=2. g) Venn diagram showing common genes nearest MLL3, BAP1, H3K4me1 and H2Aub peaks in wild-type CAL51 cells. h) Heat map showing fold-changes of H2Aub, H3K27me3 H3K4me1 occupancy at gene loci that are co-regulated by BAP1 and MLL3 in BAP1-WT and BAP1–KO cells (left three panels). Right, H3K4me1 occupancy at gene loci that are co-regulated by BAP1 and MLL3 in MLL3-WT and MLL3–KO cells. i) Representative tracks showing occupation of the enhancer region within the GRHL2 gene by BAP1, MLL3 and UTX, n=2. j) GRHL2 gene expression levels in wild-type, MLL3-KO, BAP1-KO and UTX-KO cells, as assessed by RNA-seq, n=2. Image representative of at least two independent experiments. Uncropped images in Supplementary Figure 14.
Figure 6.
Figure 6.. Mutations within MLL3-PHD domain sensitize cells to PRC2 inhibition
a) RNA-Seq analysis in MLL3-WT and KO cells treated with or without the EZH2 inhibitor GSK126 (5 μM) for four days. The heat map shows the log2 fold change induced by GSK126 of all the genes down-regulated in MLL3-KO cells. b) Representative RNA-seq tracks showing the expression of genes for which the effects of MLL3 loss are rescued by GSK126, n=2. c) Heat map showing the fold-change of H3K27me3 occupancy at genes in (a) between MLL3-KO and MLL3-WT cells. d) Heat map showing the fold-change of H3K27me3 occupancy at genes in (a) between GSK126 and DMSO treatment in MLL3-KO cells. e) Cell viability of MLL3-WT and KO cells treated with 5 μM of GSK126 for the indicated number of days, as determined by cell counting. Data are presented as mean ± sd.; n = 3 independent experiments; two-tailed unpaired Student’s t-test. **P < 0.01; *P < 0.05. f) Cell viability of MLL3-WT and KO cells treated with the indicated concentrations of GSK126 for eight days, as determined by cell counting. The culture medium and drug were replaced every two days. Data are presented as mean ± sd.; n = 3 independent experiments; two-tailed unpaired Student’s t-test. **P < 0.01; *P < 0.05. g) 104 of MLL3-WT and KO cells were seeded in a 6-well plate and cultured for two weeks in the presence of DMSO or GSK126. Colony forming ability of the cells was determined by crystal violet staining. Data are presented as mean ± sd.; n = 3 independent experiments; two-tailed unpaired Student’s t-test. **P < 0.01. (h, i) Cell numbers of CAL51 cells (MLL3-WT) (h) and MDA-MB-453 cells (MLL3-C385Y) (i), as determined by cell counting. 105 cells were seeded in 6-well plates and cultured for the indicated times in the presence of DMSO or GSK126, n=3. Data are presented as mean ± sd.; n = 3 independent experiments; P-value from a two-tailed unpaired t-test is shown. j) Cell viability of CAL51 and MDA-MB-453 cells treated with the indicated concentrations of GSK126 for eight days, as determined by cell counting. The culture medium and drug were replaced every two days. Data are presented as mean ± sd.; n = 3 independent experiments; two-tailed unpaired Student’s t-test. **P < 0.01; *P < 0.05. k) 104 of CAL51 cells (MLL3-WT) and MDA-MB-453 (MLL3-C385Y) cells were seeded in a 6-well plate and cultured for two weeks in the presence of DMSO or GSK126. Colony forming ability of the cells was determined by crystal violet staining, n=3. Data are presented as mean ± sd.; n = 3 independent experiments; two-tailed unpaired Student’s t-test. **P < 0.01. l) The ranked dependency (or sensitivity) reflects the impairment of growth and survival of cancer cells due to the inactivation of EZH2, SUZ12 and EED in three different breast cancer cell lines, MDA-MB-453 (MLL3-PHD domain mutation), MDA-MB-463 (MLL3-WT) and T47D (MLL3-Non-PHD domain mutation). The sensitivity score was calculated based on the data downloaded from the Project Drive (see Methods). (m, n) Tumor size after inoculation of 4×10⁶ of MLL3-WT of MLL3-KO breast cancer cells into the fat pad of nude mice. Two weeks after transplantation, the animals were treated with either PBS or GSK126 (50 mg/kg) for ten days. m) Tumor size at Day 40 after transplantation, n=10. P-value from log-rank (Mentel-Cox) test is shown. n) Animal survival at the indicated days after inoculation. Two-tailed unpaired Student’s t test was used for statistical analysis. o) Model. BAP1 controls tumor suppressor gene expression by binding to enhancer chromatin and removing H2Aub to facilitate transcription. The BAP1 complex recruits MLL3 COMPASS to enhancers and catalyzes the formation of H3K4me1. Moreover, the UTX subunit within MLL3 COMPASS is stabilized by BAP1 and removes H3K27me3 at enhancers of the indicated genes. In cancers bearing mutations in the MLL3-PHD domain, the MLL3 COMPASS complex, including the H3K27me3 demethylase UTX, is not recruited to BAP1-dependent enhancers, leading to increased H3K27me3 and resulting in the silencing of tumor suppressors such as FRZB, GRHL2 and DACT2. In MLL3 mutant cancer cells, EZH2 inhibition reduces the H3K27me3 levels and resets tumor suppressor expression. This approach is a promising therapeutic tool for regulating the balanced state of gene expression in cancer.

References

    1. Morgan MA & Shilatifard A Chromatin signatures of cancer. Genes & Development 29, 238–249, doi:10.1101/gad.255182.114 (2015). - DOI - PMC - PubMed
    1. Plass C et al. Mutations in regulators of the epigenome and their connections to global chromatin patterns in cancer. Nature Reviews Genetics 14, 765–780, doi:10.1038/nrg3554 (2013). - DOI - PubMed
    1. Hamamoto R et al. SMYD3 encodes a histone methyltransferase involved in the proliferation of cancer cells. Nature Cell Biology 6, 731–740, doi:10.1038/ncb1151 (2004). - DOI - PubMed
    1. Kotake Y et al. pRB family proteins are required for H3K27 trimethylation and Polycomb repression complexes binding to and silencing p16INK4alpha tumor suppressor gene. Genes Dev 21, 49–54, doi:10.1101/gad.1499407 (2007). - DOI - PMC - PubMed
    1. Mazur PK et al. SMYD3 links lysine methylation of MAP3K2 to Ras-driven cancer. Nature 510, 283-+, doi:10.1038/nature13320 (2014). - DOI - PMC - PubMed

Publication types

MeSH terms