. 2018 Jun;24(6):868-880.
doi: 10.1038/s41591-018-0028-4. Epub 2018 May 21.

The reference epigenome and regulatory chromatin landscape of chronic lymphocytic leukemia

Affiliations

The reference epigenome and regulatory chromatin landscape of chronic lymphocytic leukemia

Renée Beekman et al. Nat Med. 2018 Jun.

Abstract

Chronic lymphocytic leukemia (CLL) is a frequent hematological neoplasm in which underlying epigenetic alterations are only partially understood. Here, we analyze the reference epigenome of seven primary CLLs and the regulatory chromatin landscape of 107 primary cases in the context of normal B cell differentiation. We identify that the CLL chromatin landscape is largely influenced by distinct dynamics during normal B cell maturation. Beyond this, we define extensive catalogues of regulatory elements de novo reprogrammed in CLL as a whole and in its major clinico-biological subtypes classified by IGHV somatic hypermutation levels. We uncover that IGHV-unmutated CLLs harbor more active and open chromatin than IGHV-mutated cases. Furthermore, we show that de novo active regions in CLL are enriched for NFAT, FOX and TCF/LEF transcription factor family binding sites. Although most genetic alterations are not associated with consistent epigenetic profiles, CLLs with MYD88 mutations and trisomy 12 show distinct chromatin configurations. Furthermore, we observe that non-coding mutations in IGHV-mutated CLLs are enriched in H3K27ac-associated regulatory elements outside accessible chromatin. Overall, this study provides an integrative portrait of the CLL epigenome, identifies extensive networks of altered regulatory elements and sheds light on the relationship between the genetic and epigenetic architecture of the disease.


Conflict of interest statement

Competing Financial Interests Statement

The authors declare no competing financial interests.

Figures

Fig. 1
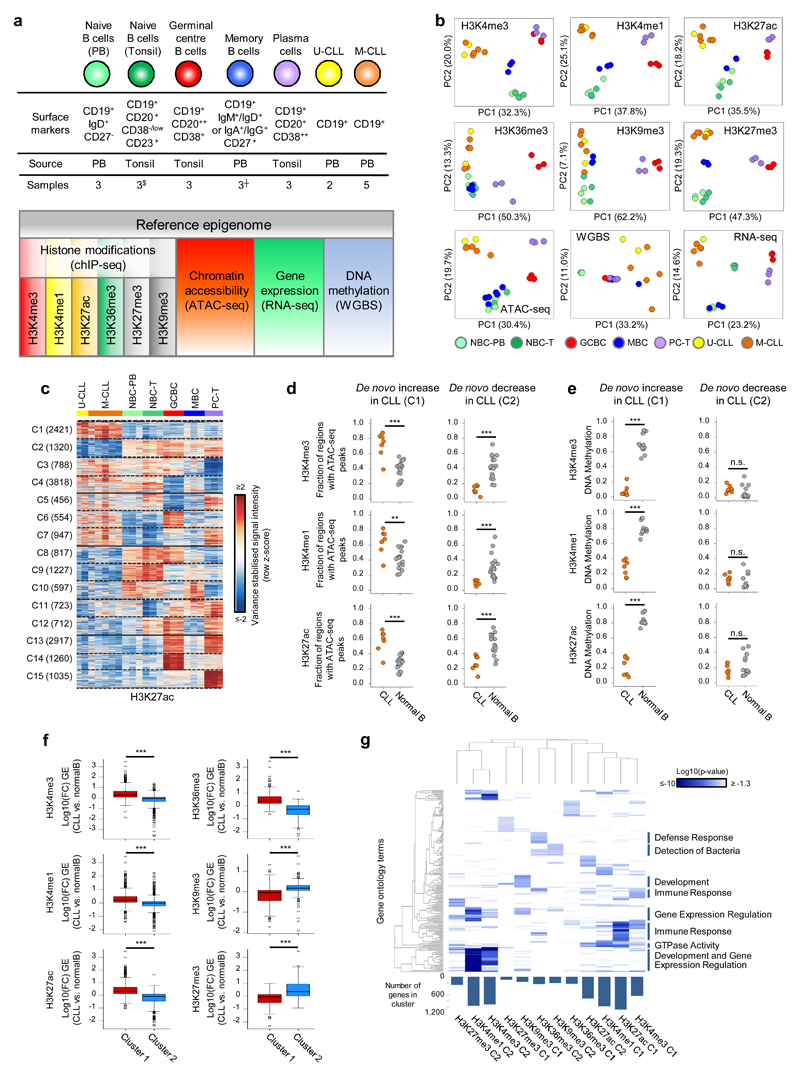
Fig. 1. CLL reference epigenomes.
(a) Overview of analyzed CLL and normal B-cell samples (upper panel) for the nine layers of the reference epigenome (lower panel). $no whole-genome bisulfite sequencing data available; six instead of three biologically independent samples analyzed for chromatin accessibility. (b) Unsupervised principal component analysis for the nine layers of the reference epigenome. Number of datapoints analyzed to generate the PCAs: H3K4me3 (n=38,499 independent genomic regions), H3K4me1 (n=37,871 independent genomic regions), H3K27ac (n=47,191 independent genomic regions), H3K36me3 (n=15,561 independent genomic regions), H3K9me3 (n=27,371 independent genomic regions), H3K27me3 (n=12,878 independent genomic regions), ATAC-seq (n=91,671 independent genomic regions), WGBS (n=15,825,190 independent CpGs), RNA-seq (n=36,190 independent genes). Sample sizes were for U-CLL: n=2 biologically independent samples (all nine layers), for M-CLL: n=5 biologically independent samples (all nine layers), for NBC-PB, GCBC and PC-T: n=3 biologically independent samples (all nine layers), for NBC-T: n=3 biologically independent samples (all layers except WGBS that does not include NBC-T), for MBC: n=3 biologically independent samples (all layers except ATAC-seq for which 6 biologically independent samples were used). (c) K-means clustering of independent genomic regions showing differences in the dynamics of H3K27ac levels in CLL and normal B cells. For each cluster (C1-C15) the number of independent genomic regions is indicated in brackets. C1 and C2 respectively represent regions with de novo increase and de novo decrease in CLL. (d) Fraction of regions in CLL (n=7 biologically independent samples) and normal B cells (n=15 biologically independent samples) harboring ATAC-seq peaks in regions with de novo increase (C1) or de novo decrease (C2) in CLL of H3K4me3 (respective P-values 5.5 x 10⁻⁴ and 4.2 x 10⁻⁶), H3K4me1 (respective P-values 6.1 x 10⁻³ and 2.9 x 10⁻⁵) and H3K27ac (respective P-values 5.5 x 10⁻⁴ and 1.9 x 10⁻⁴). P-values were calculated using a Wilcoxon rank sum test (two-sided). (e) Median DNA methylation levels in CLL (n=7 biologically independent samples) and normal B cells (n=15 biologically independent samples) of regions with de novo increase (C1) or de novo decrease (C2) in CLL of H3K4me3 (respective P-values 4.5 x 10⁻⁴ and 1.6 x 10⁻¹), H3K4me1 (respective P-values 4.5 x 10⁻⁴ and 1.6 x 10⁻¹) and H3K27ac (respective P-values 4.5 x 10⁻⁴ and 4.2 x 10⁻¹). P-values were calculated using a Wilcoxon rank sum test (two-sided). (f) Boxplots of log10 transformed fold changes (FC) in gene expression (GE) levels in CLL versus normal B cells of all genes located within regions with de novo increase (cluster 1, C1) or de novo decrease (cluster 2, C2) in CLL. For each gene the mean log10 transformed GE levels of CLL (n=7 biologically independent samples) and normal B cells (n=15 biologically independent samples) were calculated and subtracted to obtain the log10 transformed FC between CLL and normal B cells. H3K4me3 (P-value 8.2 x 10-77, mean, minimum, 25th, 50th and 75th percentile and maximum log10(FC) and number of datapoints (= independent genes) C1: 0.43, -1.85, 0.09, 0.29, 0.65, 3.47, 624 and C2: -0.15, -3.62, -0.33, -0.04, 0.10, 1.41, 911), H3K4me1 (P-value 3.9 x 10-50, mean, minimum, 25th, 50th and 75th percentile and maximum log10(FC) and number of datapoints (= independent genes) C1: 0.29, -1.42, 0.05, 0.21, 0.49, 3.47, 971 and C2: -0.05, -2.09, -0.23, -0.02, 0.10, 2.27, 952), H3K27ac (P-value 5.3 x 10-137, mean, minimum, 25th, 50th and 75th percentile and maximum log10(FC) and number of datapoints (= independent genes) C1: 0.44, -1.05, 0.12, 0.32, 0.64, 3.47, 1,081 and C2: -0.25, -2.42, -0.46, -0.09, 0.09, 1.63, 713), H3K36me3 (P-value 1.1 x 10-52, mean, minimum, 25th, 50th and 75th percentile and maximum log10(FC) and number of datapoints (= independent genes) C1: 0.52, -0.65, 0.19, 0.34, 0.72, 3.47, 233 and C2: -0.37, -2.32, -0.68, -0.26, 0.01, 1.13, 235), H3K9me3 (P-value 3.3 x 10⁻¹⁰, mean, minimum, 25th, 50th and 75th percentile and maximum log10(FC) and number of datapoints (= independent genes) C1: -0.16, -1.73, -0.44, -0.04, 0.07, 1.32, 160 and C2: 0.16, -1.91, 0.06, 0.17, 0.30, 1.74, 206) and H3K27me3 (P-value 3.0 x 10⁻¹⁷, mean, minimum, 25th, 50th and 75th percentile and maximum log10(FC) and number of datapoints (= independent genes) C1: -0.22, -2.32, -0.51, -0.06, 0.12, 0.98, 92 and C2: 0.52, -0.93, 0.00, 0.35, 0.93, 3.47, 262). P-values were calculated using a Student's t-test (two-sided). (g) Heatmap of p-values of gene ontology (GO) terms (rows, n= 190 independent GO terms, only the top 20 terms per cluster were included) that were significantly enriched (p-value < 0.05) among the genes overlapping with regions with de novo increase (C1) or de novo decrease (C2) of the six histone marks in CLL. The GO term enrichment and significance were calculated per cluster separately. The number of independent genes per cluster used in this calculation is indicated below the heatmap, their exact numbers were: H3K4me3 (C1: 624, C2: 911), H3K4me1 (C1: 971, C2: 952), H3K27ac (C1: 1,081, C2: 713), H3K36me3 (C1: 233, C2: 235), H3K9me3 (C1: 160, C2: 206) and H3K27me3 (C1: 92, C2: 262). U-CLL, CLL with unmutated IGHV; M-CLL, CLL with mutated IGHV; NBC-PB, naive B cell from peripheral blood; NBC-T, naive B cell from tonsil; GCBC, germinal centre B cell; MBC, memory B cell; PC-T, plasma cell from tonsil; GE, gene expression.
Fig. 2
Fig. 2. Chromatin states and its transitions in CLL.
(a) Emissions of the generated chromatin state model. Represented are the percentages of regions assigned to a specific chromatin state (columns) that contain a specific histone mark (rows). (b) Jaccard coefficients of genomic regions that show de novo increase (C1) or de novo decrease (C2) of the six different histone marks in CLL. Number of regions analyzed: H3K4me3 C1 (n=1,170 independent regions), H3K4me3 C2 (n=1,423 independent regions), H3K4me1 C1 (n=1,418 independent regions), H3K4me1 C2 (n=1,198 independent regions), H3K27ac C1 (n=2,421 independent regions), H3K27ac C2 (n=1,320 independent regions), H3K36me3 C1 (n=285 independent regions), H3K36me3 C2 (n=251 independent regions), H3K9me3 C1 (n=344 independent regions), H3K9me3 C2 (n=293 independent regions), H3K27me3 C1 (n=208 independent regions), H3K27me3 C2 (n=325 independent regions). (c) Distribution of the different chromatin states in all analyzed samples separately (seven CLLs and 15 normal B cells) at regions with de novo increase (C1) or de novo decrease (C2) of H3K4me3, H3K4me1 and H3K27ac in CLL. (d) Chromatin state transitions from B cells to CLL. Percentages of regions with de novo increase (C1) or de novo decrease (C2) of H3K4me3, H3K4me1 and H3K27ac in CLL that harbor a specific chromatin state in normal B cells (rows, n=15 biologically independent samples) and the same (diagonal, no change of chromatin state) or another state (chromatin state switch) in CLL (columns, n=7 biologically independent samples). The total matrix represents 100 percent of the regions. U-CLL, CLL with unmutated IGHV; M-CLL, CLL with mutated IGHV; NBC-PB, naive B cell from peripheral blood; NBC-T, naive B cell from tonsil; GCBC, germinal centre B cell; MBC, memory B cell; PC-T, plasma cell from tonsil. ActProm, Active Promoter; WkProm, Weak Promoter; PoisProm, poised Promoter; StrEnh1, Strong Enhancer 1; StrEnh2, Strong Enhancer 2; WkEnh, Weak Enhancer; Txn_Trans, Transcription Transition; Txn_Elong, Transcription Elongation; Wk_Txn, Weak Transcription; H3K9me3_Repr, H3K9me3 Repressed; H3K27me3_Repr, H3K27me3 Repressed; Het;LowSign, Heterochromatin;Low Signal.
Fig. 3
Fig. 3. CLL specific regulatory landscape.
(a) Number of independent genomic regions with de novo gain or loss of regulatory elements in CLL. (b) Binding motifs of NFAT, FOX and TCF/LEF transcription family members, which are highly enriched in the accessible loci of the de novo active regions (n=934 independent genomic loci) versus the background (n=1,868 independent genomic loci). Statistical significance was determined using the one-tailed Wilcoxon rank-sum test and the p-values were adjusted using the Bonferroni correction. Out of the list of all enriched TF motifs (Supplementary Table 8), we considered only those expressed in the seven CLLs with reference epigenomes. (c) Normalized interaction frequencies of 3D chromatin interactions within a 100kb window in CLL1525 (upper row) and memory B cells (MBCs, lower row) in regions that are de novo active in CLL (left panels), active in CLL and MBCs (middle panels) and inactive in both (right panels). (d and e) Examples of identified de novo active regions in CLL (red arrows), targeting FMOD (d) and TCF4 (e). Indicated are in the upper panels the chromatin states in all seven biologically independent CLLs and representative samples of each of the normal B-cell subpopulations and below this the median ATAC-seq, DNA methylation and RNA-seq levels of the seven biologically independent CLLs and 15 biologically independent normal B cells. U-CLL, CLL with unmutated IGHV; M-CLL, CLL with mutated IGHV; NBC-PB, naive B cell from peripheral blood; NBC-T, naive B cell from tonsil; GCBC, germinal centre B cell; MBC, memory B cell; PC-T, plasma cell from tonsil. ActProm, Active Promoter; WkProm, Weak Promoter; PoisProm, poised Promoter; StrEnh1, Strong Enhancer 1; StrEnh2, Strong Enhancer 2; WkEnh, Weak Enhancer; Txn_Trans, Transcription Transition; Txn_Elong, Transcription Elongation; Wk_Txn, Weak Transcription; H3K9me3_Repr, H3K9me3 Repressed; H3K27me3_Repr, H3K27me3 Repressed; Het;LowSign, Heterochromatin;Low Signal.
Fig. 4
Fig. 4. De novo chromatin activity and accessibility changes in an extended CLL cohort.
(a) Unsupervised principal component analysis (first three components) of the extended CLL cohort. Number of datapoints analyzed to generate the PCAs: H3K27ac (n=58,790 independent genomic regions) and ATAC-seq (n=115,352 independent genomic regions). Respective P-values for H3K27ac between U-CLL (n=39 biologically independent samples) and M-CLL (n=63 biologically independent samples) of PC1, PC2 and PC3 were 8.4 x 10⁻¹, 6.5 x 10⁻⁶ and 4.3 x 10⁻¹⁶) and for ATAC-seq between U-CLL (n=38 biologically independent samples) and M-CLL (n=66 biologically independent samples) of PC1, PC2 and PC3 were 1.5 x 10⁻¹, 9.5 x 10⁻¹⁰ and 5.2 x 10⁻¹⁶). P-values were calculated using a Student's t-test (two-sided). (b) Heatmap of signal intensities of H3K27ac and ATAC-seq in regions that show a de novo change in levels of these marks in U-CLL and M-CLL. Signal intensities are indicated as row z-scores. On the left the number of independent regions per cluster is indicated. (c) Heatmap of gene expression levels of target genes associated with regions that show de novo change in H3K27ac (activity) or ATAC-seq (accessibility) levels in U-CLL and M-CLL. Gene expression levels are indicated as row z-scores. On the left the number of independent target genes is indicated. (d) Top five enriched transcription factor binding sites in regions that show a de novo change in ATAC-seq levels in U-CLL and M-CLL. Out of the list of all enriched TF motifs (Supplementary Table 8), we considered only those expressed in the CLL subgroup with higher accessibility levels. Number of regions analyzed vs. background were: de novo increased accessibility in U-CLL (n= 2,125 vs. 4,250 independent genomic regions) or M-CLL (n=175 vs. 350 independent genomic regions) and de novo decreased accessibility in U-CLL (n=238 vs. 476 independent genomic regions) or M-CLL (n=1,065 vs. 2,130 independent genomic regions). Statistical significance was determined using the one-tailed Wilcoxon rank-sum test and the p-values were adjusted using the Bonferroni correction. U-CLL, CLL with unmutated IGHV; M-CLL= CLL with mutated IGHV; NBC-PB, naive B cell from peripheral blood; NBC-T, naive B cell from tonsil; GCBC, germinal centre B cell; MBC, memory B cell; PC-T, plasma cell from tonsil.
Fig. 5
Fig. 5. B cell related chromatin activity and accessibility signatures in the extended CLL cohort.
(a) Heatmap of the signal intensities of H3K27ac and ATAC-seq at differential regions between U-CLL and M-CLL that show dynamic modulation of these marks in normal B cells. Signal intensities are indicated as row z-scores. For each change (up in U-CLL (left panels) or down in U-CLL (right panels)) and each mark the six main (out of the 30 possible) dynamic patterns are shown. On the left the number of independent regions per cluster is indicated. (b) Principal component analysis of all regions that show differential changes in U-CLL versus M-CLL and dynamic modulation in normal B cells. In this case, all regions of all 30 dynamic patterns were included in the analysis, number of datapoints analyzed to generate the PCAs: H3K27ac (n=1,723 independent genomic regions) and ATAC-seq (n=5,200 independent genomic regions). Sample sizes: U-CLL (n=39 biologically independent samples for H3K27ac and 38 for ATAC-seq), M-CLL (n=63 biologically independent samples for H3K27ac and 66 for ATAC-seq), NBC-PB, NBC-T, GCBC and PC-T (n=3 biologically independent samples for H3K27ac and ATAC-seq), MBC (n=3 biologically independent samples for H3K27ac and 6 for ATAC-seq). (c) (left panel) Heatmap of signal intensities of ATAC-seq in the 64 independent genomic regions that show differential higher levels in M-CLL compared to U-CLL that overlap with the previously defined 1,649 CpG signature. Signal intensities are indicated as row z-scores. (right panel) Heatmap of DNA methylation estimates of the 91 independent CpGs that overlap with the ATAC-seq regions represented in the left panel. U-CLL, CLL with unmutated IGHV; M-CLL= CLL with mutated IGHV; NBC-PB, naive B cell from peripheral blood; NBC-T, naive B cell from tonsil; GCBC, germinal centre B cell; MBC, memory B cell; PC-T, plasma cell from tonsil.
Fig. 6
Fig. 6. Somatic genetic alterations in relation to chromatin activity and accessibility.
(a) Number of regions with significant gain or loss of H3K27ac or ATAC-seq levels in CLLs with somatic genetic alterations in the indicated genes/regions as compared to CLL cases without these alterations or in driver-less CLLs as compared to CLLs with mutations in driver genes. Regions with gain/loss within the investigated structural variant were excluded. Statistical significance was determined using the two-sided nbinomWaldTest in the DEseq2 package, corrected for multiple testing (Benjamini-Hochberg). Sample sizes: MYD88-MT vs. MYD88-WT (H3K27ac: n=5 vs. 57, ATAC-seq: n=6 vs. 59 biologically independent samples), SF3B1-MT vs. SF3B1-WT (H3K27ac: n=7 vs. 95, ATAC-seq: n=7 vs. 97 biologically independent samples), ATM-MT vs. ATM-WT (H3K27ac: n=10 vs. 28, ATAC-seq: n=10 vs. 27 biologically independent samples), TP53-MT vs. TP53-WT (H3K27ac: n=5 vs. 97, ATAC-seq: n=5 vs. 99 biologically independent samples), IGLL5-MT vs. IGLL5-WT (H3K27ac: n=6 vs. 56, ATAC-seq: n=7 vs. 58 biologically independent samples), NOTCH1-MT vs. NOTCH1-WT (H3K27ac: n=9 vs. 29, ATAC-seq: n=9 vs. 28 biologically independent samples), SYNE1-MT vs. SYNE1-WT (H3K27ac: n=6 vs. 96, ATAC-seq: n=6 vs. 98 biologically independent samples), MGA-MT vs. MGA-WT (H3K27ac: n=5 vs. 33, ATAC-seq: n=5 vs. 32 biologically independent samples), driverless vs. with mutations in driver genes (H3K27ac: n=15 vs. 47, ATAC-seq: n=15 vs. 50 biologically independent samples), tri12 vs. non-tri12 (H3K27ac: n=14 vs. 88, ATAC-seq: n=13 vs. 91 biologically independent samples), del10q vs. non-del10q (H3K27ac: n=5 vs. 97, ATAC-seq: n=5 vs. 99 biologically independent samples), del17p vs. non-del17p (H3K27ac: n=6 vs. 96, ATAC-seq: n=6 vs. 98 biologically independent samples), del13q vs. non-del13q (H3K27ac: n=45 vs. 57, ATAC-seq: n=46 vs. 58 biologically independent samples), del11q vs. non-del11q (H3K27ac: n=8 vs. 30, ATAC-seq: n=8 vs. 29 biologically independent samples), amp2p vs. non-amp2p (H3K27ac: n=5 vs. 33, ATAC-seq: n=5 vs. 32 biologically independent samples). (b) Heatmap of signal intensities of regions up and down regulated for H3K27ac and ATAC-seq levels in MYD88 mutated CLLs. Signal intensities are indicated as row z-scores. (c) Heatmap of signal intensities of regions up and down regulated for H3K27ac and ATAC-seq levels in CLLs with trisomy 12. Regions with gain of H3K27ac or ATAC-seq levels in chromosome 12 in the trisomy12 cases were excluded. Signal intensities are indicated as row z-scores. (d) Percentage of mutations in specific CLL cases falling into regions with the different chromatin states in the exact same cases. (e) Enrichment of somatic mutations in regions with ATAC-seq and/or H3K27ac in the exact same case (indicated are the ratios of observed versus expected number of mutations in these regions). (f) Mean enrichment in U-CLL (H3K27ac: n=25, ATAC-seq: n=24 biologically independent samples) and M-CLL (H3K27ac: n=17, ATAC-seq: n=18 biologically independent samples) of somatic mutations in regions with H3K27ac (mean U-CLL: 0.99, mean M-CLL: 2.98, P-value 2.7 x 10⁻⁵) or ATAC-seq (mean U-CLL: 0.76, mean M-CLL: 1.04, P-value 2.3 x 10⁻²) in the exact same case (indicated are ratios of observed versus expected number of mutations in these regions). Error bars indicate standard deviations. P-values were calculated using a Wilcoxon rank sum test (two-sided). (g) Mean enrichment in U-CLL (n=24 biologically independent samples) and M-CLL (n=17 biologically independent samples) of somatic mutations in regions with ATAC-seq and/or H3K27ac in the exact same case (indicated are the ratios of observed versus expected number of mutations in these regions). Respective means U-CLL: 1.47, 0.77, 0.74, 1.00, respective means M-CLL: 5.97, 1.08, 0.99, 0.99, and respective P-values: 8.5 x 10⁻⁵, 1.7 x 10⁻², 3.5 x 10⁻¹ and 1.0 x 10⁻⁴. Error bars indicate standard deviations. P-values were calculated using a Wilcoxon rank sum test (two-sided). (h) Mean enrichment in U-CLL (n=24 biologically independent samples) and M-CLL (n=17 biologically independent samples) of somatic mutations in regions with ATAC-seq and/or H3K27ac in the exact same case (indicated are the ratios of observed versus expected number of mutations in these regions) in loci that are known targets of the SHM machinery (upper panel, excluding IG loci, respective means U-CLL: 0.39, 0.80, 1.39, 1.00, respective means M-CLL: 18.87, 2.91, 5.25, 0.92, and respective P-values: 5.3 x 10⁻⁶, 8.2 x 10⁻³, 1.0 x 10⁻¹ and 8.5 x 10⁻⁶) and other regions (lower panel, respective means U-CLL: 0.44, 0.75, 0.69, 1.00, respective means M-CLL: 0.62, 0.71, 0.69, 1.00, and respective P-values: 1.6 x 10⁻¹, 8.0 x 10⁻¹, 9.3 x 10⁻¹ and 8.8 x 10⁻²). Error bars indicate standard deviations. P-values were calculated using a Wilcoxon rank sum test (two-sided). MT, mutated; WT, wild type; tri12, trisomy 12; del, deletion; amp, amplification; U-CLL, CLLs with unmutated IGHV; M-CLL, CLLs with mutated IGHV; SHM, somatic hypermutation; NBC-PB, naive B cell from peripheral blood; NBC-T, naive B cell from tonsil; GCBC, germinal centre B cell; MBC, memory B cell; PC-T, plasma cell from tonsil. ActProm, Active Promoter; WkProm, Weak Promoter; StrEnh1, Strong Enhancer 1; StrEnh2, Strong Enhancer 2; WkEnh, Weak Enhancer; Wk_Txn, Weak Transcription; Het;LowSign, Heterochromatin;Low Signal.

References

    1. Baylin SB, Jones PA. A decade of exploring the cancer epigenome - biological and translational implications. Nat Rev Cancer. 2011;11:726–734. - PMC - PubMed
    1. Rivera CM, Ren B. Mapping human epigenomes. Cell. 2013;155:39–55. - PMC - PubMed
    1. Akhtar-Zaidi B, et al. Epigenomic enhancer profiling defines a signature of colon cancer. Science. 2012;336:736–739. - PMC - PubMed
    1. Fiziev P, et al. Systematic Epigenomic Analysis Reveals Chromatin States Associated with Melanoma Progression. Cell Rep. 2017;19:875–889. - PMC - PubMed
    1. Lin CY, et al. Active medulloblastoma enhancers reveal subgroup-specific cellular origins. Nature. 2016;530:57–62. - PMC - PubMed

Publication types