. 2018 Nov;26(11):1785-1795.
doi: 10.1002/oby.22210. Epub 2018 May 22.

Body Composition Profiling in the UK Biobank Imaging Study

Affiliations

Body Composition Profiling in the UK Biobank Imaging Study

Jennifer Linge et al. Obesity (Silver Spring). 2018 Nov.

Abstract

Objective: This study aimed to investigate the value of imaging-based multivariable body composition profiling by describing its association with coronary heart disease (CHD), type 2 diabetes (T2D), and metabolic health on individual and population levels.

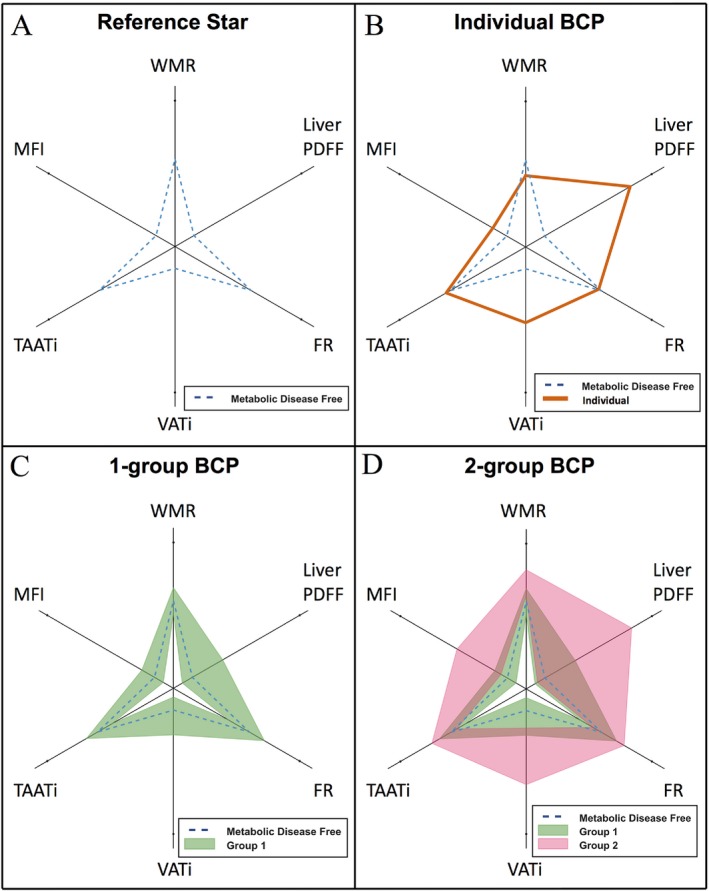
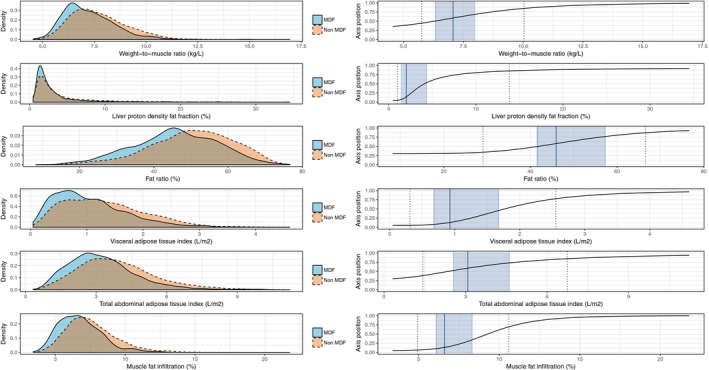
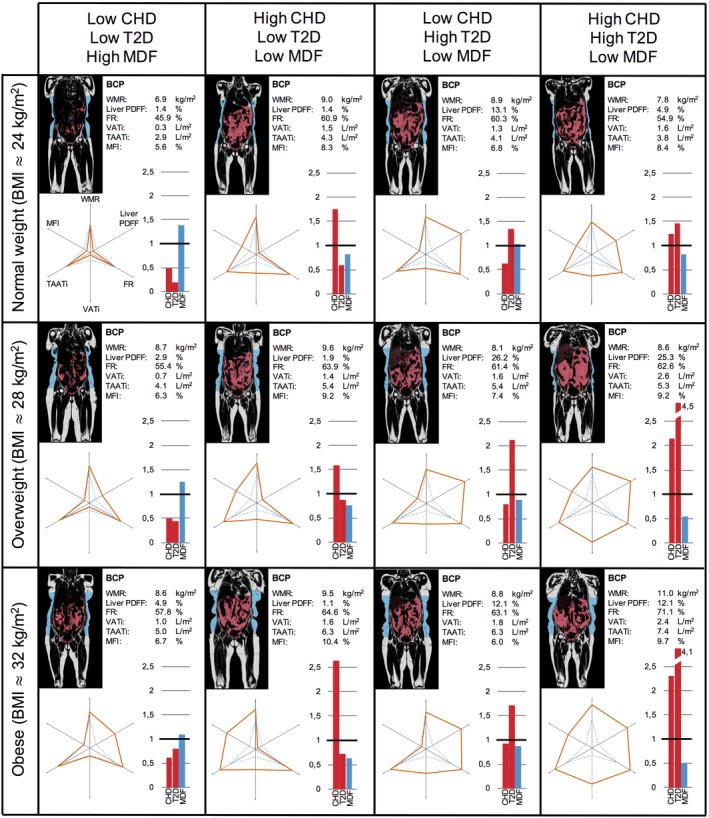
Methods: The first 6,021 participants scanned by UK Biobank were included. Body composition profiles (BCPs) were calculated, including abdominal subcutaneous adipose tissue, visceral adipose tissue (VAT), thigh muscle volume, liver fat, and muscle fat infiltration (MFI), determined using magnetic resonance imaging. Associations between BCP and metabolic status were investigated using matching procedures and multivariable statistical modeling.

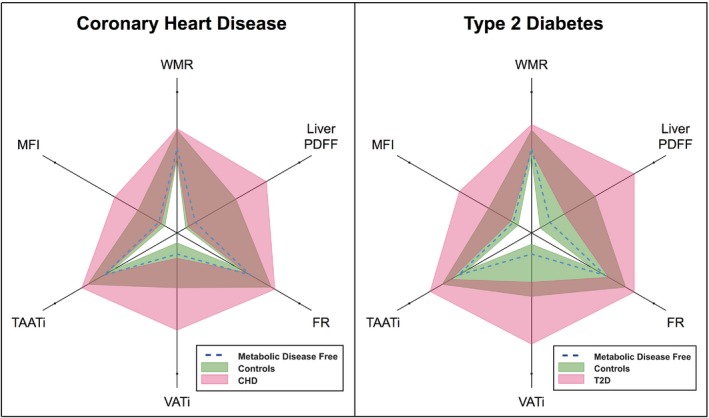
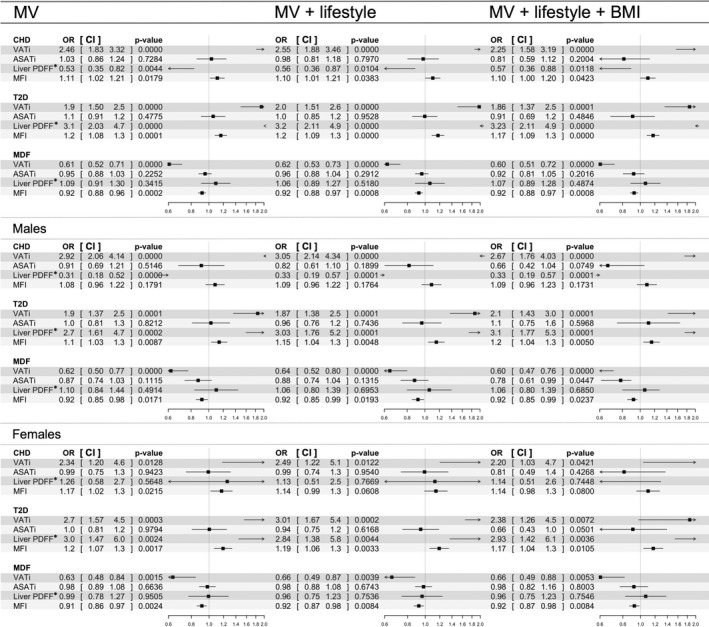
Results: Matched control analysis showed that higher VAT and MFI were associated with CHD and T2D (P < 0.001). Higher liver fat was associated with T2D (P < 0.001) and lower liver fat with CHD (P < 0.05), matching on VAT. Multivariable modeling showed that lower VAT and MFI were associated with metabolic health (P < 0.001), and liver fat was nonsignificant. Associations remained significant adjusting for sex, age, BMI, alcohol, smoking, and physical activity.

Conclusions: Body composition profiling enabled an intuitive visualization of body composition and showed the complexity of associations between fat distribution and metabolic status, stressing the importance of a multivariable approach. Different diseases were linked to different BCPs, which could not be described by a single fat compartment alone.


Figures

Figure 1
Figure 1
Visualization examples of the body composition profile (BCP). (A) Median of a metabolic disease‐free (MDF) population (same in B‐D); (B) an individual BCP (orange); (C) a group visualized as the field spanning the interquartile range (green); (D) two groups visualized as fields spanning their interquartile ranges (green and pink); brown areas represent the overlap between groups. FR, fat ratio; MFI, muscle fat infiltration; PDFF, proton density fat fraction; TAATi, total abdominal adipose tissue index; VATi, visceral adipose tissue index; WMR, weight‐to‐muscle ratio. [Color figure can be viewed at http://wileyonlinelibrary.com]
Figure 2
Figure 2
Density and scaling of BCP variables. Left panels are the density plots for each BCP variable comparing MDF subjects (solid contour) with those not characterized as MDF (dashed contour); right panels are the transfer functions from BCP variable values to their position on corresponding axes in the BCP plot, including median values (solid line) and the interquartile ranges (shaded areas) of the MDF group as reference and the 5th and 95th percentile of the whole cohort (dashed lines). BCP, body composition profile; MDF, metabolic disease free. [Color figure can be viewed at http://wileyonlinelibrary.com]
Figure 3
Figure 3
Body composition profiling of females from the UK Biobank imaging cohort. Each subject, approximately age 65, is presented with a coronal slice from the MRI scan with VAT (red) and ASAT (blue) segmentations, the BCP values with corresponding six‐axes plots, and bar plots showing sex‐and‐age normalized predicted probabilities. BCP, body composition profile; CHD, coronary heart disease; FR, fat ratio; MDF, metabolic disease free; MFI, muscle fat infiltration; ASAT, abdominal subcutaneous adipose tissue; PDFF, proton density fat fraction; T2D, type 2 diabetes; TAATi, total abdominal adipose tissue index; VATi, visceral adipose tissue index; WMR, weight‐to‐muscle ratio.
Figure 4
Figure 4
Body composition profiling of coronary heart disease and type 2 diabetes. Pink and green fields represent the interquartile ranges of cases and controls, respectively, brown areas the overlap between groups, and dashed blue lines the median of a metabolic disease‐free group as reference. FR, fat ratio; PDFF, proton density fat fraction; MFI, muscle fat infiltration; T2D, type 2 diabetes; TAATi, total abdominal adipose tissue index; VATi, visceral adipose tissue index; WMR, weight‐to‐muscle ratio. [Color figure can be viewed at http://wileyonlinelibrary.com]
Figure 5
Figure 5
Results from the multivariable statistical modeling of coronary heart disease, type 2 diabetes, and metabolic disease free. Odds ratios and associated confidence intervals are shown with values and in forest plots. Black boxes indicate odds ratio value, horizontal lines the width of the confidence interval, and the vertical dashed line the line of null effect. Arrows are shown where confidence intervals are exceeding axis limits. MV model was adjusted for sex (whole cohort model only) and age. MV + lifestyle was additionally adjusted for smoking status, alcohol intake, and physical activity. MV + lifestyle + BMI was additionally adjusted for BMI. *Liver PDFF normalized using Box‐Cox transform. ASATi, abdominal adipose tissue index; CHD, coronary heart disease; CI, confidence interval; PDFF, proton density fat fraction; MDF, metabolic disease free; MFI, muscle fat infiltration; OR, odds ratio; T2D, type 2 diabetes; VATi, visceral adipose tissue index.

References

    1. Prentice AM, Jebb SA. Beyond body mass index. Obes Rev 2001;2:141‐147. - PubMed
    1. Neeland IJ, Turer AT, Ayers CR, et al. Body fat distribution and incident cardiovascular disease in obese adults. J Am Coll Cardiol 2015;65:2150‐2151. - PMC - PubMed
    1. Tomiyama AJ, Hunger JM, Nguyen‐Cuu J, Wells C. Misclassification of cardiometabolic health when using body mass index categories in NHANES 2005‐20112. Int J Obes (Lond) 2016;40:883‐886. - PubMed
    1. Thomas EL, Fitzpatrick JA, Malik SJ, Taylor‐Robinson SD, Bell JD. Whole body fat: content and distribution. Prog Nucl Magn Reson Spectrosc 2013;73:56‐80. - PubMed
    1. Schlett CL, Hendel T, Weckbach S, et al. Population‐based imaging and radiomics: rationale and perspective of the German National Cohort MRI Study. Rofo 2016;188:652‐661. - PubMed

Publication types