. 2018 May 1;32(9-10):695-710.
doi: 10.1101/gad.312850.118. Epub 2018 May 21.

SWI/SNF and RSC cooperate to reposition and evict promoter nucleosomes at highly expressed genes in yeast

Affiliations

SWI/SNF and RSC cooperate to reposition and evict promoter nucleosomes at highly expressed genes in yeast

Yashpal Rawal et al. Genes Dev. .

Abstract

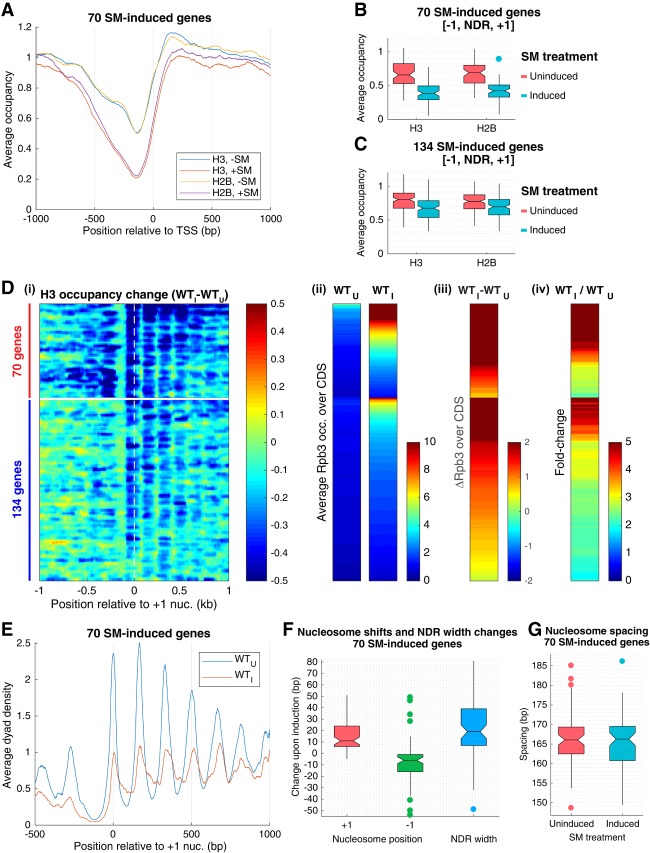
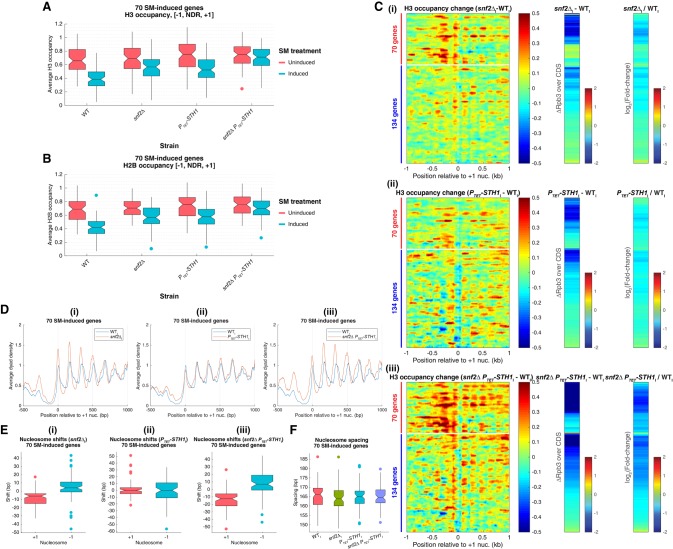
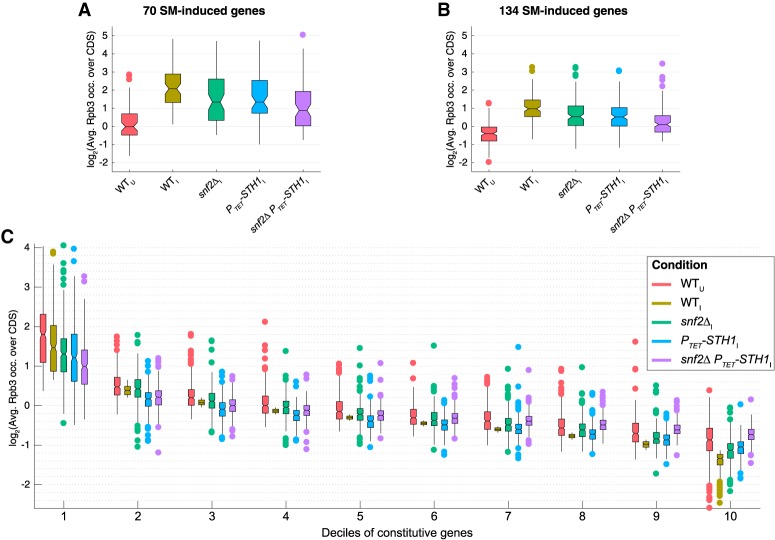
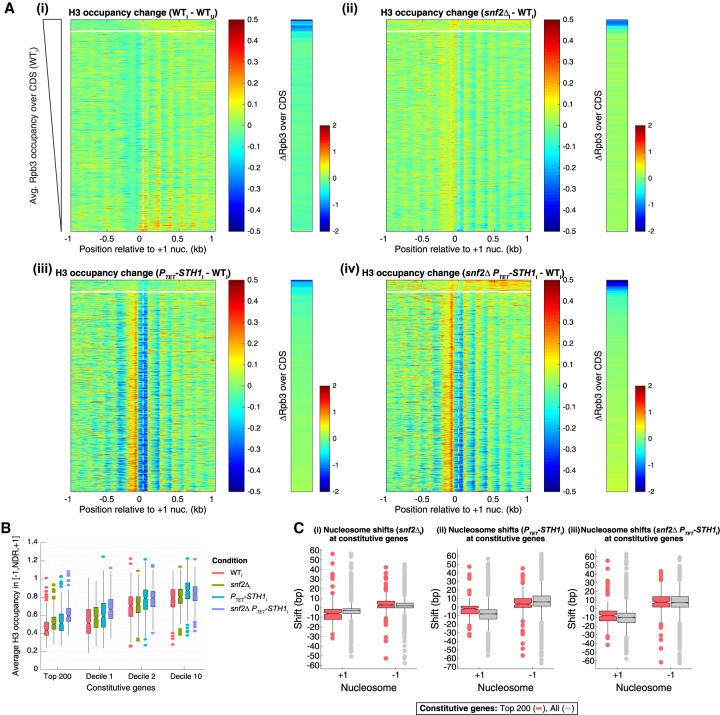
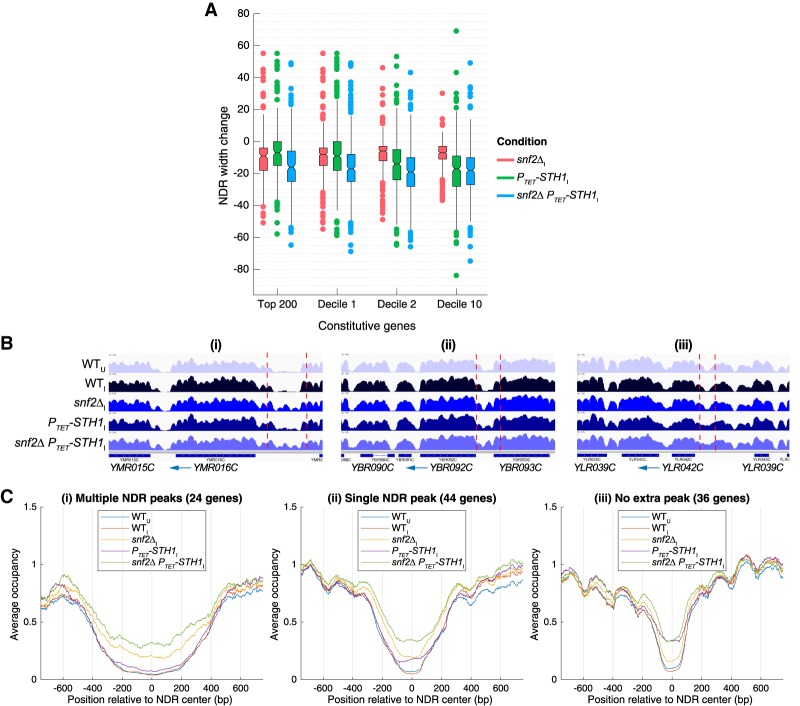
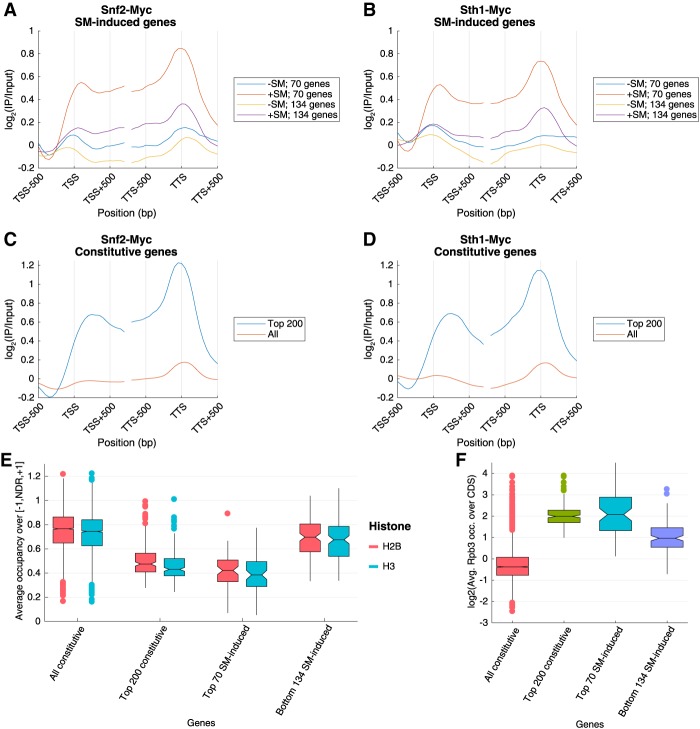
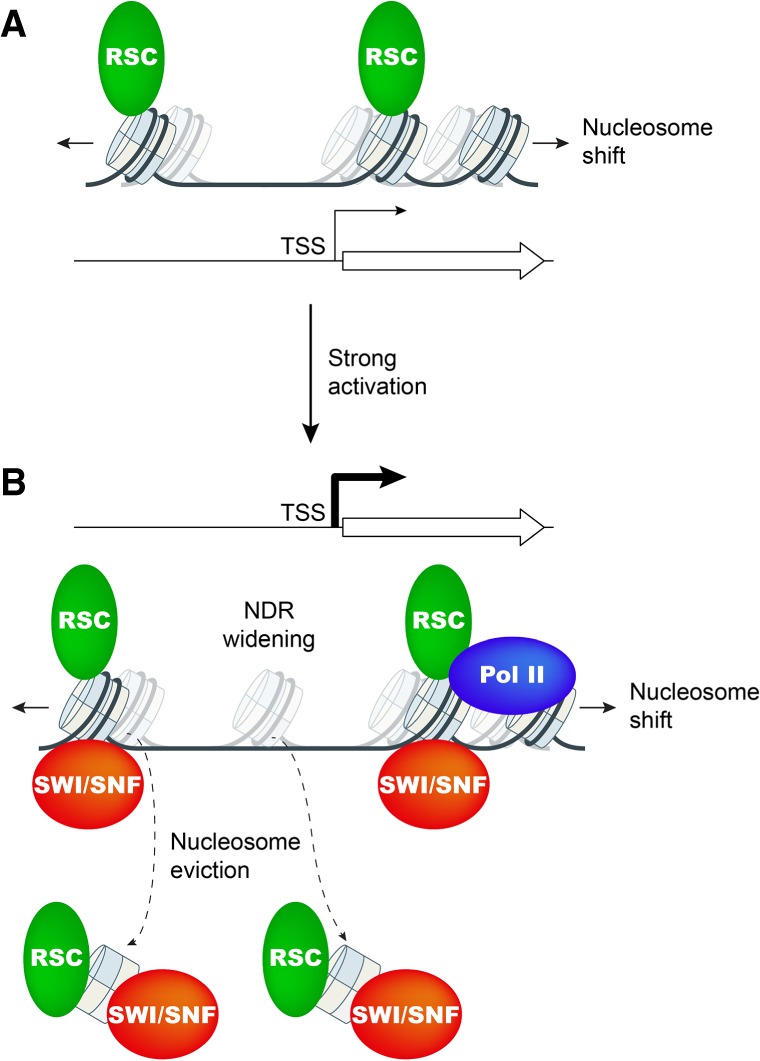
The nucleosome remodeling complex RSC functions throughout the yeast genome to set the positions of -1 and +1 nucleosomes and thereby determines the widths of nucleosome-depleted regions (NDRs). The related complex SWI/SNF participates in nucleosome remodeling/eviction and promoter activation at certain yeast genes, including those activated by transcription factor Gcn4, but did not appear to function broadly in establishing NDRs. By analyzing the large cohort of Gcn4-induced genes in mutants lacking the catalytic subunits of SWI/SNF or RSC, we uncovered cooperation between these remodelers in evicting nucleosomes from different locations in the promoter and repositioning the +1 nucleosome downstream to produce wider NDRs-highly depleted of nucleosomes-during transcriptional activation. SWI/SNF also functions on a par with RSC at the most highly transcribed constitutively expressed genes, suggesting general cooperation by these remodelers for maximal transcription. SWI/SNF and RSC occupancies are greatest at the most highly expressed genes, consistent with their cooperative functions in nucleosome remodeling and transcriptional activation. Thus, SWI/SNF acts comparably with RSC in forming wide nucleosome-free NDRs to achieve high-level transcription but only at the most highly expressed genes exhibiting the greatest SWI/SNF occupancies.

Keywords: RSC; SWI/SNF; nucleosome; transcription; yeast.


Figures

Figure 1.
Figure 1.
Promoter nucleosomes are disassembled and repositioned on SM-induced transcriptional activation. (A) Plots of H3 and H2B occupancies at each base pair, normalized to the average occupancy on the respective chromosome for each gene, calculated from ChIP-seq data of sonicated chromatin, averaged over the 70 SM-induced genes, and aligned to the TSS. (Blue and yellow) WT_U; (red and purple) WT_I. (B,C) Notched box plots of H3 and H2B occupancies per nucleotide in the [−1,NDR,+1] region calculated from ChIP-seq data of sonicated chromatin from at least three replicates of WT_U and WT_I cultures for 70 SM-induced genes (B) and 134 SM-induced genes (C). If the notches of two plots do not overlap, there is 95% confidence that the true medians of the two distributions differ. Each box depicts the interquartile range containing 50% of the data, intersected by the median; the notch indicates a 95% confidence interval (CI) around the median. (D) Heat map depictions of changes in H3 or Rpb3 occupancies upon SM induction of wild-type cells (WTI vs. WTU) calculated from MNase (H3) or (Rpb3) ChIP-seq data for the 204 SM-induced genes, divided between 70 (top) and 134 (bottom) SM-induced genes, and sorted by induced Rpb3 levels for each group. (Panel i) H3 occupancy differences relative to the +1_Nuc dyad. (Panel ii) Rpb3 occupancies averaged over the CDSs in WTU and WTI cells. (Panel iii) Differences in Rpb3. (Panel iv) Rpb3 induction ratios between WTI and WTU cells for the same gene order, color-coded as shown at the right of each panel. (E) Average dyad density from MNase-ChIP-seq data aligned to the +1_Nuc for 70 SM-induced genes. Midpoints (dyads) of nucleosomal size sequences between 120 and 160 bp were determined with respect to the +1_Nuc and summed for 70 genes. Average profiles were smoothed using a moving average filter with a span of 31 bp. The data were normalized internally to the average value for each data set. (F) Box plots depicting shift in +1_Nuc and −1_Nuc positions and change in NDR width for 70 SM-induced genes, calculated from H3 MNase-ChIP-seq data by calculating change in dyad peak position in WTI versus WTU cells for the +1_Nuc and −1_Nuc, respectively. (G). Box plots depicting nucleosome spacing for 70 SM-induced genes in SM-induced or uninduced wild-type cells for the array of +1_Nuc to +5_Nuc, calculated from H3 MNase-ChIP-seq data.
Figure 2.
Figure 2.
SWI/SNF and RSC remodelers cooperate in promoter nucleosome disassembly and repositioning at SM-induced genes. (A,B) Notched box plots of average H3 (A) or H2B (B) occupancies per nucleotide in the [−1,NDR,+1] region, calculated from ChIP-seq data from at least three replicates of the indicated yeast strains for the 70 SM-induced genes. (C) Heat map depictions of changes in H3 occupancies from MNase-ChIP-seq data (left large panels) as well as differences (middle) or fold change (right) in Rpb3 occupancies averaged over CDSs between wild-type and the indicated mutant cultures under inducing conditions for 204 SM-induced genes, sorted and color-coded as in Figure 1D. (D) Average dyad densities calculated from H3 MNase-ChIP-seq data, aligned to the +1_Nuc for 70 SM-induced genes (depicted as in Fig. 1E) between wild type and the indicated mutants under inducing conditions. Average profiles were smoothed using a moving average filter with a span of 31 bp. (E,F). Box plots depicting changes in +1_Nuc and −1_Nuc dyad positions (E) or nucleosome spacing (F)—calculated from H3 MNase-ChIP-seq data for the 70 SM-induced genes—between wild type and the indicated mutants under inducing conditions, determined as in Figure 1, F and G.
Figure 3.
Figure 3.
Both SWI/SNF and RSC are required for robust transcription of highly expressed SM-induced and constitutive genes. (A,B) Notched box plots of log2 values of Rpb3 occupancies averaged over CDSs for the groups of 70 (A) or 134 (B) SM-induced genes or deciles of 3619 constitutive genes sorted in descending order of Rpb3 occupancies in induced cells (C), calculated from at least three biological replicates of the indicated wild-type and mutant yeast strains under inducing (I) or uninducing (U) conditions.
Figure 4.
Figure 4.
SWI/SNF and RSC have comparable complementary roles in NDR formation and promoter nucleosome eviction at highly expressed constitutive genes. (A) Difference maps of H3 occupancies calculated from MNase-ChIP-seq data (left panels) or Rpb3 occupancies averaged over CDSs (right strips) for the indicated culture conditions or strains for the group of 3619 constitutive genes, as in Figure 2C. The most highly expressed 200 genes are above the white line. (B) Notched box plots of average H3 occupancies per nucleotide in the [−1,NDR,+1] region for the top 200 constitutive genes and indicated deciles of 3619 constitutive genes, computed from sonication ChIP-seq data for the indicated yeast strains. (C) Box plots depicting changes in +1_Nuc and −1_Nuc dyad positions calculated from H3 MNase-ChIP-seq data for all 3619 constitutive genes (gray) or the top 200 expressed constitutive genes (red).
Figure 5.
Figure 5.
SWI/SNF and RSC cooperate in NDR widening and blocking nucleosome formation in NDRs of highly expressed genes. (A) Notched box plots of changes in NDR widths calculated from H3 MNase-ChIP-seq data for the indicated strains, the top 200 constitutive genes, and indicated deciles of 3619 constitutive genes as in Figure 4B. (B) Integrated Genomics Viewer (IGV) tracks depicting H3 occupancies from MNase-ChIP-seq data in genomic regions surrounding YMR016C (panel i), YBR092C (panel ii), and YLR042C (panel iii) genes in the indicated yeast strains/conditions. Vertical dashed lines demarcate NDRs discussed in the text. (C) Plots comparing normalized and averaged H3 occupancies from MNase-ChIP-seq reads aligned to the NDR center for constitutive genes selected for exhibiting nucleosome peaks within NDRs in snf2Δ PTET-STH1 cells, plotted separately for subsets of genes displaying multiple (panel i) or single (panel ii) nucleosome peaks in NDRs or NDRs filling without nucleosome peaks (panel iii).
Figure 6.
Figure 6.
Chromatin remodelers SWI/SNF and RSC are enriched at highly expressed genes. Metagene profiles of Snf2-myc (A,C) or Sth1-myc (B,D) occupancies from ChIP–chip analysis in wild-type cells treated or untreated with SM for the groups of 70 or 134 SM-induced genes (A,B) or for either all 3619 constitutive genes or the top 200 expressed constitutive genes (C,D). The log2 (immunoprecipitation/input) values are aligned to the TSS or the transcription termination site (TTS) and shown for 500 bp surrounding the TSS/TTS. (E,F) Notched box plots of average H3 and H2B occupancies per nucleotide in [−1,NDR,+1] regions (E) and log2 values of Rpb3 occupancies averaged over CDSs (F) for the indicated gene sets from ChIP-seq data from at least three replicates of WTI cells are shown.
Figure 7.
Figure 7.
Model for cooperation between chromatin remodelers SWI/SNF and RSC in promoter nucleosome disassembly and repositioning at highly expressed genes. (A) At weakly expressed genes, relatively low levels of RSC (green oval) suffice to maintain wild-type NDR formation primarily by keeping nucleosomes (sectored cylinders) from crossing NDR boundaries. Cylinders with faint shades indicate nucleosome positions in cells depleted of functional RSC (Sth1). (B) Upon gene activation by Gcn4 or at highly expressed constitutive genes, SWI/SNF (red oval) and RSC are actively recruited and cooperate in evicting and repositioning the −1_Nuc and +1_Nuc to both widen the NDR and keep nucleosomes from assembling there. Cylinders with faint shades indicate nucleosome positions in cells lacking SWI/SNF or depleted of RSC. Pol II may also contribute to eviction of +1_Nucs.

References

    1. Adkins MW, Williams SK, Linger J, Tyler JK. 2007. Chromatin disassembly from the PHO5 promoter is essential for the recruitment of the general transcription machinery and coactivators. Mol Cell Biol 27: 6372–6382. - PMC - PubMed
    1. Ansari SA, Paul E, Sommer S, Lieleg C, He Q, Daly AZ, Rode KA, Barber WT, Ellis LC, LaPorta E, et al. 2014. Mediator, TATA-binding protein, and RNA polymerase II contribute to low histone occupancy at active gene promoters in yeast. J Biol Chem 289: 14981–14995. - PMC - PubMed
    1. Badis G, Chan ET, van Bakel H, Pena-Castillo L, Tillo D, Tsui K, Carlson CD, Gossett AJ, Hasinoff MJ, Warren CL, et al. 2008. A library of yeast transcription factor motifs reveals a widespread function for Rsc3 in targeting nucleosome exclusion at promoters. Mol Cell 32: 878–887. - PMC - PubMed
    1. Barbaric S, Luckenbach T, Schmid A, Blaschke D, Horz W, Korber P. 2007. Redundancy of chromatin remodeling pathways for the induction of the yeast PHO5 promoter in vivo. J Biol Chem 282: 27610–27621. - PubMed
    1. Boeger H, Griesenbeck J, Strattan JS, Kornberg RD. 2003. Nucleosomes unfold completely at a transcriptionally active promoter. Mol Cell 11: 1587–1598. - PubMed

Publication types

MeSH terms

LinkOut - more resources