. 2019 Jan;26(2):213-228.
doi: 10.1038/s41418-018-0124-5. Epub 2018 May 21.

MPTP-driven NLRP3 inflammasome activation in microglia plays a central role in dopaminergic neurodegeneration

Affiliations

MPTP-driven NLRP3 inflammasome activation in microglia plays a central role in dopaminergic neurodegeneration

Eunju Lee et al. Cell Death Differ. 2019 Jan.

Abstract

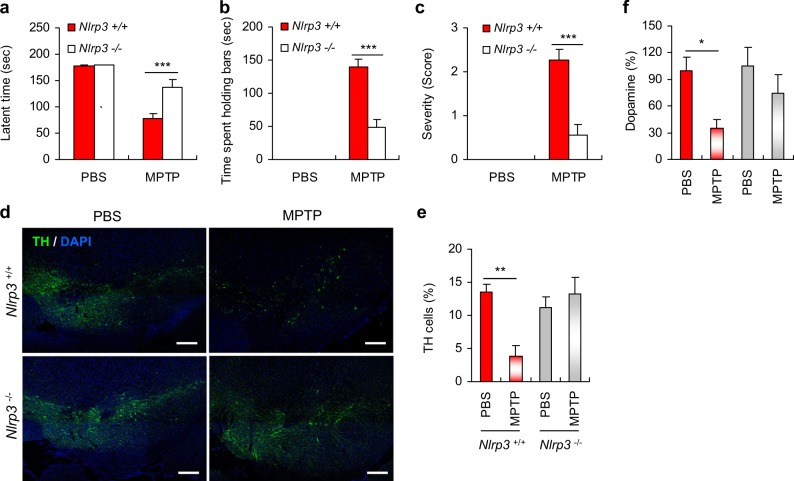
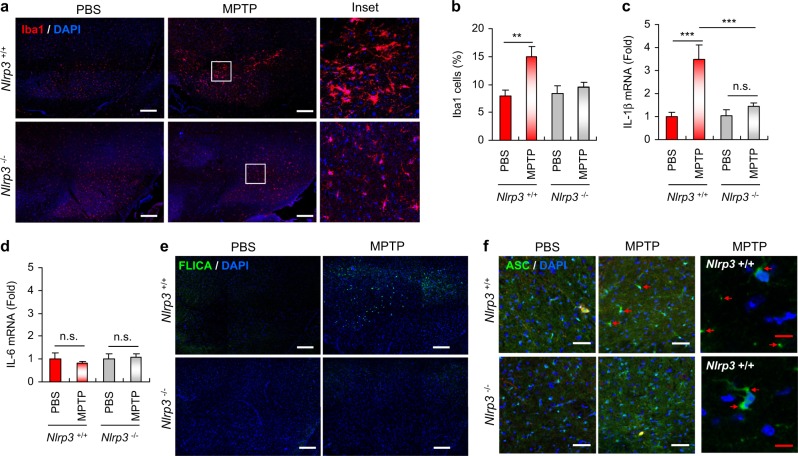
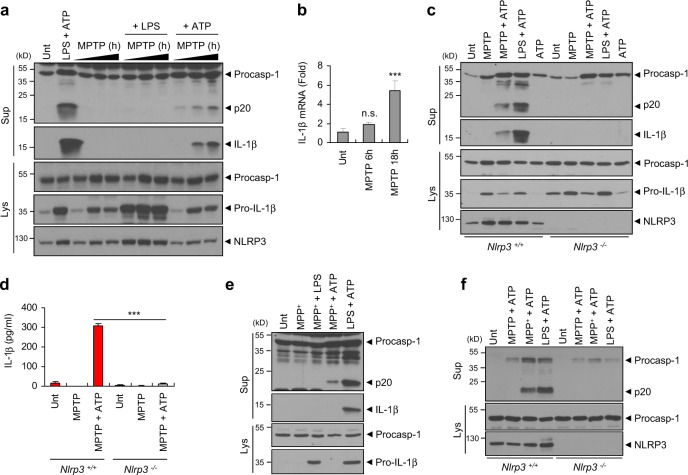
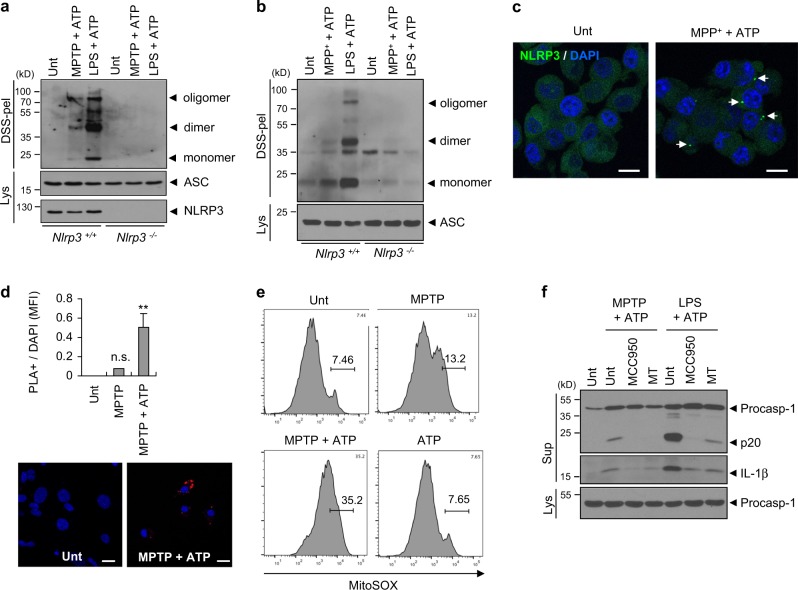
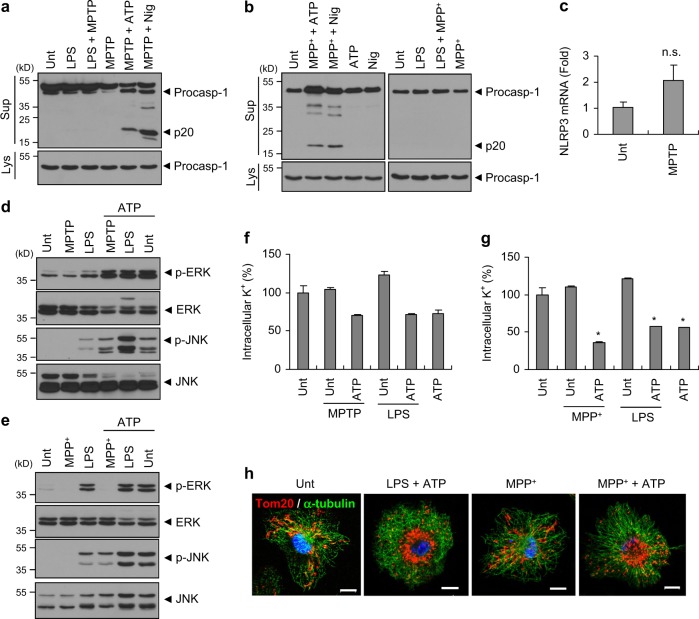
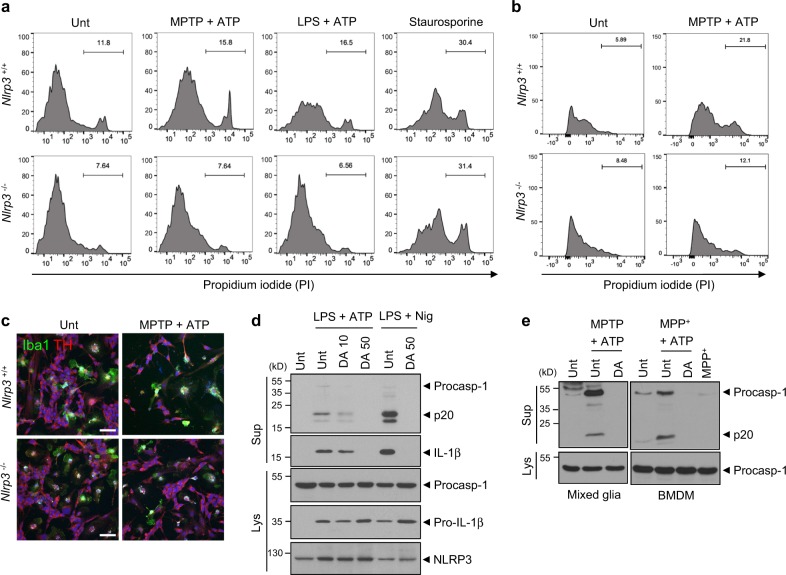
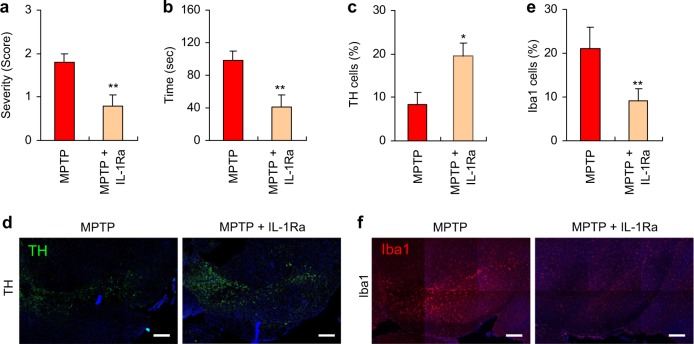
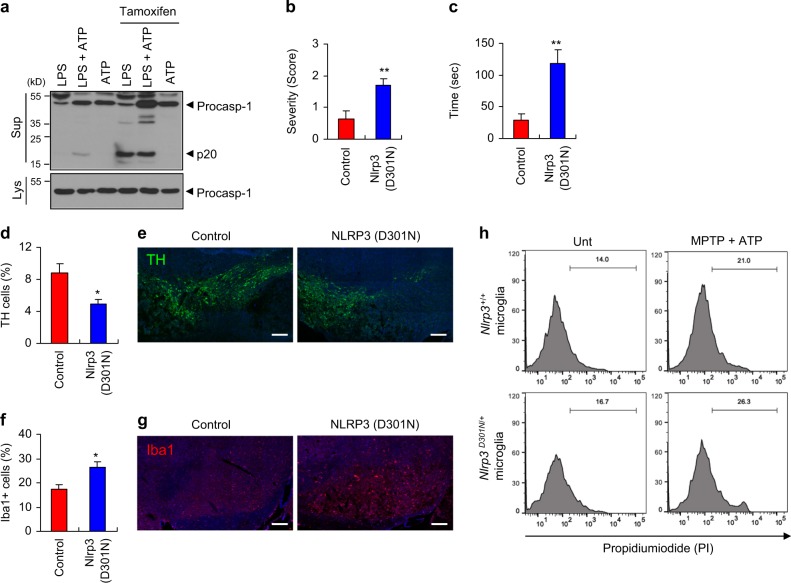
Parkinson's disease (PD) is a progressive neurodegenerative disease characterized by the loss of dopaminergic neurons in the substantia nigra (SN) and the reduction of dopamine levels in the striatum. Although details of the molecular mechanisms underlying dopaminergic neuronal death in PD remain unclear, neuroinflammation is also considered a potent mediator in the pathogenesis and progression of PD. In the present study, we present evidences that microglial NLRP3 inflammasome activation is critical for dopaminergic neuronal loss and the subsequent motor deficits in the 1-methyl-4-phenyl-1,2,3,6-tetrahydropyridine (MPTP) mouse model of PD. Specifically, NLRP3 deficiency significantly reduces motor dysfunctions and dopaminergic neurodegeneration of MPTP-treated mice. Furthermore, NLRP3 deficiency abolishes MPTP-induced microglial recruitment, interleukin-1β production and caspase-1 activation in the SN of mouse brain. In primary microglia and mixed glial cell cultures, MPTP/ATP treatment promotes the robust assembly and activation of the NLRP3 inflammasome via producing mitochondrial reactive oxygen species. Consistently, 1-methyl-4-phenyl-pyridinium (MPP+) induces NLRP3 inflammasome activation in the presence of ATP or nigericin treatment in mouse bone-marrow-derived macrophages. These findings reveal a novel priming role of neurotoxin MPTP or MPP+ for NLRP3 activation. Subsequently, NLRP3 inflammasome-active microglia induces profound neuronal death in a microglia-neuron co-culture model. Furthermore, Cx3Cr1CreER-based microglia-specific expression of an active NLRP3 mutant greatly exacerbates motor deficits and dopaminergic neuronal loss of MPTP-treated mice. Taken together, our results indicate that microglial NLRP3 inflammasome activation plays a pivotal role in the MPTP-induced neurodegeneration in PD.


Conflict of interest statement

The authors declare that they have no conflict of interest.

Figures

Fig. 1
Fig. 1
NLRP3 deficiency attenuates motor dysfunctions and dopaminergic neuronal loss in MPTP-treated mice. ac Nlrp3+/+ or Nlrp3−/− mice were administered with PBS or MPTP (40 mg/kg) for 5 days and then examined for motor activity impairment as described in the Methods. a The latent time to hold the bar in the string test 24 h post the final PBS or MPTP administration (Nlrp3+/+ mice, PBS (n = 6), MPTP (n = 10); Nlrp3−/− mice, PBS (n = 6), MPTP (n = 11)). b The latent time to hold the bar in the catalepsy test 1 h post the final PBS or MPTP administration. (PBS (n = 6), MPTP (n = 11)). c The severity of hindlimb clasping in PBS- (n = 6) or MPTP-treated (n = 11) mice 1 h post the final PBS or MPTP administration. d Representative immunofluorescence image of the fixed brain sections containing SN of PBS- or MPTP-treated Nlrp3+/+ or Nlrp3−/− mice after staining with anti-TH antibody (green). DAPI represents the nuclear signal (blue). Scale bars, 200 μm. e Quantification of relative TH-positive cells per DAPI in confocal images of PBS- or MPTP-treated Nlrp3 +/+ or Nlrp3−/− mice (n = 4). f Quantification of striatal dopamine levels of PBS- or MPTP-treated Nlrp3+/+ or Nlrp3−/− mice as determined by HPLC-MS/MS (Nlrp3+/+ mice, PBS (n = 11), MPTP (n = 11); Nlrp3−/− mice, PBS (n = 11), MPTP (n = 10)). Data were expressed as the mean ± SEM. Asterisks indicate significant differences (*P < 0.05, **P < 0.01, ***P < 0.001)
Fig. 2
Fig. 2
NLRP3 deficiency attenuates MPTP-induced microglial recruitment and caspase-1 activation in the SN of mouse brain. a Representative immunofluorescence image of the SN in mouse brain sections stained with anti-Iba1 antibody (red). DAPI represents the nuclear signal (blue). Scale bars, 200 μm. Magnified immunofluorescence images of the boxed areas in the middle panel are displayed in the right panel. b Quantification of relative Iba1-positive cells per DAPI in confocal images of PBS- or MPTP-treated Nlrp3+/+ or Nlrp3−/− mice (n = 4). c, d Quantification of IL-1β (c) or IL-6 (d) mRNA levels in the SN of PBS- or MPTP-treated Nlrp3+/+ or Nlrp3−/− mice. (Nlrp3+/+ mice, PBS (n = 9), MPTP (n = 9 (c) or 8 (d)); Nlrp3−/− mice, PBS (n = 7), MPTP (n = 9)). e Representative immunofluorescence image of brain sections containing SN stained with FLICA. DAPI represents the nuclear signal. Scale bars, 200 μm. f Representative immunofluorescence image of substantia nigra pars reticulata (SNr) regions of PBS- or MPTP-treated Nlrp3+/+ or Nlrp3−/− mice stained with anti-ASC antibody (green). DAPI represents the nuclear signal. Scale bars (white), 50 μm. Enlarged immunofluorescence images of SNr regions of MPTP-treated Nlrp3+/+ mice were displayed in the right panel. Scale bars (red), 10 μm. Red arrows indicate ASC specks. Data were expressed as the mean ± SEM. Asterisks indicate significant differences (**P < 0.01, ***P < 0.001, n.s. not significant)
Fig. 3
Fig. 3
MPTP or MPP+ treatment promotes the activation of the NLRP3 inflammasome. a Immunoblots from mouse mixed glial cell cultures untreated (Unt) or primed with LPS (0.25 μg ml−1, 3 h), followed by ATP (2.5 mM, 40 min), or treated with MPTP (40 μM) for 6, 12 or 18 h in the presence of LPS (final 3 h) or ATP (final 40 min). b Cellular levels of IL-1β mRNA in mouse mixed glial cells untreated or treated with MPTP (40 μM) for 6 or 18 h (n = 4). c Immunoblots from Nlrp3+/+ or Nlrp3−/− mouse microglia treated with MPTP (40 μM, 16 h), followed by ATP treatment (2.5 mM, 30 min), or primed with LPS (0.25 μg ml−1, 3 h), followed by ATP (2.5 mM, 30 min). d Quantification of IL-1β in the culture supernatants of Nlrp3+/+ or Nlrp3−/− mice microglia treated with MPTP (40 μM, 16 h), followed by ATP treatment (2.5 mM, 30 min) (n = 3). e Immunoblots from mouse BMDMs treated with MPP+ (40 μM, 16 h), followed by ATP (2.5 mM, 30 min) or LPS treatment (0.25 μg ml−1, 3 h), or primed with LPS (0.25 μg ml−1, 3 h), followed by ATP (2.5 mM, 30 min). f Immunoblots from Nlrp3+/+ or Nlrp3−/− mice BMDMs treated with MPTP or MPP+ (100 μM,6 h), followed by ATP (2 mM, 45 min), or primed with LPS (0.25 μg ml−1, 3 h), followed by ATP (2 mM, 45 min). a, c, ef Culture supernatants (Sup) or cellular lysates (Lys) were immunoblotted with the indicated antibodies. Data were expressed as the mean ± SEM. Asterisks indicate significant differences (***P < 0.001, n.s. not significant)
Fig. 4
Fig. 4
MPTP or MPP+ treatment promotes the assembly of the NLRP3 inflammasome. a Immunoblots of disuccinimidyl suberate (DSS)-crosslinked pellets (DSS-pel) or cellular lysates (Lys) from microglia treated with MPTP (40 μM, 16 h) or LPS (0.25 μg ml−1, 3 h), followed by the treatment of ATP (2 mM, 45 min). b Immunoblots of DSS-crosslinked pellets (DSS-pel) or cellular lysates (Lys) from BMDMs treated with MPP+ (100 μM, 6 h) or LPS (0.25 μg ml−1, 3 h), followed by the treatment of ATP (2 mM, 45 min). c Confocal images of NLRP3-GFP-expressing BMDMs untreated or treated with MPP+ (50 μM, 10 h) in the presence of ATP (2 mM, 30 min). Arrows indicate speck-like aggregates of NLRP3 protein (green). DAPI represents the nuclear signal (blue). Scale bars, 10 μm. d Proximity ligation assay of NLRP3 and ASC in mixed glial cells treated with MPTP (40 μM, 16 h), followed by the treatment of ATP (2 mM, 30 min). Proximity ligation (PL) signals (red) represent the molecular association of NLRP3 and ASC. Data are shown as a representative image from four or five independent samples (lower panel). Scale bars, 10 μm. The relative intensity of PL signals (per DAPI signals) was determined and is displayed in the upper panel (n = 4, 5). Data were expressed as the mean ± SEM. Asterisk indicates significant differences (**P < 0.01, n.s. not significant). e Flow cytometric analysis of mixed glial cells treated with MPTP (40 μM, 18 h) and ATP (2.5 mM, final 30 min) after staining with MitoSOX. f Immunoblots from mixed glial cells treated with MPTP (40 μM, 16 h) or LPS (0.25 μg/ml, 3 h) in the presence of MCC950 (50 nM) or Mito-TEMPO (MT, 200 μM), followed by ATP (2.5 mM, 30 min) treatment. a, b, f Culture supernatants (Sup), cellular lysates (Lys), or DSS-crosslinked pellets (DSS-pel) were analyzed by immunoblot
Fig. 5
Fig. 5
MPTP or MPP+ treatment alone does not induce the activation of mitogen-activated protein kinases and the efflux of potassium. a Immunoblots from mouse mixed glial cells untreated (Unt) or primed with LPS (0.25 μg ml−1, 3 h), followed by MPTP (40 μM, 14 h), or primed with MPTP, followed by ATP (2 mM, 40 min) or nigericin (5 μM, 45 min) treatment. b Immunoblots from mouse BMDMs untreated (Unt) or primed with MPP+ (100 μM, 6 h), followed by ATP (2.5 mM, 45 min) or nigericin (5 μM, 45 min, left panel), or primed with LPS (0.25 μg ml−1, 3 h), followed by MPP+ (100 μM, 6 h, right panel). c Cellular levels of NLRP3 mRNA in mouse mixed glial cells untreated or treated with MPTP (40 μM) for 18 h. (n = 7). d, e Immunoblots from mixed glial cells (d) or BMDMs (e) untreated or treated with MPTP (40 μM, 10 h, (d)), MPP+ (100 μM, 6 h, (e)) or LPS (0.25 μg ml−1, 3 h), followed by ATP treatment (2 mN, 40 min). a, b, d, e Culture supernatants (Sup) or cellular lysates (Lys) were immunoblotted with the indicated antibodies. f, g Intracellular K+ levels of mixed glial cells (f) or BMDMs (g) untreated or primed with MPTP (40 μM, 16 h, (f)), MPP+ (100 μM, 6 h, (g)) or LPS (0.25 μg ml−1, 3 h), followed by ATP (2 mM, 40 min) (n = 2, (f); n = 2, (g)). Asterisks indicate significant differences compared with untreated group (*P < 0.05). h Representative immunofluorescence images of mouse BMDMs untreated or treated with LPS (0.25 μg ml−1, 3 h), MPP+ (100 μM, 6 h), followed by ATP (2 mM, 40 min) treatment as stained with anti-Tom20 (red) and anti-α-tubulin (green) antibodies. DAPI represents the nuclear signal (blue). Scale bars, 10 μm
Fig. 6
Fig. 6
Microglial inflammasome activation mediates the death of dopaminergic neurons in a NLRP3-dependent manner. a Flow cytometric analysis of co-cultured microglia and SH-SY5Y cells treated with MPTP (40 μM, 16 h) or LPS (0.25 μg ml−1, 3 h), followed by the treatment with ATP (2.5 mM, 15 min), replenished with fresh medium and incubated for additional 24 h, or treated with staurosporine (1 μg ml−1, 16 h) after staining with anti-CD45 antibody and PI. The PI histograms of CD45-negative SH-SY5Y cells were displayed. b Flow cytometric analysis of co-cultured microglia and MN9D cells treated with MPTP (40 μM, 16 h), followed by the treatment with ATP (2.5 mM, 1 h) after staining with anti-CD45 antibody and PI. The PI histograms of CD45-negative MN9D cells were displayed. c Representative immunofluorescence images of co-cultured microglia and SH-SY5Y cells treated with MPTP (40 μM, 16 h), followed by treatment with ATP (2.5 mM, 15 min) after staining with anti-Iba1 (green) and anti-TH (red) antibodies. DAPI represents the nuclear signal (blue). Scale bars, 50 μm. d Immunoblots from mixed glial cells treated with LPS (0.25 μg ml−1, 3 h) in the presence of dopamine (10 or 50 μg ml−1, 30 min pretreatment before LPS), followed by ATP (2.5 mM, 30 min) or nigericin (Nig, 5 μM, 45 min) treatment. e Immunoblots from mixed glial cells (left) or BMDMs (right) treated with MPTP (40 μM, 16 h, left) or MPP+ (100 μM, 6 h, right) in the presence of dopamine (50 μg ml−1, 30 min pretreatment), followed by ATP (2 mM, 40 min) treatment. Culture supernatants (Sup) or cellular lysates (Lys) were immunoblotted with the indicated antibodies
Fig. 7
Fig. 7
Administration of interleukin-1 receptor antagonist attenuates motor dysfunctions and dopaminergic neuronal loss in MPTP-treated mice. a The severity of hindlimb clasping in MPTP-treated mice with or without IL-1Ra administration (n = 10). b The latent time to hold the bar in the catalepsy test in MPTP-treated mice with or without IL-1Ra administration (n = 10). c Quantification of relative TH-positive cells per DAPI in the confocal images as shown in (d) (n = 5). e Quantification of relative Iba1-positive cells in the confocal images as shown in f based on DAPI staining (n = 4 or 5). d, f Representative immunofluorescence image of the fixed brain sections containing the SN of MPTP-treated mice with or without IL-1Ra administration after staining with anti-TH antibody (green, d) or anti-Iba1 antibody (red, f). DAPI represents the nuclear signal (blue). Scale bars, 200 μm. Data were expressed as the mean ± SEM. Asterisks indicate significant differences (*P < 0.05, **P < 0.01)
Fig. 8
Fig. 8
Conditional expression of NLRP3 active mutant in microglia exacerbates motor dysfunctions and dopaminergic neuronal loss in MPTP-treated mice. a Immunoblots from Cx3Cr1Cre-ER/+Nlrp3D301NneoR/+ mouse mixed glial cells treated with tamoxifen (1 μM, 24 h), replenished with the medium containing LPS (0.25 μg ml−1, 3 h), followed by ATP (2 mM, 40 min). bg Control (Cx3Cr1Cre-ER/Cre-ERNlrp3+/+) or NLRP3 mutant mice (Cx3Cr1Cre-ER/+Nlrp3D301NneoR/+) were treated with tamoxifen for 5 days, followed by the administration of MPTP for additional 3 days. b The severity of hindlimb clasping in MPTP-treated control or Nlrp3 (D301N)-expressing mice. (control, n = 8; Nlrp3 (D301N), n = 7). c The latent time to hold the bar in the catalepsy test in MPTP-treated control or Nlrp3 (D301N)-expressing mice (control, n = 8; Nlrp3 (D301N), n = 7). d Quantification of relative TH-positive cells per DAPI in the confocal images as shown in (e) (control, n = 5; Nlrp3 (D301N), n = 3). f Quantification of relative Iba1-positive cells per DAPI in the confocal images as shown in (g) (control, n = 5; Nlrp3 (D301N), n = 3). e, g Representative immunofluorescence image of the fixed brain sections containing the SN of MPTP-treated control or Nlrp3 (D301N)-expressing mice following tamoxifen treatment after staining with anti-TH antibody (green, e) or anti-Iba1 antibody (red, g). DAPI represents the nuclear signal (blue). Scale bars, 200 μm. h Cx3Cr1Cre-ER/Cre-ERNlrp3+/+ or Cx3Cr1Cre-ER/+Nlrp3D301NneoR/+ mice microglia was treated with tamoxifen (1 μM, 24 h), and co-cultured with SH-SY5Y cells. Flow cytometric analysis of co-cultured Nlrp3+/+ or Nlrp3D301N/+ microglia and SH-SY5Y cells treated with MPTP (40 μM, 16 h), followed by the treatment with ATP (2.5 mM, 15 min), replenished with fresh medium and incubated for additional 24 h, after staining with anti-CD45 antibody and PI. The PI histograms of CD45-negative SH-SY5Y cells were displayed. Data were expressed as the mean ± SEM. Asterisks indicate significant differences (*P < 0.05, **P < 0.01)

Similar articles

Cited by

References

    1. Michel PP, Hirsch EC, Hunot S. Understanding dopaminergic cell death pathways in Parkinson disease. Neuron. 2016;90:675–91. doi: 10.1016/j.neuron.2016.03.038. - DOI - PubMed
    1. Poewe W, Seppi K, Tanner CM, Halliday GM, Brundin P, Volkmann J, et al. Parkinson disease. Nat Rev Dis Prim. 2017;3:17013. doi: 10.1038/nrdp.2017.13. - DOI - PubMed
    1. Spillantini MG, Schmidt ML, Lee VM, Trojanowski JQ, Jakes R, Goedert M. Alpha-synuclein in Lewy bodies. Nature. 1997;388:839–40. doi: 10.1038/42166. - DOI - PubMed
    1. Crowther RA, Daniel SE, Goedert M. Characterisation of isolated alpha-synuclein filaments from substantia nigra of Parkinson’s disease brain. Neurosci Lett. 2000;292:128–30. doi: 10.1016/S0304-3940(00)01440-3. - DOI - PubMed
    1. Lashuel HA, Overk CR, Oueslati A, Masliah E. The many faces of alpha-synuclein: from structure and toxicity to therapeutic target. Nat Rev Neurosci. 2013;14:38–48. doi: 10.1038/nrn3406. - DOI - PMC - PubMed

Publication types

MeSH terms