. 2019 Mar;26(3):409-425.
doi: 10.1038/s41418-018-0126-3. Epub 2018 May 21.

TP53 gain-of-function mutation promotes inflammation in glioblastoma

Affiliations

TP53 gain-of-function mutation promotes inflammation in glioblastoma

Seok Won Ham et al. Cell Death Differ. 2019 Mar.

Abstract

Glioblastoma (GBM), the most severe and common brain tumor in adults, is characterized by multiple somatic mutations and aberrant activation of inflammatory responses. Immune cell infiltration and subsequent inflammation cause tumor growth and resistance to therapy. Somatic loss-of-function mutations in the gene encoding tumor suppressor protein p53 (TP53) are frequently observed in various cancers. However, numerous studies suggest that TP53 regulates malignant phenotypes by gain-of-function (GOF) mutations. Here we demonstrate that a TP53 GOF mutation promotes inflammation in GBM. Ectopic expression of a TP53 GOF mutant induced transcriptomic changes, which resulted in enrichment of gene signatures related to inflammation and chemotaxis. Bioinformatics analyses revealed that a gene signature, upregulated by the TP53 GOF mutation, is associated with progression and shorter overall survival in GBM. We also observed significant correlations between the TP53 GOF mutation signature and inflammation in the clinical database of GBM and other cancers. The TP53 GOF mutant showed upregulated C-C motif chemokine ligand 2 (CCL2) and tumor necrosis factor alpha (TNFA) expression via nuclear factor kappa B (NFκB) signaling, consequently increasing microglia and monocyte-derived immune cell infiltration. Additionally, TP53 GOF mutation and CCL2 and TNFA expression correlated positively with tumor-associated immunity in patients with GBM. Taken together, our findings suggest that the TP53 GOF mutation plays a crucial role in inflammatory responses, thereby deteriorating prognostic outcomes in patients with GBM.


Conflict of interest statement

The authors declare that they have no conflict of interest.

Figures
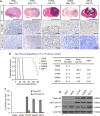
Fig. 1
Fig. 1
The distinct histological features of patient-derived GBM are associated with p53 expression. a Representative images of H&E staining and IHC. The date displayed above each photo indicates the time of mouse sacrifice. b Tumor forming capacities of patient-derived GBM. A Kaplan–Meier survival plot of mice grafted with the same number of each GBM cell lines (left), and a table displaying the mean overall survival (right). c Quantification of IHC provided in a. d Western blot analysis for total p53, phosphorylated p53 (p-p53, ser15), and p21CIP1. Representative microscopic images of H&E and IHC are magnified 6× (scale bar = 5 mm) and 200× (scale bar = 100 μm), respectively. The bar graph represents the mean ± SEM
Fig. 2
Fig. 2
Targeted sequence analysis shows TP53 LOF mutations in patient-derived GBM cell lines. a Western blot analysis for total p53, p-p53 (ser15), and p21CIP1 after treatment with 10 Gy IR. b qPCR analysis, showing mRNA expression of CDKN1A and PUMA after treatment with 10 Gy IR. c qPCR analysis, showing CDKN1A mRNA level after treatment with 10 Gy IR. d qPCR analysis, showing mRNA expression of Cdkn1a after treatment with 10 Gy IR, in Tp53-/- astrocytes transduced with TP53WT or TP53R248L. eWestern blot analysis for total p53, p-p53 (ser15), and p21CIP1 after treatment with 10 Gy IR, in Tp53-/- astrocytes transduced with TP53WT or TP53R248L. The bar graph data represent the mean ± SEM (*P < 0.05; **P < 0.01; ***P < 0.001, n = 3)
Fig. 3
Fig. 3
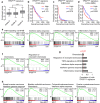
TP53R248L mutation promotes the progression of GBM and enriches inflammation-related signatures. a Tumor grade-dependent enrichment of the TP53R248L signature in patients with low-grade glioma or GBM (***P < 0.001; one-way ANOVA). bd Kaplan–Meier survival plots showing the overall survival of patients with respect to the TP53R248L signature enrichment. e GSEA demonstrating the enrichment of inflammation-related signatures in TP53R248L-overexpressing 19NS GBM cell line. f GSEA showing the enrichment of chemotaxis-associated signatures in TP53R248L-overexpressing 19NS GBM cell line. g Correlations between TP53R248L signature and inflammation/chemotaxis-related signatures in the TCGA GBM patient expression dataset. h GSEA showing the enrichment of inflammation/chemotaxis-related signatures in various types of cancer with TP53 DNA binding domain (DBD)-mutated (MUT) or non-mutated (non-MUT)
Fig. 4
Fig. 4
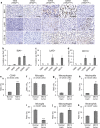
TP53R248L xenograft tumor shows high immune cell population infiltration. a Representative IHC images showing immune cell markers including IBA1, Ly6G, and CD11b. Three mice per cell lines were used except for 19NS. Brain tumor tissue from one mouse was used for 19NS because of its low tumor-forming ability (Fig. 1b). Representative microscope images are magnified 200× (scale bar = 100 μm). bd Quantification of IHC for the composition of IBA1+, Ly6G+, and CD11b+ immune cells, respectively. ek Flow cytometry measurement of immune cell composition in the MD13 xenograft brain tumor and normal brain. Dot plots showing the results of the flow cytometry analyses are shown in Supplementary Fig. S5. The bar graphs represent the mean ± SEM. N indicates no detection
Fig. 5
Fig. 5
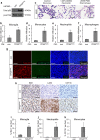
Ectopic expression of TP53R248L promotes immune cell infiltration. a Western blot analysis showing p53 expression in TP53R248L-overexpressing U87MG cell line. b Relative infiltration rate of BV2 microglia grown in conditioned medium (CM) generated using control U87MG and TP53R248L-overexpressing U87MG cell lines (n = 3). c Differentiation of HL60 to neutrophils and macrophages was confirmed by Diff-Quik staining (magnification 400×, scale bar = 50 μm). df Relative infiltration rate of HL60-derived monocytes, neutrophils, and macrophages grown in CM from control U87MG and TP53R248L-overexpressing U87MG cell lines (n = 3). g Representative microscopic images of fluorescent IHC showing total p53 and p-p53 (ser15) in orthotopically transplanted tumors generated using TP53R248L-overexpressing U87MG cell line (magnification 200×, scale bar = 100 μm). h Representative microscopic images of IHC showing expression of immune cell markers such as IBA1, Ly6G, and CD11b (magnification 200×, scale bar = 100 μm). ik Quantification of IHC showing the composition of IBA1+, Ly6G+, and CD11b+ cells. The bar graphs represent mean ± SEM (*P < 0.05; **P < 0.01; ***P < 0.001)
Fig. 6
Fig. 6
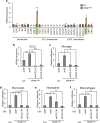
TP53R248L promotes immune cell infiltration by upregulating CCL2 and TNFA. a qPCR analysis showing expression of chemoattractive cytokines in TP53R248L-overexpressing U87MG cell line. b qPCR analysis confirming shRNA-mediated knockdown of CCL2 in TP53R248L-overexpressing U87MG cell line. shNT indicates non-targeting control shRNA. cf Relative infiltration rate of BV2 microglia, HL60-derived monocytes, neutrophils, and macrophages grown in CM from a TP53R248L-overexpressing U87MG cell line with or without CCL2 knockdown, and control counterpart cells. The bar graphs represent mean ± SEM (*P < 0.05; **P < 0.01; ***P < 0.001; n = 3)
Fig. 7
Fig. 7
CCL2 and TNFA, induced by TP53R248L, affect patient prognosis and tumor-associated myeloid signatures. a, b Kaplan–Meier survival plots showing overall survival of patients with respect to CCL2 expression and enrichment of TNFA signaling via NFκB signature. c, d Correlation between CCL2 expression and enrichment scores of the TP53R248L signature, and TNFA signaling via NFκB signature. e Correlations between TP53R248L signature and inflammation/chemotaxis-related signatures. f, g Correlations between the TP53R248L signature and expression of TAN-related and TAM-related genes. All bioinformatics analyses were performed with the TCGA GBM patient gene set. h Quantification of IHC for CD45, IBA1, CCL2, and TNFα in the patient-derived GBM tissues, grouped by p53 levels (*P < 0.05; ***P < 0.001; n = 10 for each group)

Similar articles

Cited by

References

    1. Omuro A, DeAngelis LM. Glioblastoma and other malignant gliomas: a clinical review. J Am Med Assoc. 2013;310:1842–50. doi: 10.1001/jama.2013.280319. - DOI - PubMed
    1. Ostrom QT, Gittleman H, Liao P, Rouse C, Chen Y, Dowling J, et al. CBTRUS statistical report: primary brain and central nervous system tumors diagnosed in the United States in 2007–2011. Neuro Oncol. 2014;16:iv1–63. doi: 10.1093/neuonc/nou223. - DOI - PMC - PubMed
    1. Brennan CW, Verhaak RG, McKenna A, Campos B, Noushmehr H, Salama SR, et al. The somatic genomic landscape of glioblastoma. Cell. 2013;155:462–77. doi: 10.1016/j.cell.2013.09.034. - DOI - PMC - PubMed
    1. Verhaak RG, Hoadley KA, Purdom E, Wang V, Qi Y, Wilkerson MD, et al. Integrated genomic analysis identifies clinically relevant subtypes of glioblastoma characterized by abnormalities in PDGFRA, IDH1, EGFR, and NF1. Cancer Cell. 2010;17:98–110. doi: 10.1016/j.ccr.2009.12.020. - DOI - PMC - PubMed
    1. Chinot OL, Wick W, Mason W, Henriksson R, Saran F, Nishikawa R, et al. Bevacizumab plus radiotherapy–temozolomide for newly diagnosed glioblastoma. N Engl J Med. 2014;370:709–22. doi: 10.1056/NEJMoa1308345. - DOI - PubMed

Publication types

Substances