. 2019 Mar;26(3):426-442.
doi: 10.1038/s41418-018-0129-0. Epub 2018 May 21.

c-Myc inhibits myoblast differentiation and promotes myoblast proliferation and muscle fibre hypertrophy by regulating the expression of its target genes, miRNAs and lincRNAs

Affiliations

c-Myc inhibits myoblast differentiation and promotes myoblast proliferation and muscle fibre hypertrophy by regulating the expression of its target genes, miRNAs and lincRNAs

Wen Luo et al. Cell Death Differ. 2019 Mar.

Abstract

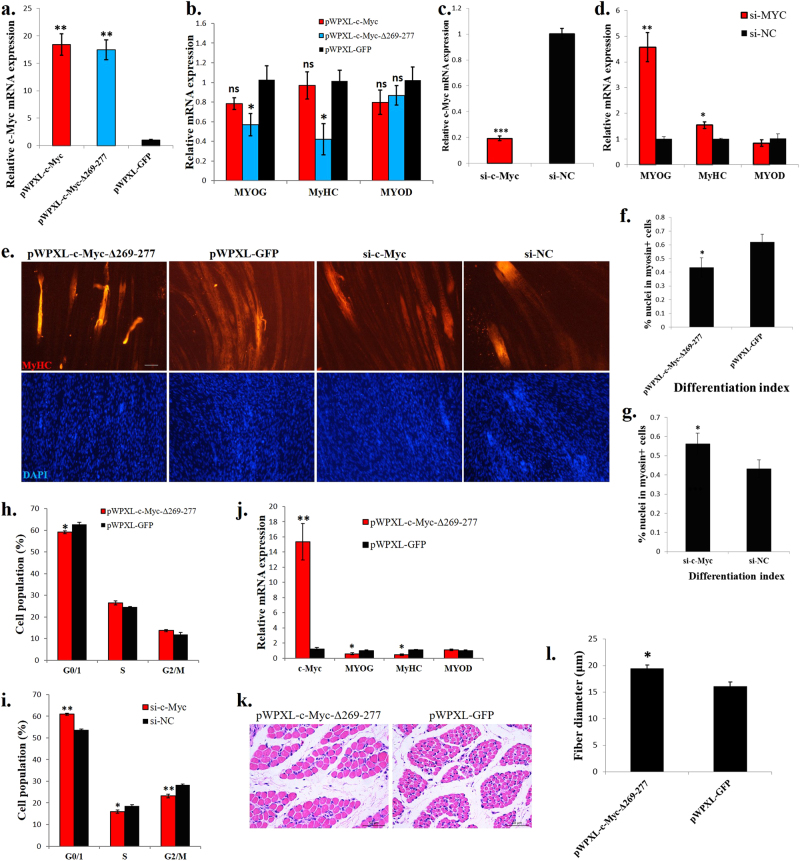
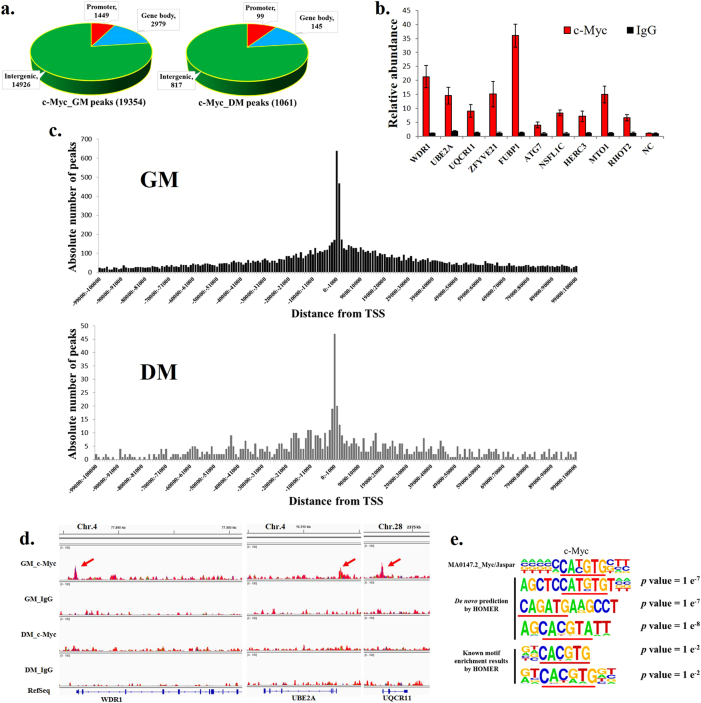
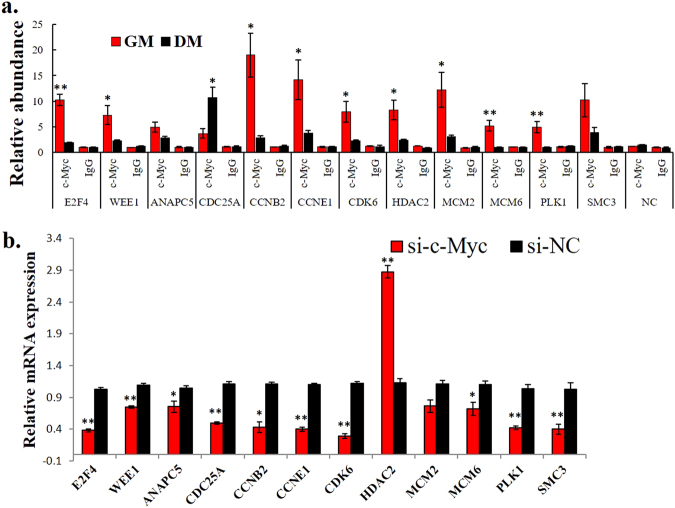
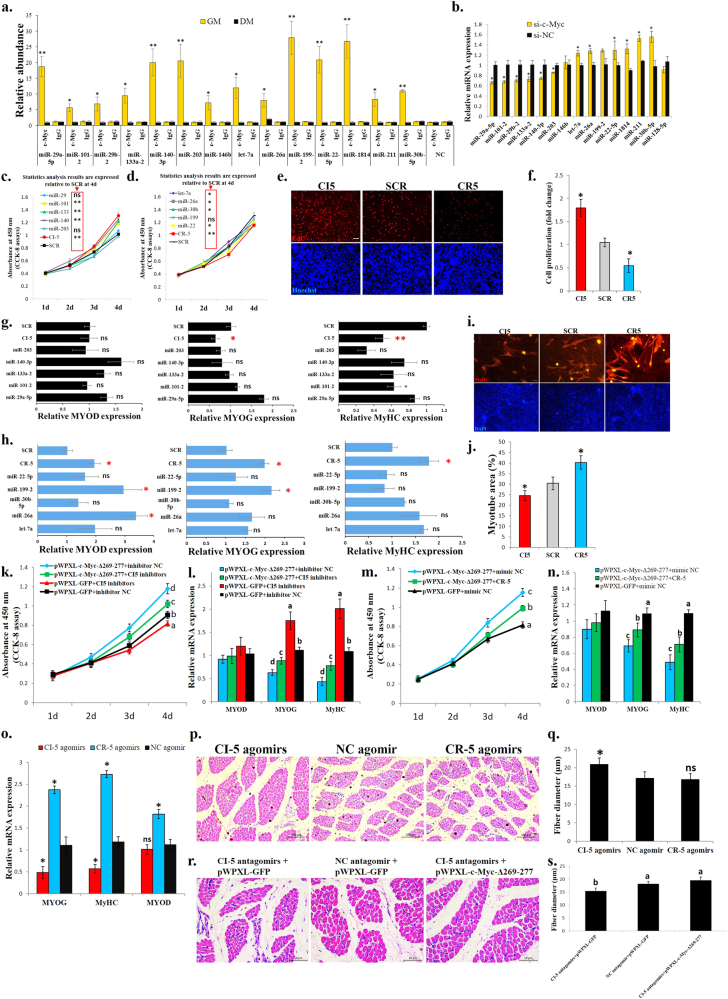
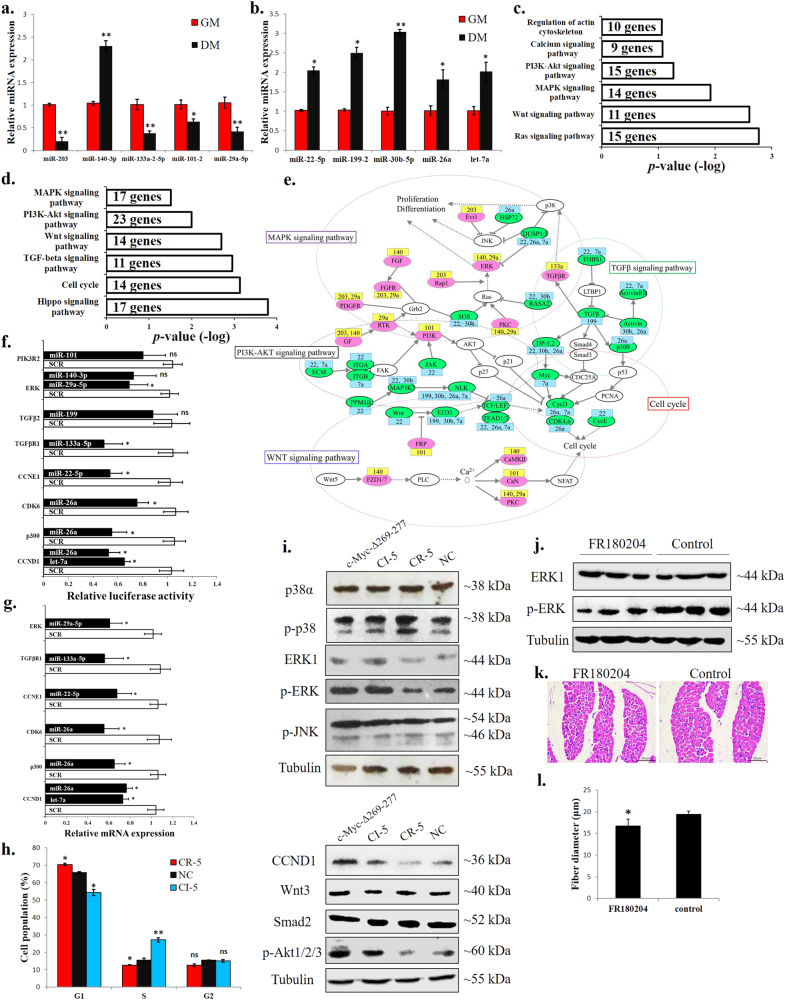
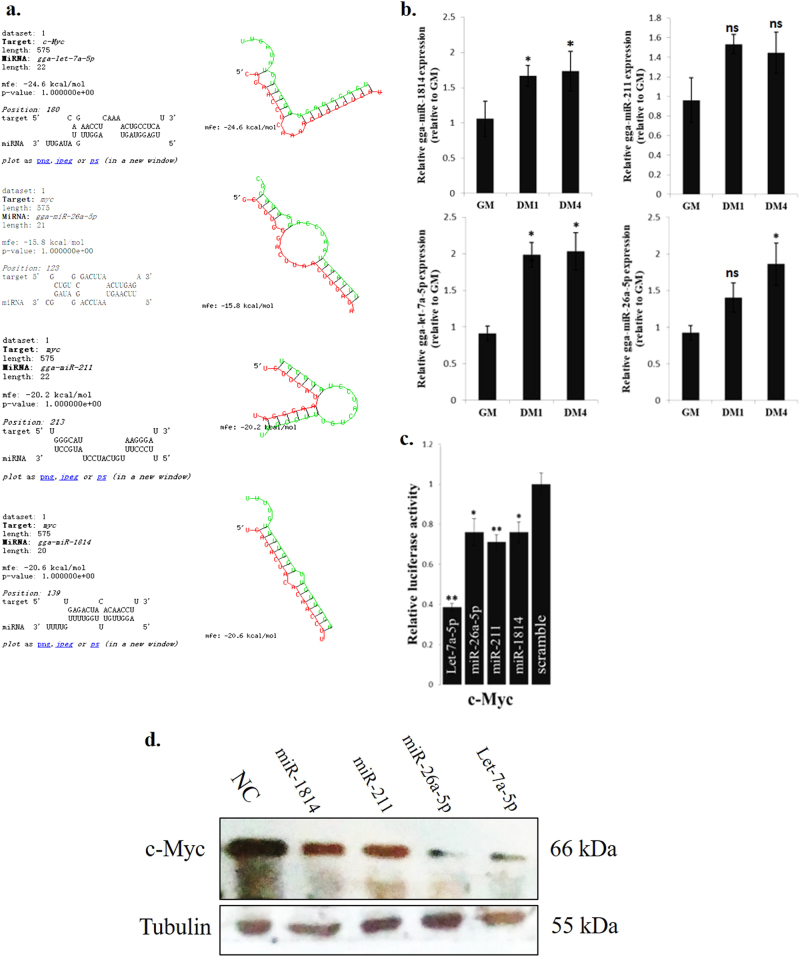
The transcription factor c-Myc is an important regulator of cellular proliferation, differentiation and embryogenesis. While c-Myc can inhibit myoblast differentiation, the underlying mechanisms remain poorly understood. Here, we found that c-Myc does not only inhibits myoblast differentiation but also promotes myoblast proliferation and muscle fibre hypertrophy. By performing chromatin immunoprecipitation and high-throughput sequencing (ChIP-seq), we identified the genome-wide binding profile of c-Myc in skeletal muscle cells. c-Myc achieves its regulatory effects on myoblast proliferation and differentiation by targeting the cell cycle pathway. Additionally, c-Myc can regulate cell cycle genes by controlling miRNA expression of which dozens of miRNAs can also be regulated directly by c-Myc. Among these c-Myc-associated miRNAs (CAMs), the roles played by c-Myc-induced miRNAs in skeletal muscle cells are similar to those played by c-Myc, whereas c-Myc-repressed miRNAs play roles that are opposite to those played by c-Myc. The cell cycle, ERK-MAPK and Akt-mediated pathways are potential target pathways of the CAMs during myoblast differentiation. Interestingly, we identified four CAMs that can directly bind to the c-Myc 3' UTR and inhibit c-Myc expression, suggesting that a negative feedback loop exists between c-Myc and its target miRNAs during myoblast differentiation. c-Myc also potentially regulates many long intergenic noncoding RNAs (lincRNAs). Linc-2949 and linc-1369 are directly regulated by c-Myc, and both lincRNAs are involved in the regulation of myoblast proliferation and differentiation by competing for the binding of muscle differentiation-related miRNAs. Our findings do not only provide a genome-wide overview of the role the c-Myc plays in skeletal muscle cells but also uncover the mechanism of how c-Myc and its target genes regulate myoblast proliferation and differentiation, and muscle fibre hypertrophy.


Conflict of interest statement

The authors declare that they have no conflict of interest.

Figures

Fig. 1
Fig. 1
c-Myc expression during chicken skeletal muscle development. a Genomic structure of the chicken c-Myc gene. Black boxes indicate the coding sequence regions, and the white boxes indicate the UTRs. b Relative c-Myc mRNA expression in chicken tissues. c Relative c-Myc mRNA expression in chicken embryonic leg muscle. d Relative c-Myc mRNA expression during chicken primary myoblast differentiation. e The major c-Myc calpain cleavage site is conserved among vertebrates. f Chicken primary myoblasts cultured in growth medium (GM) and differentiation medium for 4 days (DM). Total cell extracts were immunoblotted to detect c-Myc. g Chicken primary myoblasts cultured in DM4 were stained with anti-c-Myc. The results are shown as the mean ± standard error of mean (sem) of three independent experiments. One-way analysis of variance (ANOVA) followed by Dunnett’s test was performed to determine the significant differences between the groups. Different letters (a), (b) above the bars indicate significant differences (p < 0.05) by Duncan’s multiple range test. *p < 0.05; ns, no significant difference
Fig. 2
Fig. 2
c-Myc regulates myoblast proliferation and differentiation in vitro and induces muscle fibre hypertrophy in vivo. a Relative c-Myc mRNA expression after introducing c-Myc, c-Myc-Δ269–277 and GFP into chicken primary myoblasts. b Muscle differentiation marker genes expression after introducing c-Myc, c-Myc-Δ269–277 and GFP into chicken primary myoblasts. c Relative c-Myc mRNA expression after c-Myc knockdown in chicken primary myoblasts. d Muscle differentiation marker gene expression after c-Myc knockdown in chicken primary myoblasts. e MyHC immunostaining of primary myoblasts transduced with indicated vectors or siRNAs. Cells were differentiated for 72 h after transfection. The nuclei were visualized with DAPI. Bar, 100 µm. f Differentiation index of cells expressing c-Myc-Δ269–277 or GFP. g Differentiation index of cells transfected with si-c-Myc or si-NC. h Primary myoblasts expressing c-Myc-Δ269–277 or GFP were cultured in GM, and the cell cycle phase was analysed after 2 days. i Primary myoblasts transfected with si-c-Myc and si-NC were cultured in GM, and the cell cycle phase was analysed after 2 days. j Relative mRNA expression of the indicated genes in chicken breast muscles infected with a c-Myc-Δ269–277-expressing lentivirus or control (GFP). k H–E staining of a breast muscle fibre cross section from chickens infected with a c-Myc-Δ269–277-expressing lentivirus or control (GFP). l Fibre diameter of chicken breast muscle infected with a c-Myc-Δ269–277-expressing lentivirus or control (GFP). The results are shown as the mean ± sem of three independent experiments. In a, b, ANOVA followed by Dunnett’s test was used. In c, d, fj, l, independent sample t-test was used. *p< 0.05; **p< 0.01; ns, no significant difference
Fig. 3
Fig. 3
Genome-wide mapping of c-Myc binding during myoblast differentiation by ChIP-seq. a Distribution of c-Myc-binding peaks in myoblasts and myotubes. Promoter = TSS ± 2 kb. b Results of the ChIP-qPCR validation of 10 selected c-Myc-binding sites associated with RefSeq gene promoters. NC represents a genomic region without an identified c-Myc-binding peak. c Absolute number of peaks in myoblasts and myotubes distributed between −100 kb and +100 kb from the TSS. Each bin represents 1 kb. d Genomic snapshots depicting the ChIP-seq results of c-Myc and IgG at the promoter regions of the selected genomic loci. e De novo motif prediction and known motif enrichment results by HOMER of DNA sequences enriched in the c-Myc-binding regions. The c-Myc JASPAR matrix is presented for comparison. The results are shown as the mean ± sem of three independent experiments
Fig. 4
Fig. 4
Cell cycle pathway is an important regulatory target of c-Myc during myoblast differentiation. a Results of the ChIP-qPCR validation of the 12 c-Myc-bound genes shown in Fig. 4c. NC represents a genomic region without an identified c-Myc-binding peak. b Relative mRNA expression of the indicated genes after c-Myc knockdown in primary myoblasts. The results are shown as the mean ± sem of three independent experiments. Independent sample t-test was performed to determine the significant differences between the groups. *p< 0.05; **p< 0.01
Fig. 5
Fig. 5
miRNAs are associated with c-Myc and are important for c-Myc’s roles in the regulation of myoblast proliferation and differentiation and muscle fibre hypertrophy. a Results of the ChIP-qPCR validation of 14 c-Myc-bound miRNAs with different peak values between GM and DM. NC represents a genomic region without an identified c-Myc-binding peak. b Relative miRNA expression after c-Myc knockdown in primary myoblasts. c CCK-8 assay was performed to assess the effect of the CI-5 miRNAs on myoblast proliferation. SCR, scramble miRNA. d CCK-8 assay was performed to assess the effect of the CR-5 miRNAs on myoblast proliferation. SCR, scramble miRNA. e EdU staining after transfection of CI-5s and CR-5s. Bar, 50 μm. f Proliferation rate of myoblasts transfected with CI-5s and CR-5s. g Relative mRNA expression of the differentiation marker genes after transfection with the CI-5 miRNAs. h Relative mRNA expression of the differentiation marker genes after transfection with the CR-5 miRNAs. i MyHC staining of primary myoblasts 72 h after transfection with CI-5s and CR-5s. j Myotube area (%)72 h after transfection with CI-5s and CR-5s. k CCK-8 assay was performed to assess the effect of c-Myc and the CI-5 inhibitors on myoblast proliferation. l Primary myoblasts were co-transfected with mixtures of the indicated vectors and miRNA inhibitors, and the expression of the muscle differentiation marker genes was then analysed. m CCK-8 assay was performed to assess the effect of c-Myc and the CR-5 mimics on myoblast proliferation. n Primary myoblasts were co-transfected with mixtures of the indicated vectors and miRNA mimics, and the expression of the muscle differentiation marker genes was then analysed. o Chicken breast muscles were injected with CI-5, CR-5 or NC agomirs, and the expression of the muscle differentiation marker genes was then analysed. p H–E staining of breast muscle fibre cross sections from chickens injected with CI-5, CR-5 or NC agomirs. q Fibre diameter of chicken breast muscles injected with CI-5, CR-5 or NC agomirs. r H–E staining of breast muscle fibre cross sections from chickens injected with CI-5 antagomirs + pWPXL-GFP, NC antagomir + pWPXL-GFP and CI-5 antagomirs + pWPXL-c-Myc-Δ269–277. s Fibre diameter of chicken breast muscles injected with CI-5 antagomirs + pWPXL-GFP, NC antagomir + pWPXL-GFP and CI-5 antagomirs + pWPXL-c-Myc-Δ269–277. The results are shown as the mean ± sem of three independent experiments. In k, m, different letters ad indicate values of each group at 4 d are significantly different at p < 0.05 by Duncan’s multiple range test. In l, n, s, different letters ad above the bars indicate significant differences (p < 0.05) by Duncan’s multiple range test. In c, d, fh, j, o, q, ANOVA followed by Dunnett’s test was used. In ad, independent sample t-test was performed to determine the significant differences between the groups. *p< 0.05; **p< 0.01; ns, no significant difference
Fig. 6
Fig. 6
c-Myc-associated miRNAs are involved in the regulation of the cell cycle, ERK–MAPK and Akt-mediated pathways. a Relative miRNA expression of the CI-5s between GM and DM. b Relative miRNA expression of the CR-5s between GM and DM. c KEGG analysis of the CI-5 target genes. d KEGG analysis of the CR-5 target genes. e Gene-miRNA network consisting of 57 proteins (from the CI-5 and CR-5 target genes enriched in the indicated pathways) and their connections (grey lines). miRNA targets are displayed in green and pink. Targets in pink indicate genes upregulated from GM to DM. Targets in green indicate genes downregulated from GM to DM. miRNA names are reported in the yellow and blue boxes. CI-5s are shown in yellow, and CR-5s are shown in blue. The dotted line marks the areas with nodes belonging to canonical pathways. f Relative luciferase activity of 3’ UTR reporter constructs in certain genes shown in figure (e) after transfection with selected miRNA mimics. g Relative mRNA expression after transfection of individual CR-5 miRNAs in chicken primary myoblast. h Primary myoblasts expressing CR-5s, CI-5s or NC were cultured in GM, and the cell cycle phase was analysed after 2 days. i Primary myoblasts were transfected with c-Myc-Δ269–277, CI-5s, CR-5s or NC, and the protein levels of the indicated proteins were analysed after 3 d. j Chicken breast muscles were injected with FR180204 or control, and the protein levels of the ERK1 and p-ERK were analysed. k H–E staining of breast muscle fibre cross sections from chickens injected with FR180204 or control. l Fibre diameter of chicken breast muscles injected with FR180204 or control. The results are shown as the mean ± sem of three independent experiments. In (f (ERK and CCND1), g (CCND1) and h), ANOVA followed by Dunnett’s test was used. In (a,b,h,l), independent sample t-test was performed to determine the significant differences between the groups. *p< 0.05; **p< 0.01; ns, no significant difference
Fig. 7
Fig. 7
c-Myc-repressed miRNAs are involved in the regulation of c-Myc expression during myoblast differentiation. a Schematic representation of four miRNAs and c-Myc 3' UTR target region duplexes. b Relative miRNA expression of 4 miRNAs during myoblast differentiation. c Relative luciferase activity of the c-Myc 3' UTR reporter constructs after transfection with selected miRNA mimics. d c-Myc protein expression after transfection with selected miRNA mimics in primary myoblasts. The results are shown as the mean ± sem of three independent experiments. One-way analysis of variance (ANOVA) followed by Dunnett’s test was performed to determine the significant differences between the groups. *p< 0.05; **p< 0.01; ns, no significant difference
Fig. 8
Fig. 8
c-Myc is associated with lincRNA loci, and certain lincRNAs regulate myoblast proliferation and differentiation. a, b MyomiR-lincRNA interaction target networks. MyomiRs shown in red play positive roles in myoblast differentiation. MyomiRs shown in green play negative roles in myoblast differentiation. c Two selected lincRNAs and their target MyomiRs. d Results of the ChIP-qPCR validation of c-Myc binding to the linc-2949 and linc-1369 promoters between GM and DM. e Relative lincRNA expression after c-Myc knockdown in primary myoblasts. f Relative expression of linc-2949 and linc-1369 during myoblast differentiation. g Relative linc-2949 and linc-1369 expression in chicken tissues. h Relative luciferase activity of linc-2949 and linc-1369 reporter constructs after transfection with the indicated miRNA mimics. i CCK-8 assay was performed to assess the effect of si-linc-2949 and si-linc-1369 on myoblast proliferation. j Relative mRNA expression of the differentiation marker genes after transfection with si-linc-2949 and si-linc-1369. k Schematic of c-Myc-induced regulatory network in myoblast proliferation and differentiation and muscle fibre hypertrophy. The results are shown as the mean ± sem of three independent experiments. In f, hj, ANOVA followed by Dunnett’s test was used. In e, independent sample t-test was performed to determine the significant differences between the groups. *p< 0.05; **p< 0.01; ns, no significant difference

Similar articles

Cited by

References

    1. Dang CV, O’Donnell KA, Zeller KI, Nguyen T, Osthus RC, Li F. The c-Myc target gene network. Semin Cancer Biol. 2006;16:253–64. doi: 10.1016/j.semcancer.2006.07.014. - DOI - PubMed
    1. Davis AC, Wims M, Spotts GD, Hann SR, Bradley A. A null c-myc mutation causes lethality before 10.5 days of gestation in homozygotes and reduced fertility in heterozygous female mice. Genes Dev. 1993;7:671–82. doi: 10.1101/gad.7.4.671. - DOI - PubMed
    1. Bouchard C, Thieke K, Maier A, Saffrich R, Hanley-Hyde J, Ansorge W, et al. Direct induction of cyclin D2 by Myc contributes to cell cycle progression and sequestration of p27. EMBO J. 1999;18:5321–33. doi: 10.1093/emboj/18.19.5321. - DOI - PMC - PubMed
    1. Perez-Roger I, Kim SH, Griffiths B, Sewing A, Land H. Cyclins D1 and D2 mediate myc-induced proliferation via sequestration ofp27(Kip1) and p21(Cip1) EMBO J. 1999;18:5310–20. doi: 10.1093/emboj/18.19.5310. - DOI - PMC - PubMed
    1. Yuan J, Wang K, Xi M. MiR-494 inhibits epithelial ovarian cancer growth by targeting c-Myc. Med Sci Monit. 2016;22:617–24. doi: 10.12659/MSM.897288. - DOI - PMC - PubMed

Publication types

MeSH terms