. 2018 Jun;21(6):851-859.
doi: 10.1038/s41593-018-0143-z. Epub 2018 May 21.

Distinct learning-induced changes in stimulus selectivity and interactions of GABAergic interneuron classes in visual cortex

Affiliations

Distinct learning-induced changes in stimulus selectivity and interactions of GABAergic interneuron classes in visual cortex

Adil G Khan et al. Nat Neurosci. 2018 Jun.

Abstract

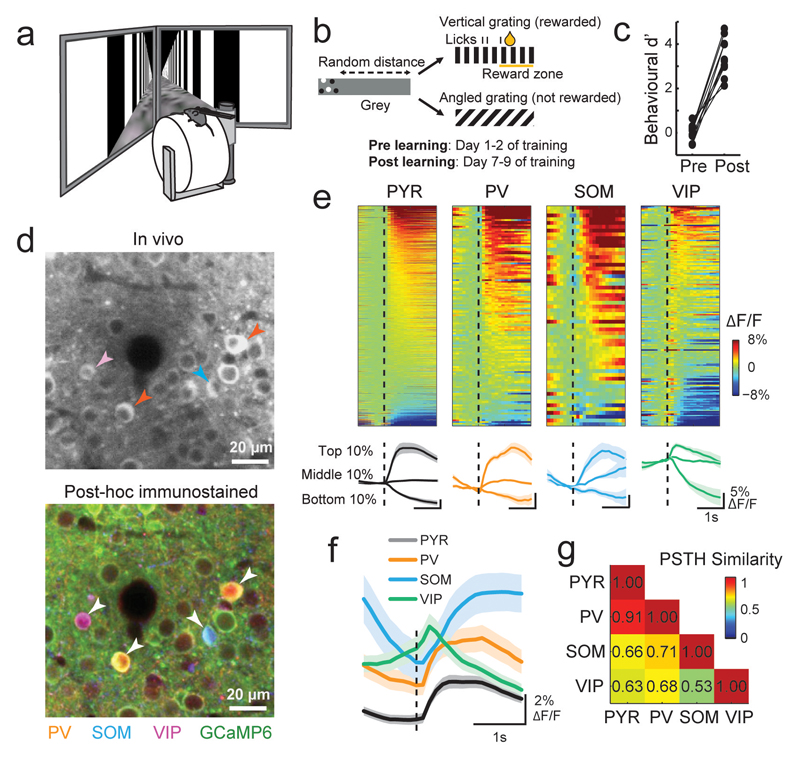
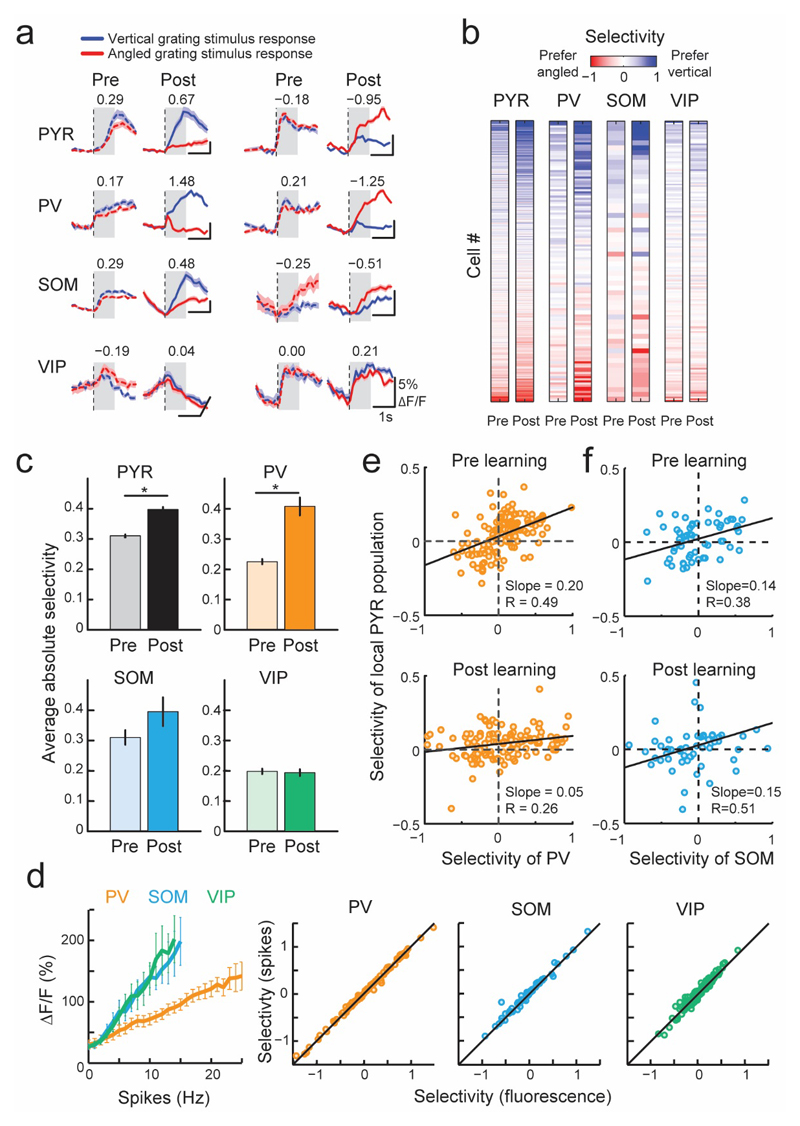
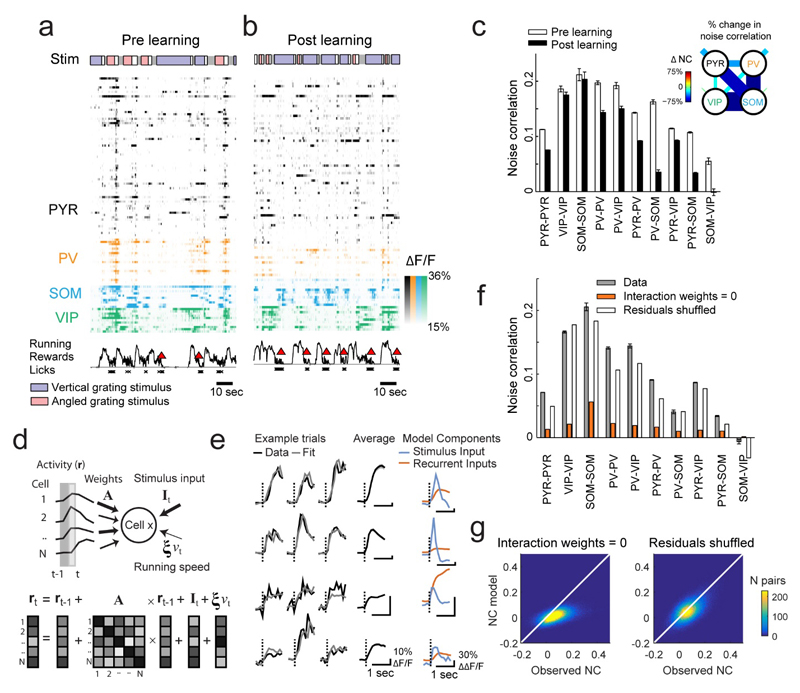
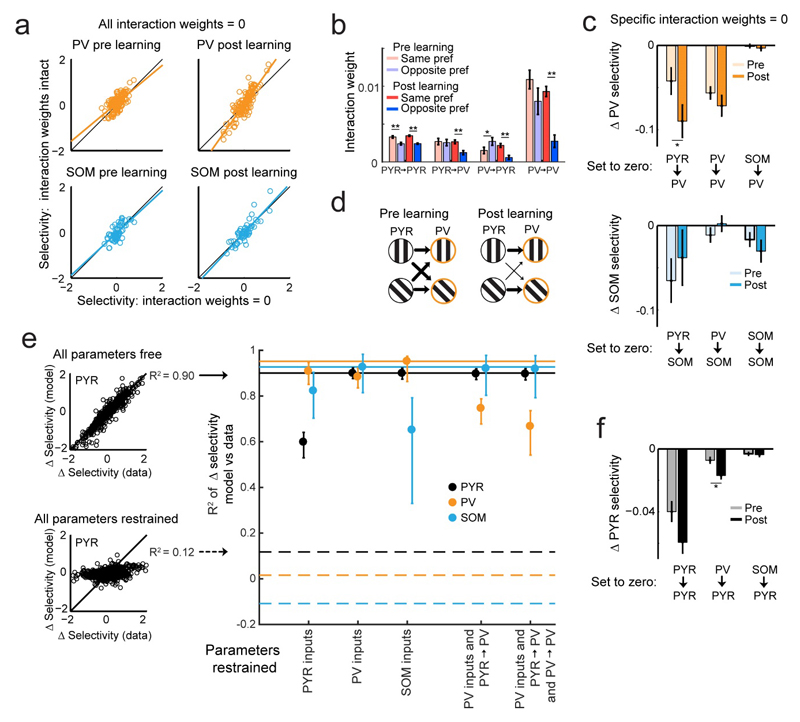
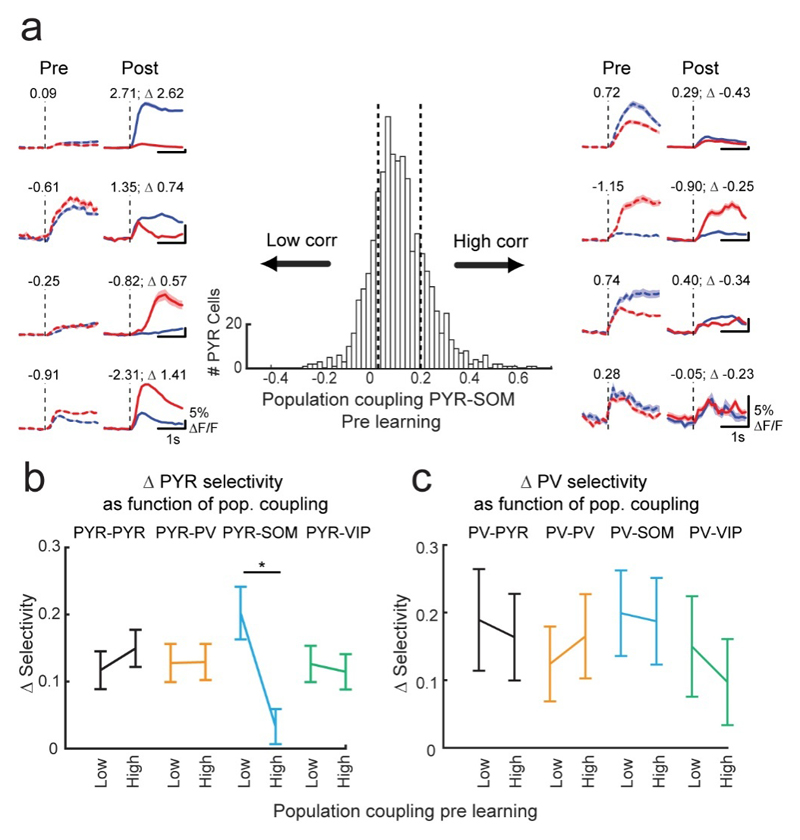
How learning enhances neural representations for behaviorally relevant stimuli via activity changes of cortical cell types remains unclear. We simultaneously imaged responses of pyramidal cells (PYR) along with parvalbumin (PV), somatostatin (SOM), and vasoactive intestinal peptide (VIP) inhibitory interneurons in primary visual cortex while mice learned to discriminate visual patterns. Learning increased selectivity for task-relevant stimuli of PYR, PV and SOM subsets but not VIP cells. Strikingly, PV neurons became as selective as PYR cells, and their functional interactions reorganized, leading to the emergence of stimulus-selective PYR-PV ensembles. Conversely, SOM activity became strongly decorrelated from the network, and PYR-SOM coupling before learning predicted selectivity increases in individual PYR cells. Thus, learning differentially shapes the activity and interactions of multiple cell classes: while SOM inhibition may gate selectivity changes, PV interneurons become recruited into stimulus-specific ensembles and provide more selective inhibition as the network becomes better at discriminating behaviorally relevant stimuli.


Figures

Figure 1
Figure 1. Simultaneous two-photon imaging of multiple cell classes during a visual discrimination task in virtual reality.
(a) Virtual reality setup. (b) Schematic of behavioral task. Mice were rewarded for licking a reward spout when presented with vertical and not angled gratings. (c) Behavioral discrimination performance (behavioral d’) across learning (N = 8 mice). Connected points represent individual mice. (d) Top, example region of an in-vivo image plane with GCaMP6f expressing neurons. Bottom, same region after post-hoc immunostaining for PV, SOM and VIP (orange, blue and magenta, respectively) and image registration to match the in-vivo plane. Identified interneurons are indicated by arrowheads. (e) Top, average responses to the vertical grating of all recorded neurons of each cell type after learning. Calcium responses are baseline corrected (subtraction of baseline ΔF/F -0.5 to 0 s before stimulus onset), and aligned to grating onset (dashed line). Cells are sorted by their average response amplitude 0-1 s from stimulus onset. Number of cells included in each plot: 1249, 132, 58 and 175 for PYR, PV, SOM and VIP, respectively, N = 8 mice. Bottom, average responses of cells from the top, middle and bottom 10th percentiles of grating-evoked response amplitudes of each cell class. Shaded area represents SEM. (f) Average response to the vertical grating of all cells from each cell class after learning. (g) Similarity of response profiles to the vertical grating of all pairs of cell classes attained with a random forest decoder to classify single cells to one of two classes based on the shape of their average baseline-subtracted PSTH (see Online Methods). PSTH similarity score = 2 × (1- classification accuracy). Scores near 0 and 1 indicate low and high PSTH similarity between two cell classes respectively.
Figure 2
Figure 2. Response amplitude and selectivity changes with learning in different cell classes.
(a) Average responses to vertical (blue line) and angled (red line) grating stimuli before (dashed line) and after learning (solid line) of example neurons from different cell classes. Numbers indicate selectivity to the grating stimuli, calculated in a window 0-1s from grating stimulus onset (gray shading). Positive and negative values indicate vertical and angled preference, respectively. Shaded area represents SEM. (b) Grating selectivity of the same cells (rows) before (pre) and after (post) learning (columns). Cells were ordered by their mean pre and post learning selectivity. Numbers of cells recorded both pre and post learning: 1249 PYR, 132 PV, 58 SOM and 175 VIP cells here and elsewhere, N = 8 mice. (c) Mean absolute selectivity of each cell class before and after learning. Error bars represent SEM. *, P < 10-5. (d) Left, relationship between action potential firing rate and calcium transient size in simultaneous loose patch and GCaMP6 recordings from the three interneuron classes in visual cortex slices. Error bars represent SEM. Right, comparison of selectivity values computed from measured fluorescence (x-axis) and inferred firing rate (y-axis) in PV, SOM, and VIP interneurons. Correlation coefficients 1.00, 0.99, 0.97 for PV, SOM and VIP respectively (e, f) Relationship between the selectivity of individual PV cells (e) or SOM cells (f) and the mean selectivity of the local PYR population within 100 μm distance from each PV or SOM cell, before (top) and after learning (bottom).
Figure 3
Figure 3. Concerted changes in interactions and neuronal selectivity with learning.
(a, b) Example responses of simultaneously imaged neurons before (a) and after learning (b). Colored bars on top indicate stimuli encountered by the mouse as it traversed the virtual corridor: blue and red indicate vertical and angled gratings, gray and white indicate corridor walls in gray or with dots, respectively. Running (black line), reward delivery (red triangle) and licks (crosses) are indicated below. Only a quarter of the PYR cells are shown for clarity. (c) Noise correlations measured during the vertical grating response (0-1 s from stimulus onset) between cell pairs of each combination of cell classes, before and after learning. Error bars represent SEM here and elsewhere. Inset: relative changes in noise correlation over learning between and within all cell classes, as indicated by line thickness and color code. Shorter line segments show relative change in correlations between cells of the same type. (d) The linear dynamical system model fits single trial responses by estimating the contribution of stimulus-locked input, recurrent inputs from the local cell population and running speed. (e) Example traces of responses and model fit on three single trials (columns) from 4 cells (rows) along with each cell's average response (black), stimulus input (blue) and average recurrent input (red). (f) Average post learning noise correlations observed (gray), or simulated after setting interaction weights to zero (orange) or shuffling residuals (white). (g) Scatter density plot of observed versus simulated pairwise noise correlations (NC), after setting interaction weights to zero or shuffling residuals.
Figure 4
Figure 4. Relationship between neuronal selectivity and changes in interactions between different cell classes.
(a) Effect of removing weights between all cells in the LDS model on selectivity in PV (top) and SOM cells (bottom) before (left) and after (right) learning. N = 132 PV and 58 SOM cells here and below. (b) Interaction weights in LDS model before and after learning for cell pairs with the same or different stimulus-input preference (see Online Methods). **, P < 10-3; *, P < 0.05 here and elsewhere. (c) Effect of specific weight removal on the selectivity change over learning (Δselectivity) in PV (top) and SOM cells (bottom). (d) Schematic depicting how PYR to PV interaction weights (arrows of different thickness) rearrange to provide selective inputs to PV cells after learning. (e) LDS model jointly fit across learning. Left: allowing all (top, free) or no parameters (bottom, restrained) to differ pre and post learning results in high or low R2 between observed and simulated Δselectivity over learning of PYR cells, respectively. N = 1249 PYR cells, here and below. R2 values with all or no free parameters indicated by horizontal lines on right for PYR, PV and SOM cells. Right, R2 values obtained for different cell classes in joint LDS fits while restraining specific parameters from changing pre to post learning. Error bars represent bootstrapped 90% confidence intervals. (f) Effect of specific weight removal on Δselectivity in PYR cells.
Figure 5
Figure 5. Degree of coupling with the SOM cell population is related to PYR cell selectivity increase.
(a) Centre: distribution of pre learning noise correlations between individual PYR cells and the average activity of the SOM cell population, N = 1249 PYR cells. Vertical dashed lines denote top and bottom 20th percentiles. Average grating responses pre and post learning of example PYR cells with low and high pre learning SOM cell population coupling (left and right, 4 example cells each). Numbers indicate selectivity. (b,c) Difference in the absolute selectivity pre and post learning (Δselectivity) of PYR cells (b) and PV cells (c) with low and high (bottom and top 20th percentiles) coupling to the four cell type populations. **, P < 10-3, N = 250 PYR cells (b) and 26 PV cells (c) in each group. Error bars represent SEM.

References

    1. Alitto HJ, Dan Y. Function of inhibition in visual cortical processing. Curr Opin Neurobiol. 2010;20:340–346. - PMC - PubMed
    1. Barnes SJ, Sammons RP, Jacobsen RI, Mackie J, Keller GB, Keck T. Subnetwork-Specific Homeostatic Plasticity in Mouse Visual Cortex In Vivo. Neuron. 2015;86:1290–1303. - PMC - PubMed
    1. Blake DT, Heiser MA, Caywood M, Merzenich MM. Experience-Dependent Adult Cortical Plasticity Requires Cognitive Association between Sensation and Reward. Neuron. 2006;52:371–381. - PMC - PubMed
    1. Bock DD, Lee W-CA, Kerlin AM, Andermann ML, Hood G, Wetzel AW, Yurgenson S, Soucy ER, Kim HS, Reid RC. Network anatomy and in vivo physiology of visual cortical neurons. Nature. 2011;471:177–182. - PMC - PubMed
    1. Chen JL, Margolis DJ, Stankov A, Sumanovski LT, Schneider BL, Helmchen F. Pathway-specific reorganization of projection neurons in somatosensory cortex during learning. Nat Neurosci. 2015a;18:1101–1108. - PubMed

Publication types

MeSH terms