Review
. 2018 May 22;19(5):1538.
doi: 10.3390/ijms19051538.

Temperature Effects on Force and Actin⁻Myosin Interaction in Muscle: A Look Back on Some Experimental Findings

Affiliations
Review

Temperature Effects on Force and Actin⁻Myosin Interaction in Muscle: A Look Back on Some Experimental Findings

K W Ranatunga. Int J Mol Sci. .

Abstract

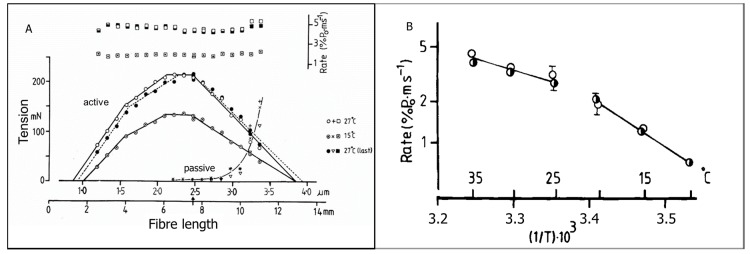
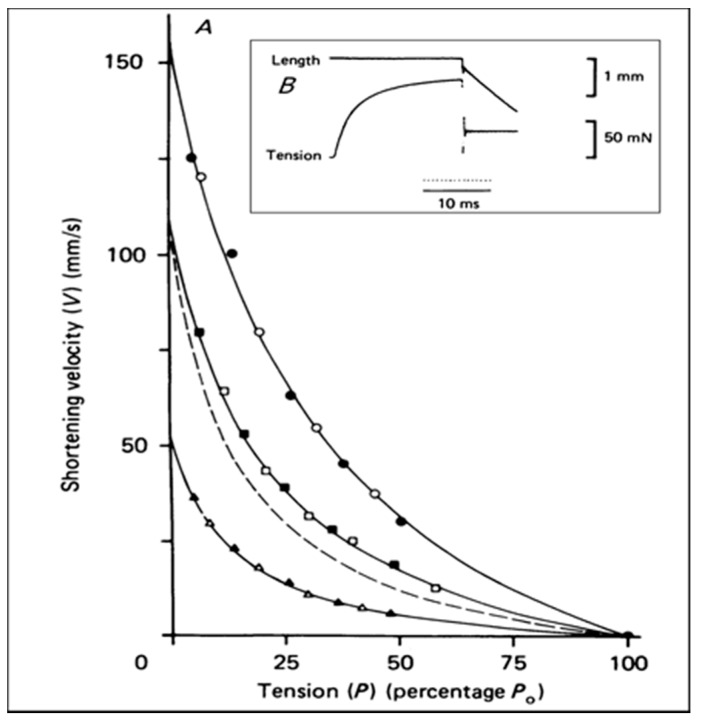
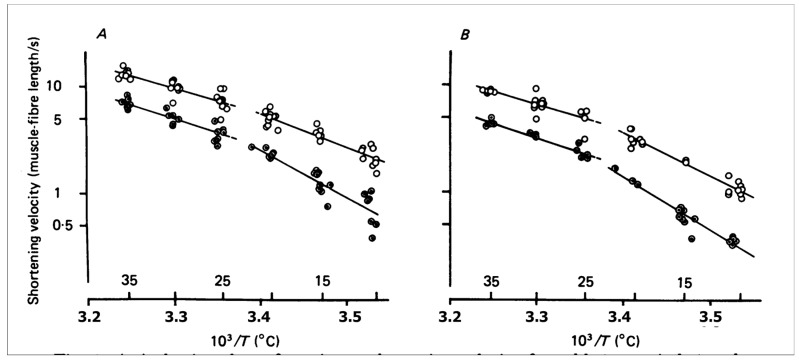
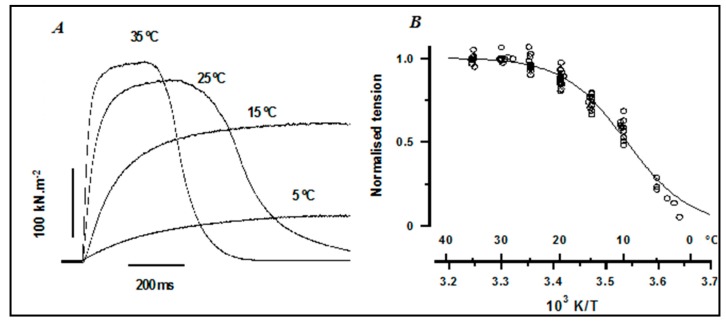
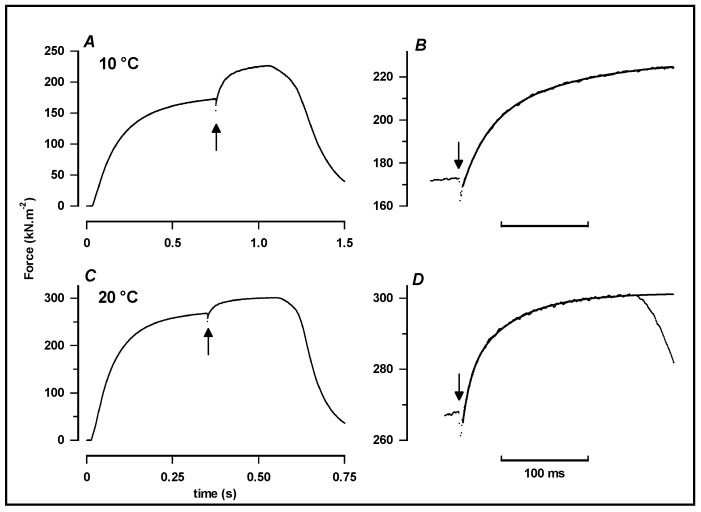
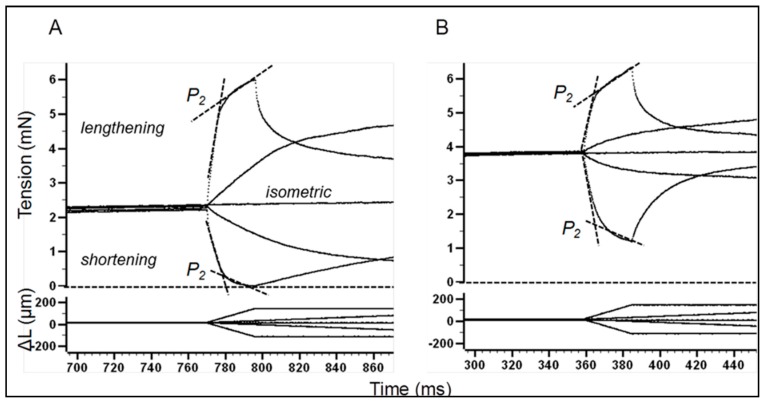
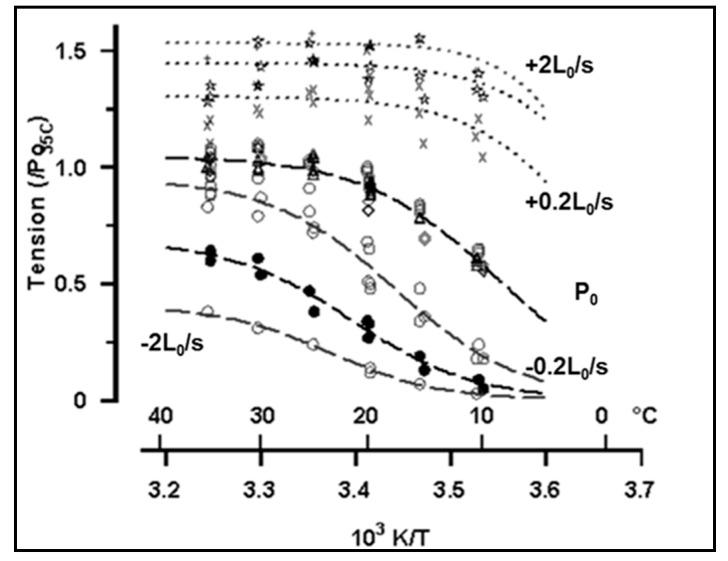
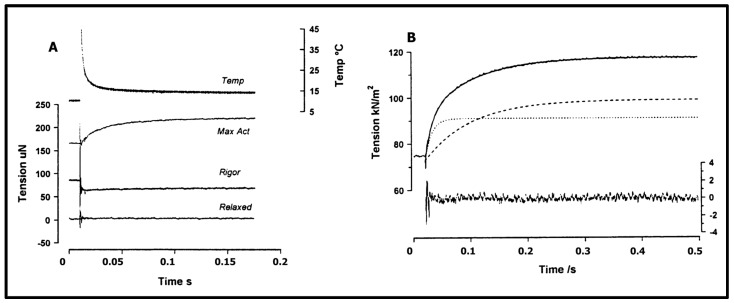
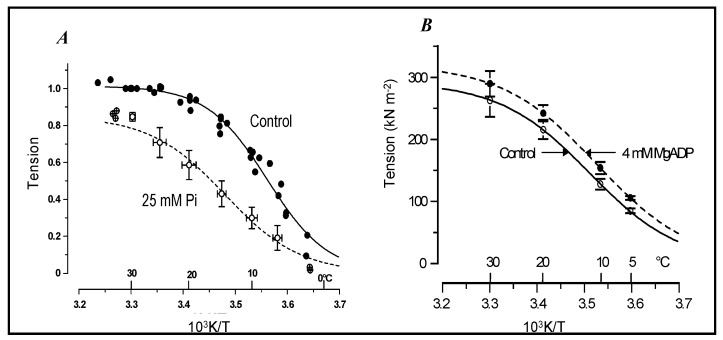
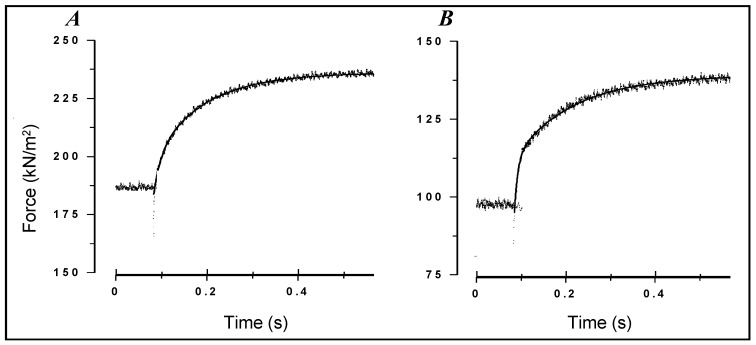
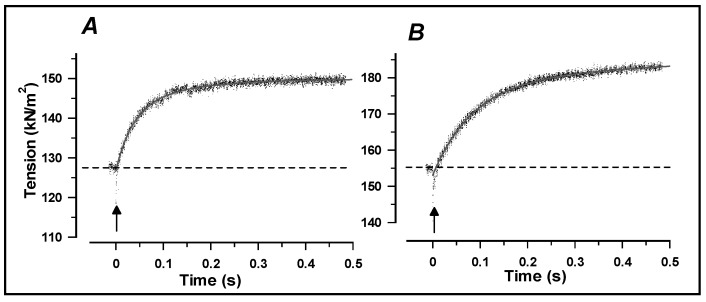
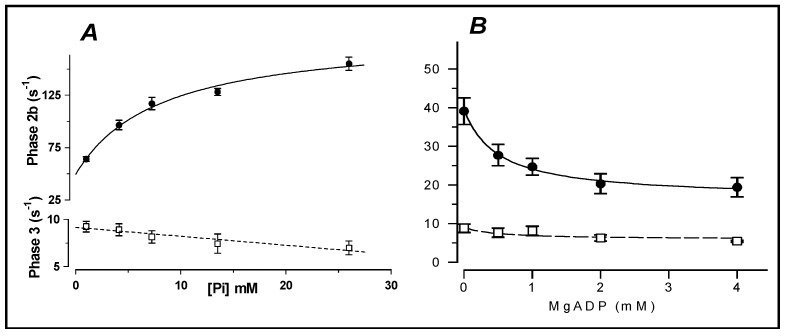
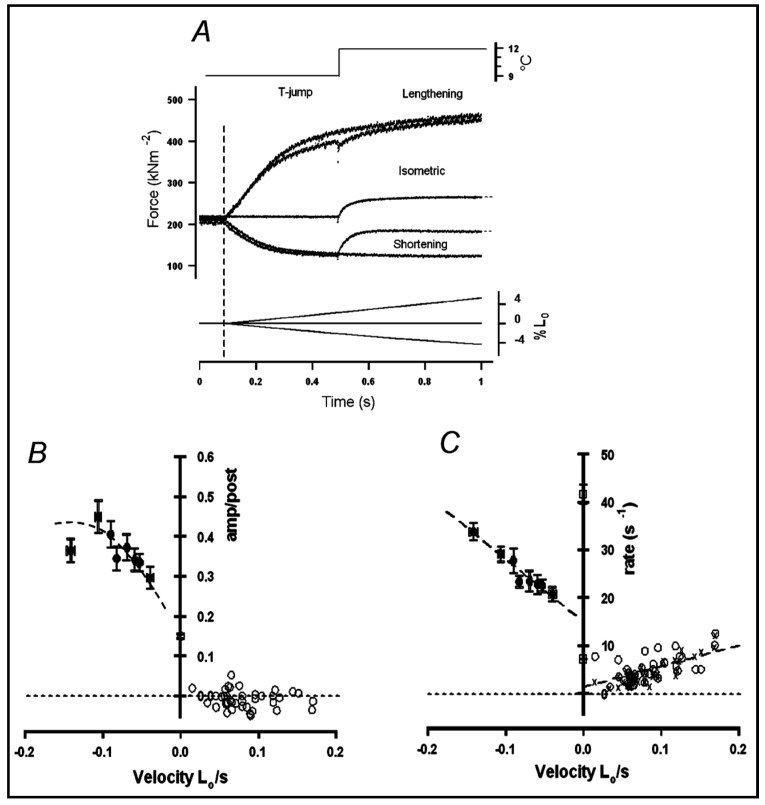
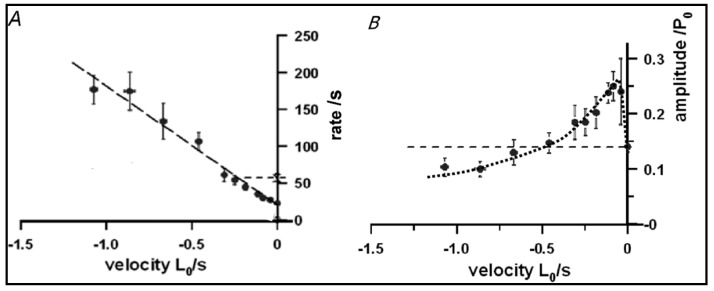
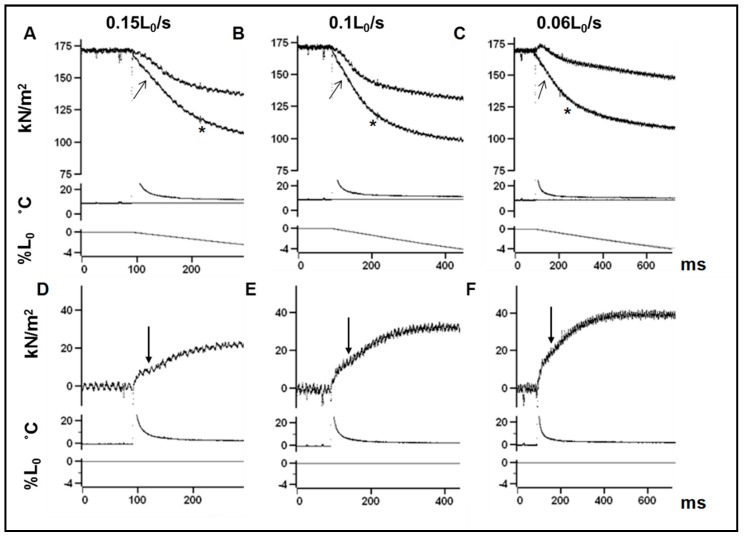
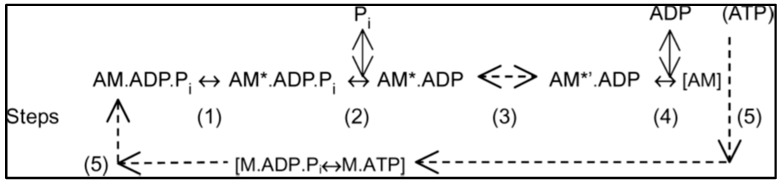
Observations made in temperature studies on mammalian muscle during force development, shortening, and lengthening, are re-examined. The isometric force in active muscle goes up substantially on warming from less than 10 °C to temperatures closer to physiological (>30 °C), and the sigmoidal temperature dependence of this force has a half-maximum at ~10 °C. During steady shortening, when force is decreased to a steady level, the sigmoidal curve is more pronounced and shifted to higher temperatures, whereas, in lengthening muscle, the curve is shifted to lower temperatures, and there is a less marked increase with temperature. Even with a small rapid temperature-jump (T-jump), force in active muscle rises in a definitive way. The rate of tension rise is slower with adenosine diphosphate (ADP) and faster with increased phosphate. Analysis showed that a T-jump enhances an early, pre-phosphate release step in the acto-myosin (crossbridge) ATPase cycle, thus inducing a force-rise. The sigmoidal dependence of steady force on temperature is due to this endothermic nature of crossbridge force generation. During shortening, the force-generating step and the ATPase cycle are accelerated, whereas during lengthening, they are inhibited. The endothermic force generation is seen in different muscle types (fast, slow, and cardiac). The underlying mechanism may involve a structural change in attached myosin heads and/or their attachments on heat absorption.

Keywords: actin–myosin; crossbridge cycle; crossbridge force; endothermic force; muscle force; muscle shortening; temperature-sensitivity.


Conflict of interest statement

The authors declare no conflict of interest.

Figures

Figure 1
Figure 1
(A) Variation with fibre length of tetanic tension (circles) from an experiment (on rat biceps muscle, from Elmubarak & Ranatunga 1984, [24]). Data collected first at 27 °C (open circles), after cooling to 15 °C (lower set) and then after rewarming (filled circles): fibre length is shown in lower x-axis, and corresponding sarcomere length in the upper x-axis. Length/tetanic tension relation consists of four linear segments, and is reversibly lowered in cooling, but essential features remain the same. The rate of tension rise (squares, upper data) is insensitive to length, but is decreased at low temperature. At both temperatures, the passive tension in resting state (triangles, crosses) increases exponentially with length. (B) The rate of tension rise (mean ± SEM) from four experiments recorded at different temperatures (in cooling and warming) is plotted as an Arrhenius plot (log rate versus reciprocal absolute temperature, 1/T). The decrease in the rate with cooling is less at higher temperatures (35–25 °C, temperature coefficient (Q10) of ~1.5), but it is increased at the lower temperatures (Q10 of 2.8).
Figure 2
Figure 2
(A) Force-shortening velocity data at 35 °C (circles), 25 °C (squares), and 15 °C (triangles) from an experiment on a fast muscle (adapted from Ranatunga, 1984, [25]). Curves are the fitted with A. V. Hill hyperbolic equation to calculate the Vmax (velocity at zero force). Shortening velocity was measured from the slope of length record as shown for one force in (B), at various levels of force. The dashed line represents the force–velocity relation at 15 °C, scaled up to the maximum velocity of the 25 °C curve, to show the increased curvature at the lower temperature. The closed and open symbols are from data obtained with decreasing and increasing isotonic tensions.
Figure 3
Figure 3
(A) Maximum shortening velocity for fast (open circles) and slow (circles with center dots) muscles shown as Arrhenius plots (from [25]). Pooled data are each from 14 muscles, with log velocity plotted vertically against 1/T horizontally. The straight lines are calculated regression lines for the data at temperatures above and below 23 °C. The Q10s obtained from the regression analysis were: fast fibres 1.8 and 2.4 and slow fibres 2.0 and 3.5, respectively, for the higher and lower temperature ranges. (B) Arrhenius plots for measured shortening velocity at isotonic tensions of ~10% Po from the same experiments (the presentation is similar to (A). The Q10s were 1.8 and 3.1 for fast, and 1.9 and 3.8 for slow fibres at temperatures higher and lower than 23 °C.
Figure 4
Figure 4
(A) Tetanic tension responses obtained from one intact fibre bundle at four different temperatures, using suitable stimulation frequencies and durations. (B) Tetanic tension data from 8 bundles at different temperatures normalised to that at 35 °C; the horizontal axis is reciprocal absolute temperature (also labelled in °C, from Coupland & Ranatunga [36]).
Figure 5
Figure 5
(A) A tetanic contraction of a fibre at 10 °C with a T-jump of ~4 °C applied at the plateau. This causes a small instantaneous tension drop (phase 1), followed by a slower rise to a new steady level. (B) Enlarged version of (A) near the T-jump. The tension response is fitted by a bi-exponential curve. (C,D) Similar plots to (A,B) from the same bundle at 20 °C: the maximum tension is higher, whereas the tension increase induced by the T-jump is faster, but smaller, than at 10 °C.
Figure 6
Figure 6
Records of tension (upper panel) and length (lower panel) from a muscle at 10 °C (A) and at 35 °C (B); isometric force (P0) is nearly doubled at 35 °C. At the isometric tetanus plateau, a ramp shortening or lengthening of ~6% was applied (bottom traces) at two velocities, 0.25 and 2.3 L0/s. The tension at the (P2) transition was measured (adapted from Roots et al. [43]) at the point of intersection between two lines, fitted as shown (this represents crossbridge force during shortening/lengthening). The dashed line represents zero active force level.
Figure 7
Figure 7
Dependence of tension on temperature during ramp lengthening and shortening. Pooled data from three fibres in which data for isometric (P0), shortening (−) and lengthening (+) were recorded at all the temperatures shown. Tensions were scaled to the isometric tension at 35 °C. Note that the isometric tensions P0 (Δ, ◊, □, n = 120) and P2 for shortening (●, ○, n = 8–20) at a given velocity increase with warming: the distributions are all sigmoidal. From fitted curves, temperature for half-maximal tension is ~9 °C for isometric; it increases with shortening velocity and is 23 °C for −2 L0/s (as first reported in [39]). The tension for each lengthening velocity (top data, n = 8–20), were not significantly correlated with temperature.
Figure 8
Figure 8
(A) Tension responses to a 5° T-jump from a single fast (psoas) fibre preparation at −10 °C, when it was relaxed (bottom tension trace), in rigor (middle trace), and when maximally Ca-activated (top tension trace). The T-jump was the same and a thermocouple trace is shown: from [10]. Note that the relaxed fibre tension remains unaltered, the rigor tension is decreased abruptly to a steady level, and the active tension is increased along a characteristic time course to a new steady level. (B) The active tension rise to T-jump could be fitted with a bi-exponential function (solid curve through the tension trace); the two exponential curves are shown separately by the dotted (phase 2b) dashed (phase 3) and the residuals after the curve fit (bottom trace).
Figure 9
Figure 9
(A) Effect of Pi. Pooled tension values from five fibres (with maximal Ca-activation) measured at different temperatures from ~5 to 30 °C. A fibre was activated at ~5 °C, and its temperature increased by laser T-jumps and/or Peltier. Tension values were scaled to the “control” at 30 °C, and plotted against reciprocal absolute temperature. The solid curve and filled circles were from activation in the “control” solution (no added Pi). Open symbols show the mean (±SD) pooled tensions with 25 mM Pi present from two series (i.e., before and after control). Pi depresses tension, but at higher temperatures, the relative Pi-induced depression is less, and the curve is left-shifted (from Coupland et al. [13]). (B) Effect of ADP. Pooled tension data from 18 fibres in control solution or with 4 mM MgADP added, recorded at different temperatures (mean (±SEM)). Specific tension values (in kN m−2) are given for the control (open symbols) and for the fibres with 4 mM MgADP added (filled symbols). Tension is potentiated with the added ADP: the relative potentiation is less at higher temperatures and the curve is right-shifted (from Coupland et al. [46]).
Figure 10
Figure 10
Effect of Pi. Tension response at the tension plateau at ~9 °C to a T-jump of ~3 °C. (A) For the control fibre (no added Pi). (B) The same fibre after reactivation with 12.5 mM Pi added. Each transient has been fitted with a bi-exponential curve. The extra Pi depresses steady force, but the initial T-jump transient (phase 2b) is faster. The tension rise amplitude is similar to the control (adapted from [11]).
Figure 11
Figure 11
Effect of MgADP. (A) Tension response in the control fibre (no added MgADP), experimental design as in Figure 10. (B) Altered response of the same fibre reactivated in the presence of 4 mM additional MgADP. Note that the initial plateau tension level is higher, but the tension rise induced by the T-jump is slower with MgADP present; the amplitude of the rise in tension is similar (from [46]).
Figure 12
Figure 12
From experiments, as in Figure 10 and Figure 11 (T-jump from ~9 to 12 °C), the mean (±SEM) phase 2b rate (filled symbols), and phase 3 rate (open symbols) are shown. (A) Pi-dependence: the phase 2b rate increases with Pi, to a plateau, and the relation is hyperbolic (the curve fitted). Phase 3 shows minimal sensitivity to Pi (adapted from [11]). (B) MgADP dependence of rate: the phase 2b rate decreases with increased ADP (exhibits saturation at high ADP levels); the relation is hyperbolic. Phase 3 shows minimal sensitivity to ADP (adapted from [46]).
Figure 13
Figure 13
(A) A fibre held isometrically was maximally Ca-activated at ~9 °C and, during the tension plateau (P0), a T-jump of ~3 °C was applied (top panel—schematic) to obtain the “isometric” tension trace; (the bottom panel shows length records). Temperature was clamped again at ~9 °C, and the fibre lengthened at a constant velocity to obtain the “lengthening” tension traces (one without and the other with a T-jump). During lengthening, the tension rises to ~2.2 P0. The T-jump does not lead to a net tension increase (induces a small instantaneous tension drop, phase 1). The same procedure was repeated, but with shortening, to obtain the “shortening” tension traces. Tension drops to ~0.5 P0, but the T-jump induces a pronounced tension rise. The T-jump tension trace fitted well to a single exponential function. (B,C) Data from six fibres. Velocity is plotted as L0/s on the horizontal axis, negative for shortening, and positive for lengthening. (B) The amplitude (net tension change after a T-jump) is plotted (as a ratio of the post-T-jump tension). During lengthening, the tension change (open symbols, individual data) is not significantly different from zero: during shortening (filled circles) T-jump tension rises with velocity (Mean (SEM, n = 30) values for isometric are plotted on the ordinate). (C) During lengthening, the rate of tension rise from curve fit to the late part of pre-T-jump tension trace (crosses) is not significantly different (p > 0.1) from the post-T-jump rate (open circles). With shortening, the rate of tension rise increases with velocity (p < 0.001).). Two isometric rates (phase 2b and 3) are on the ordinate (adapted from [67]).
Figure 14
Figure 14
Characteristics of the T-jump-induced tension rise during steady shortening. Mean data from nine fully activated fibres where a 3–4 °C T-jump was imposed on over a wide range of shortening velocities at 8–9 °C. A single exponential curve was fitted to the post-T-jump tension rise to extract the rate and amplitude of the tension rise. The mean (±SEM, n = 5–18) data are plotted against shortening velocity as in Figure 13. (A) The rate of tension rise. Filled symbols show the rate induced tension rise produced by the T-jump, where the dashed line shows the fitted linear regression to the original data (excluding values for isometric). The isometric phase 2b from biphasic analysis was ~55/s (× on the ordinate and short-dashed horizontal line). (B) The amplitude of the T-jump tension rise, as a percentage of tetanic force (adapted from [68]).
Figure 15
Figure 15
(AC) An experiment on a maximally Ca-activated fibre at ~9 °C. A ramp shortening (lower traces) was applied at the tension plateau. Two recordings were made at each velocity: one without a T-jump (lower of the tension traces), and the other with a T-jump of ~3 °C applied at the onset of ramp shortening (middle trace is thermocouple output). The arrow and asterisk denote early (P1) and late (P2) transitions towards steady shortening state. Records show that a T-jump changes the tension decline during shortening (from the same isometric force). (DF) For each velocity, the recording made without a T-jump was subtracted from that made with a T-jump, and the difference traces for tension (top), temperature (middle), and length (bottom) are shown (adapted from [73]).
Scheme 1
Scheme 1
ATPase/crossbridge cycle.

Similar articles

Cited by

References

    1. Huxley A.F. Muscle structure and theories of contraction. Prog. Biophys. 1957;7:285–318. - PubMed
    1. Huxley H.E. Mechanism of muscle contraction. Science. 1969;164:1356–1366. doi: 10.1126/science.164.3886.1356. - DOI - PubMed
    1. Lymn R.W., Taylor E.W. Mechanism of adenosine triphosphate hydrolysis by actomyosin. Biochemistry. 1971;10:4617–4624. doi: 10.1021/bi00801a004. - DOI - PubMed
    1. Sugi H. Evidence for the essential role of myosin subfragment-2 in muscle contraction: Functional communication between myosin head and subfragment-2. J. Mater. Sci. Eng. 2017;6:386. doi: 10.4172/2169-0022.1000386. - DOI
    1. Hill A.V. The influence of temperature on the tension developed in an isometric twitch. Proc. Soc. Lond. B. 1951;138:349–354. doi: 10.1098/rspb.1951.0028. - DOI

LinkOut - more resources