

The asthma mobile health study, smartphone data collected using ResearchKit
- PMID: 29786695
- PMCID: PMC5963336
- DOI: 10.1038/sdata.2018.96
The asthma mobile health study, smartphone data collected using ResearchKit
Abstract
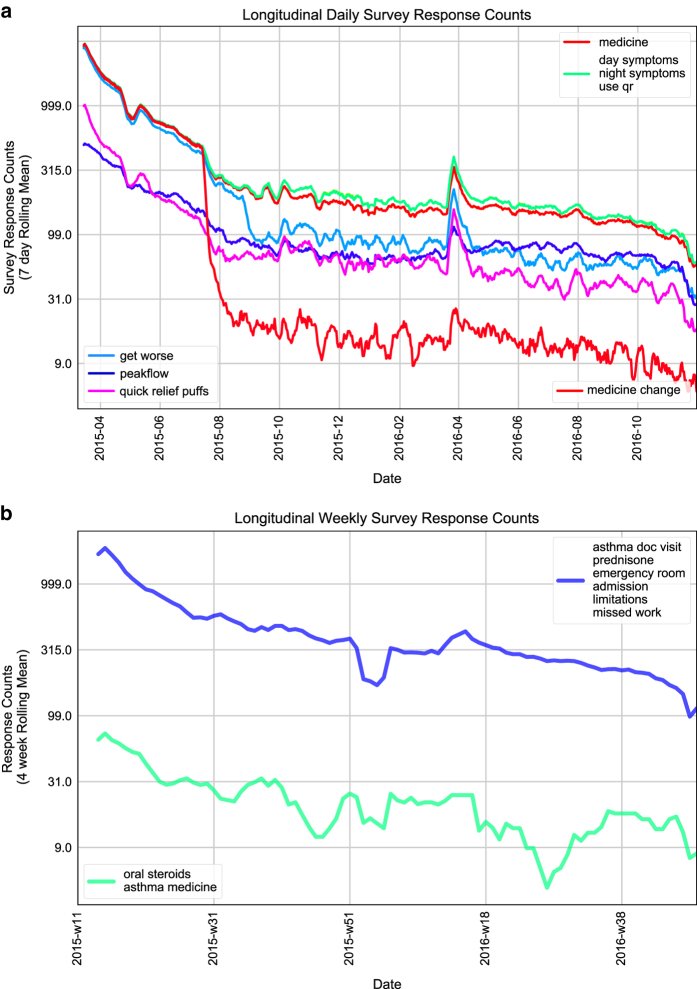
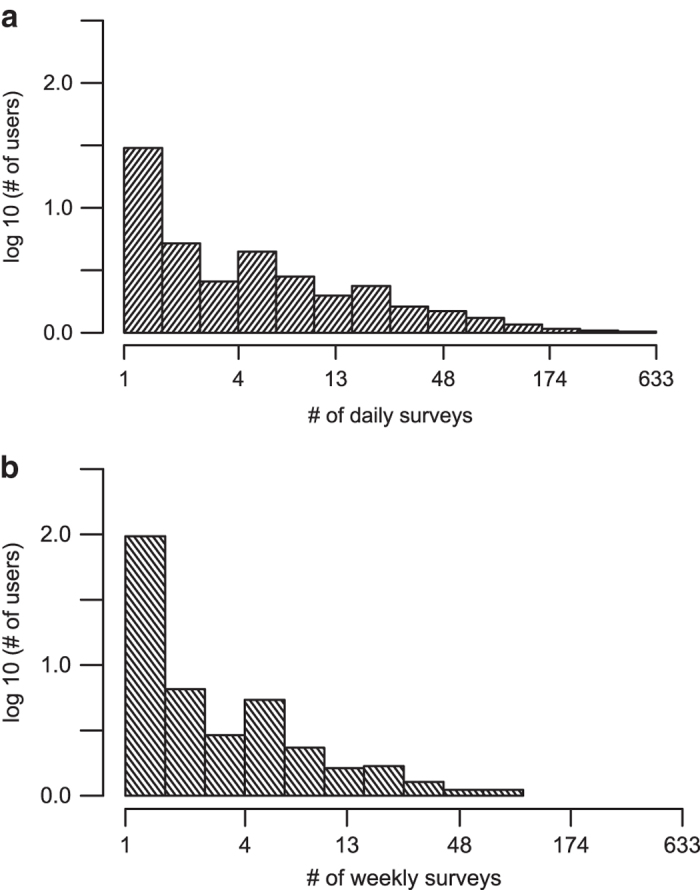
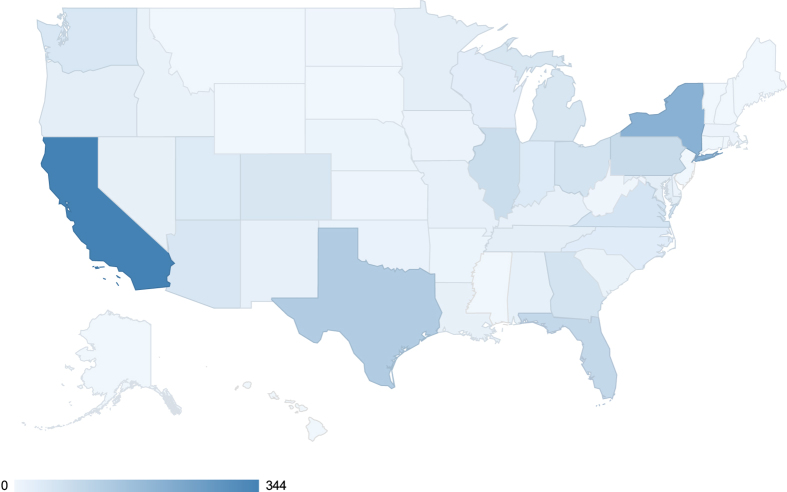
Widespread adoption of smart mobile platforms coupled with a growing ecosystem of sensors including passive location tracking and the ability to leverage external data sources create an opportunity to generate an unprecedented depth of data on individuals. Mobile health technologies could be utilized for chronic disease management as well as research to advance our understanding of common diseases, such as asthma. We conducted a prospective observational asthma study to assess the feasibility of this type of approach, clinical characteristics of cohorts recruited via a mobile platform, the validity of data collected, user retention patterns, and user data sharing preferences. We describe data and descriptive statistics from the Asthma Mobile Health Study, whereby participants engaged with an iPhone application built using Apple's ResearchKit framework. Data from 6346 U.S. participants, who agreed to share their data broadly, have been made available for further research. These resources have the potential to enable the research community to work collaboratively towards improving our understanding of asthma as well as mobile health research best practices.
Conflict of interest statement
Eric Schadt (a Co-Investigator in this study and Chair of the Department of Genetics and Genomics Sciences, and Director of the Icahn Institute for Genomics and Multiscale Biology at the Icahn School of Medicine at Mount Sinai) holds equity in the form of stock options in LifeMap Solutions, a privately held company. In addition Schadt serves as an uncompensated advisory board member and is administratively responsible for the medical school’s collaboration with LifeMap Solutions.
Figures


Dataset use reported in
- doi: 10.1038/nbt.3826
References
Data Citations
-
- Chan Y. F. Y. 2017. Synapse. http://dx.doi.org/10.7303/syn8466435.1 - DOI
-
- Chan Y. F. Y. 2017. Synapse. http://dx.doi.org/10.7303/syn8466429.1 - DOI
-
- Chan Y. F. Y. 2017. Synapse. http://dx.doi.org/10.7303/syn8466433.1 - DOI
-
- Chan Y. F. Y. 2017. Synapse. http://dx.doi.org/10.7303/syn8466442.1 - DOI
-
- Chan Y. F. Y. 2017. Synapse. http://dx.doi.org/10.7303/syn8466443.1 - DOI
References
-
- Lella Adam US Smartphone Penetration Surpassed 80% in 2016. Comscore https://www.comscore.com/Insights/Blog/US-Smartphone-Penetration-Surpass... (2017).
-
- Behavioral risk factor surveillance system: 2016 summary data quality report (Centers for Disease Control, 2017).
-
- Global strategy for asthma management and prevention. (Global Initiative for Asthma, (2017).
Publication types
MeSH terms
LinkOut - more resources
Full Text Sources
Other Literature Sources
Medical
