. 2018 Sep;46(9):1325-1336.
doi: 10.1007/s10439-018-2048-0. Epub 2018 May 21.

A Framework for Image-Based Modeling of Acute Myocardial Ischemia Using Intramurally Recorded Extracellular Potentials

Affiliations

A Framework for Image-Based Modeling of Acute Myocardial Ischemia Using Intramurally Recorded Extracellular Potentials

Brett M Burton et al. Ann Biomed Eng. 2018 Sep.

Abstract

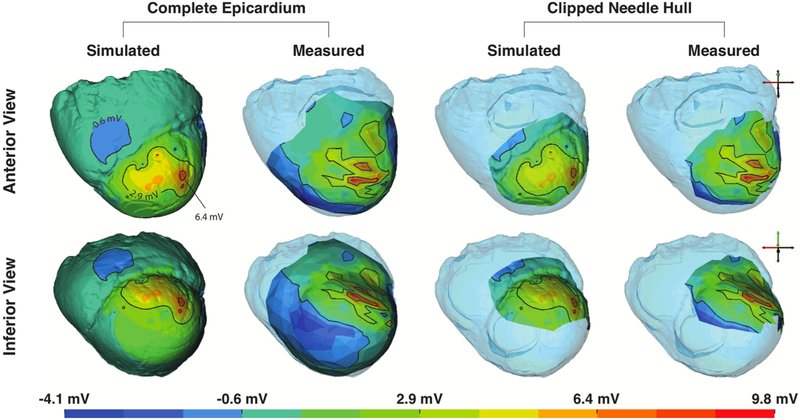
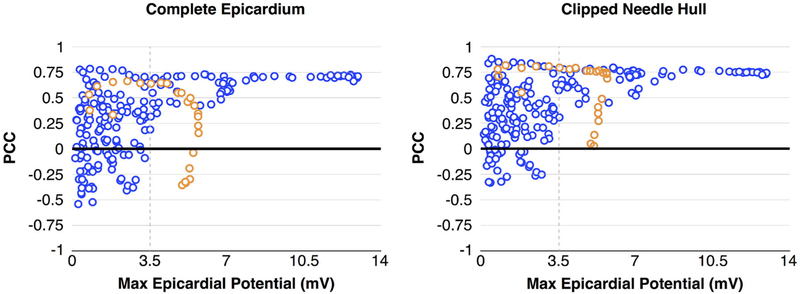
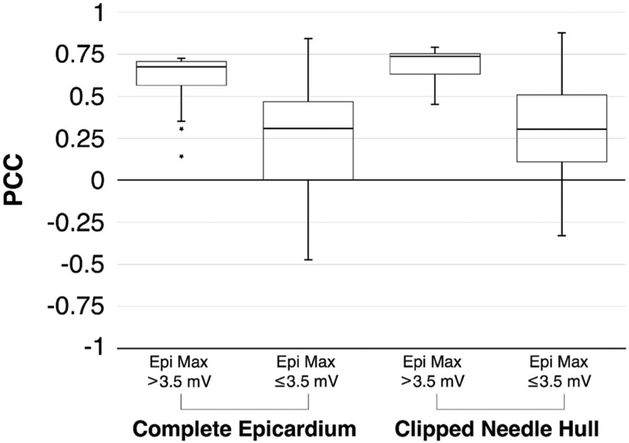
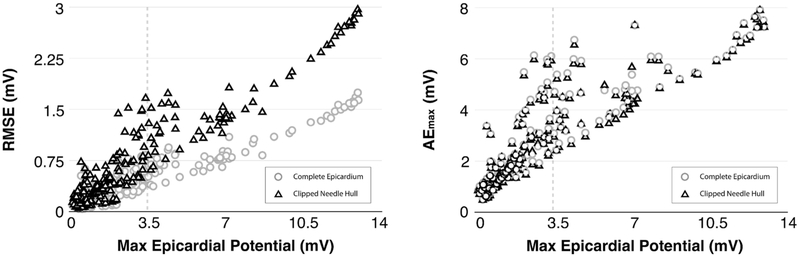
The biophysical basis for electrocardiographic evaluation of myocardial ischemia stems from the notion that ischemic tissues develop, with relative uniformity, along the endocardial aspects of the heart. These injured regions of subendocardial tissue give rise to intramural currents that lead to ST segment deflections within electrocardiogram (ECG) recordings. The concept of subendocardial ischemic regions is often used in clinical practice, providing a simple and intuitive description of ischemic injury; however, such a model grossly oversimplifies the presentation of ischemic disease-inadvertently leading to errors in ECG-based diagnoses. Furthermore, recent experimental studies have brought into question the subendocardial ischemia paradigm suggesting instead a more distributed pattern of tissue injury. These findings come from experiments and so have both the impact and the limitations of measurements from living organisms. Computer models have often been employed to overcome the constraints of experimental approaches and have a robust history in cardiac simulation. To this end, we have developed a computational simulation framework aimed at elucidating the effects of ischemia on measurable cardiac potentials. To validate our framework, we simulated, visualized, and analyzed 226 experimentally derived acute myocardial ischemic events. Simulation outcomes agreed both qualitatively (feature comparison) and quantitatively (correlation, average error, and significance) with experimentally obtained epicardial measurements, particularly under conditions of elevated ischemic stress. Our simulation framework introduces a novel approach to incorporating subject-specific, geometric models and experimental results that are highly resolved in space and time into computational models. We propose this framework as a means to advance the understanding of the underlying mechanisms of ischemic disease while simultaneously putting in place the computational infrastructure necessary to study and improve ischemia models aimed at reducing diagnostic errors in the clinic.

Keywords: Cardiac simulation; Computer model; Electrocardiographic forward problem; Extracellular potentials; Ischemia; ST deviation.


Figures

FIGURE 1.
FIGURE 1.
Ischemia Simulation Pipeline. Imaging and time signal data were extracted from experimental protocols of acute, controlled ischemia in dogs. Imaging files were used to generate geometric models through segmentation and meshing. Cardiac fibers and intramural electrical signals were aligned and mapped within the geometric models and used to simulate epicardial potentials, which were subsequently validated against recorded, unipolar electrograms.
FIGURE 2.
FIGURE 2.
Image and Geometric Processing. MRI images were segmented, (a), to created volumetric representations of the heart from which cardiac meshes were generated, (c). Principal eigenvector fields from DW-MRI were mapped onto the cardiac meshes using weighted average interpolation, (e), where vector glyph coloration is dictated by direction—as indicated by the axes in the upper right corner. (b, d) and (f) are enlarged views of smaller regions of the images above.
FIGURE 3.
FIGURE 3.
Registration. Plunge needle geometries (left) were isolated through MRI segmentation to provide the basis for needle electrode locations within the cardiac mesh. Sock geometries were registered to the epicardial surface mesh in two phases. Phase I (middle) applied a rigid, procrustes algorithm to a pre-constructed cardiac sock template. Phase II (right), utilized a thin-plate-spline morphing algorithm to project Phase I node locations onto the epicardial mesh surface.
FIGURE 4.
FIGURE 4.
Assessment of Simulations from Experiment 1. Simulated and measured ST40% potential amplitudes, considering two different degrees of coverage, are shown in two different orientations. The complete epicardium (leftmost quadrant) and a subset of the epicardial surface that corresponds to the region captured directly over the needle electrodes (rightmost quadrant) show views along both the anterior-to-posterior axis (upper) and inferior-to-superior axis (lower).
FIGURE 5.
FIGURE 5.
Assessment of Simulations from Experiment 2. Figure layout is identical to that of Fig. 4. The color map was adjusted to match the more muted ST40% potentials specific to this experiment. Also, due to physical constraints in this experiment, sock electrodes did not entirely cover the ventricles, leading to reduced epicardial coverage in the RV basal region.
FIGURE 6.
FIGURE 6.
PCC vs. Ischemic Stress. Correlation between ischemic stress, measured as a function of maximum epicardial potential values, show improved PCC with increased ischemic stress. Blue markers make up the majority of individual ischemic events, which exhibited predictable outcomes. Orange markers represent a sequence of related measurements in which prolonged ischemic stress produced elevated but progressively uncorrelated ST40% potentials.
FIGURE 7.
FIGURE 7.
PCC Reliance on Ischemic Stress. Box plots for both coverage regions, Complete Epicardium and Clipped Needle Hull, show that consistently high correlation between measured and simulated solutions is dependent on the level of ischemic stress experienced by the heart as defined by level of maximum epicardial ST40% value.
FIGURE 8.
FIGURE 8.
Comparison of RMSE and AEmax Error Metrics. Both RMSE (left) and AEmax (right) exhibited monotonically increasing behavior with respect to ischemic stress. Circles, representing the ‘Complete Epicardium,’ vs. those that consider only the ‘Clipped Needle Hull’ (triangle). RMSE measures increased more slowly along the ‘Complete Epicardium’ than they did along the ‘Clipped Needle Hull.’ AE measures, in contrast, increased in unison.

References

    1. Akkerhuis K and Simoons M. Exercise electrocardiography and exercise testing In: Comprehensive Electrocardiology, Vol. 1, chapter 36, edited by Macfarlane P, van Oosterom A, Pahlm O, Kligfield P, Janse M, and Camm J, 2nd ed. London, England: Springer, 2011, pp. 1677–1719.
    1. Aras K, Burton B, Swenson D, and MacLeod R. Sensitivity of epicardial electrical markers to acute ischemia detection. J. Electrocardiol 47:836–841, 2014. - PMC - PubMed
    1. Aras K, Burton B, Swenson D, and MacLeod R. Spatial organization of acute myocardial ischemia. J. Electrocardiol 49:323–336, 2016. - PMC - PubMed
    1. Arisi G, Macchi E, Corradi C, Lux R, and Taccardi B. Epicardial excitation during ventricular pacing: Relative independence of breakthrough sites from excitation sequence in canine right ventricle. Circ. Res 71:840–849, 1992. - PubMed
    1. Callahan M, Cole M, Shepherd J, Stinstra J, and Johnson C. BioMesh3D: A meshing pipeline for biomedical models SCI Institute Technical Report UUSCI-2007-009, University of Utah, 2007.

LinkOut - more resources