

Microbial micropatches within microbial hotspots
- PMID: 29787564
- PMCID: PMC5963804
- DOI: 10.1371/journal.pone.0197224
Microbial micropatches within microbial hotspots
Abstract
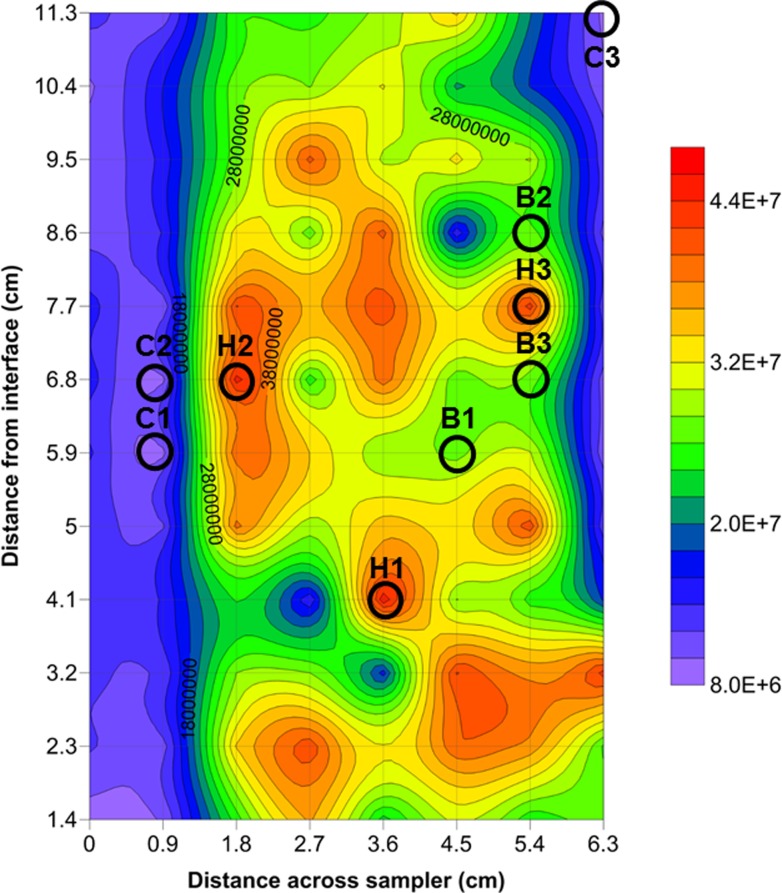
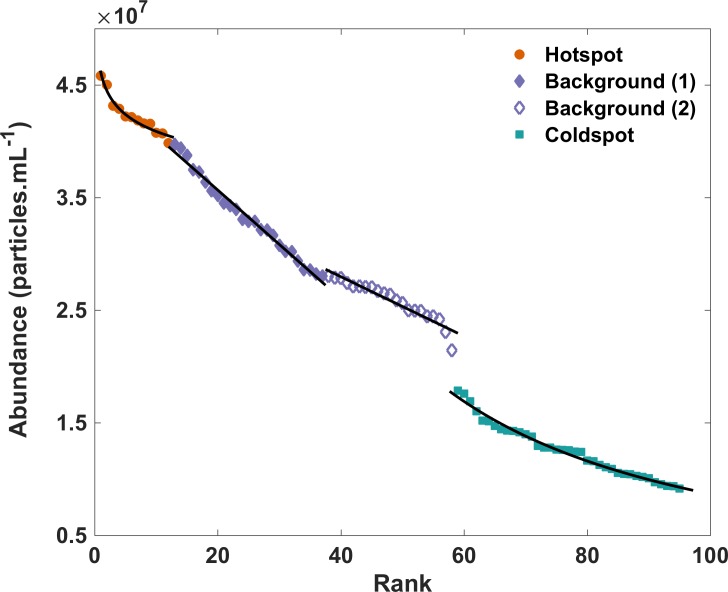
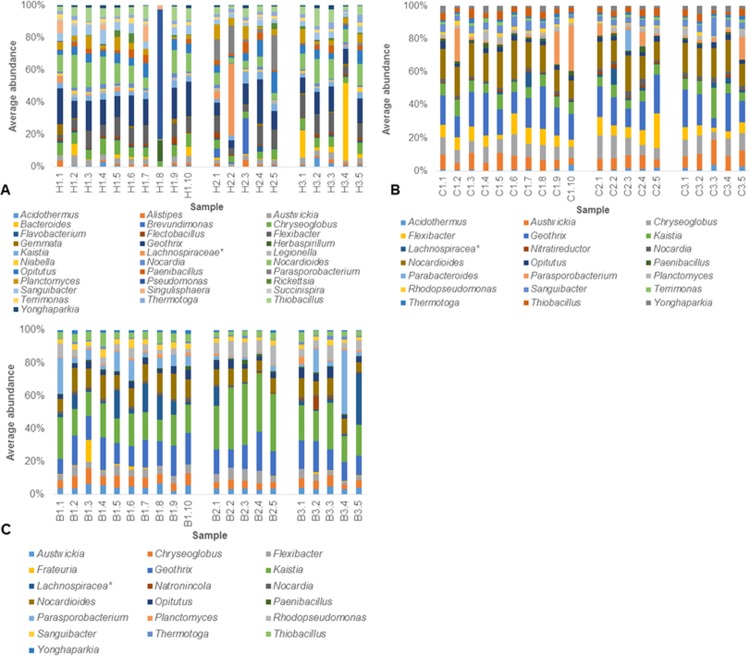
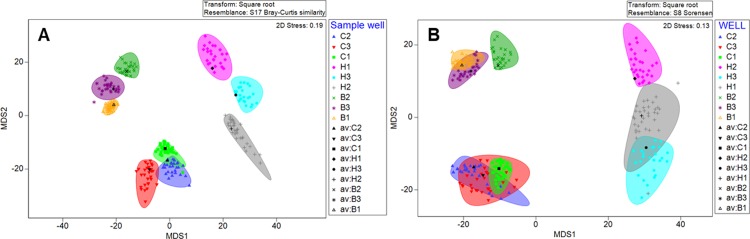
The spatial distributions of organism abundance and diversity are often heterogeneous. This includes the sub-centimetre distributions of microbes, which have 'hotspots' of high abundance, and 'coldspots' of low abundance. Previously we showed that 300 μl abundance hotspots, coldspots and background regions were distinct at all taxonomic levels. Here we build on these results by showing taxonomic micropatches within these 300 μl microscale hotspots, coldspots and background regions at the 1 μl scale. This heterogeneity among 1 μl subsamples was driven by heightened abundance of specific genera. The micropatches were most pronounced within hotspots. Micropatches were dominated by Pseudomonas, Bacteroides, Parasporobacterium and Lachnospiraceae incertae sedis, with Pseudomonas and Bacteroides being responsible for a shift in the most dominant genera in individual hotspot subsamples, representing up to 80.6% and 47.3% average abundance, respectively. The presence of these micropatches implies the ability these groups have to create, establish themselves in, or exploit heterogeneous microenvironments. These genera are often particle-associated, from which we infer that these micropatches are evidence for sub-millimetre aggregates and the aquatic polymer matrix. These findings support the emerging paradigm that the microscale distributions of planktonic microbes are numerically and taxonomically heterogeneous at scales of millimetres and less. We show that microscale microbial hotspots have internal structure within which specific local nutrient exchanges and cellular interactions might occur.
Conflict of interest statement
The authors have declared that no competing interests exist.
Figures
Similar articles
-
Distributions of Virus-Like Particles and Prokaryotes within Microenvironments.PLoS One. 2016 Jan 19;11(1):e0146984. doi: 10.1371/journal.pone.0146984. eCollection 2016. PLoS One. 2016. PMID: 26785114 Free PMC article.
-
Virio- and bacterioplankton microscale distributions at the sediment-water interface.PLoS One. 2014 Jul 24;9(7):e102805. doi: 10.1371/journal.pone.0102805. eCollection 2014. PLoS One. 2014. PMID: 25057797 Free PMC article.
-
Restructuring of the Aquatic Bacterial Community by Hydric Dynamics Associated with Superstorm Sandy.Appl Environ Microbiol. 2016 May 31;82(12):3525-3536. doi: 10.1128/AEM.00520-16. Print 2016 Jun 15. Appl Environ Microbiol. 2016. PMID: 27060115 Free PMC article.
-
Sequencing Insights into Microbial Communities in the Water and Sediments of Fenghe River, China.Arch Environ Contam Toxicol. 2016 Jul;71(1):122-32. doi: 10.1007/s00244-016-0277-5. Epub 2016 Apr 6. Arch Environ Contam Toxicol. 2016. PMID: 27053089
-
Temperature controls on aquatic bacterial production and community dynamics in arctic lakes and streams.Environ Microbiol. 2010 May;12(5):1319-33. doi: 10.1111/j.1462-2920.2010.02176.x. Epub 2010 Feb 25. Environ Microbiol. 2010. PMID: 20192972
Cited by
-
Impact of micro-habitat fragmentation on microbial population growth dynamics.ISME J. 2025 Jan 2;19(1):wrae256. doi: 10.1093/ismejo/wrae256. ISME J. 2025. PMID: 39711055 Free PMC article.
-
Investigating microscale patchiness of motile microbes under turbulence in a simulated convective mixed layer.PLoS Comput Biol. 2022 Jul 27;18(7):e1010291. doi: 10.1371/journal.pcbi.1010291. eCollection 2022 Jul. PLoS Comput Biol. 2022. PMID: 35895753 Free PMC article.
-
Historical contingencies and phage induction diversify bacterioplankton communities at the microscale.Proc Natl Acad Sci U S A. 2022 Jul 26;119(30):e2117748119. doi: 10.1073/pnas.2117748119. Epub 2022 Jul 21. Proc Natl Acad Sci U S A. 2022. PMID: 35862452 Free PMC article.
-
Trade-off between sex and growth in diatoms: Molecular mechanisms and demographic implications.Sci Adv. 2022 Jan 21;8(3):eabj9466. doi: 10.1126/sciadv.abj9466. Epub 2022 Jan 19. Sci Adv. 2022. PMID: 35044817 Free PMC article.
References
-
- Azam F. Microbial control of oceanic carbon flux: the plot thickens. Science. 1998; 280 (5364): 694–696
-
- Azam F, Malfatti F. Microbial structuring of marine ecosystems. Nature Reviews Microbiology. 2007; 5: 782–791 doi: 10.1038/nrmicro1747 - DOI - PubMed
-
- Stocker R, Seymour JR, Samadani A, Hunt DE, Polz MF. Rapid chemotactic response enables marine bacteria to exploit ephemeral microscale nutrient patches. Proceedings of the National Academy of Sciences of the United States of America 2008; 105 (11): 4209–4214 doi: 10.1073/pnas.0709765105 - DOI - PMC - PubMed
-
- Hillmer I, Reenen PV, Imberger J, Zohary T. Phytoplankton patchiness and their role in the modelled productivity of a large, seasonally stratified lake. Ecological Modelling 2008; 218: 49–59. doi: 10.1016/j.ecolmodel.2008.06.017 - DOI
Publication types
MeSH terms
Substances
LinkOut - more resources
Full Text Sources
Other Literature Sources
