. 2018 Aug 13;57(33):10530-10534.
doi: 10.1002/anie.201802937. Epub 2018 Jun 19.

Mass Spectrometry Imaging with Isomeric Resolution Enabled by Ozone-Induced Dissociation

Affiliations

Mass Spectrometry Imaging with Isomeric Resolution Enabled by Ozone-Induced Dissociation

Martin R L Paine et al. Angew Chem Int Ed Engl. .

Abstract

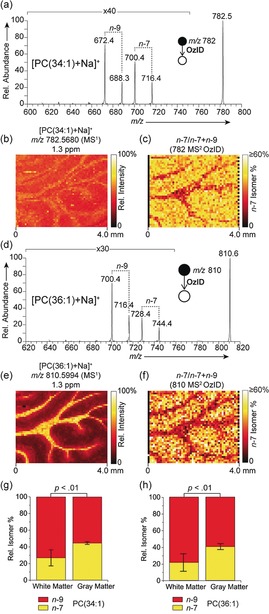
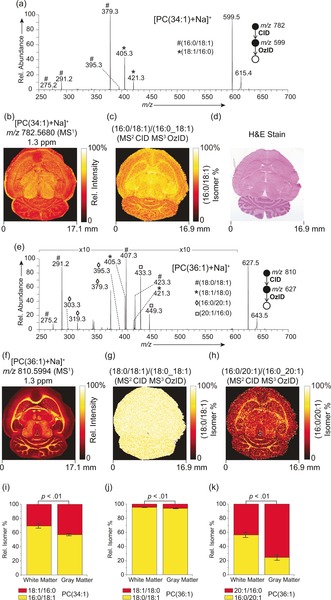
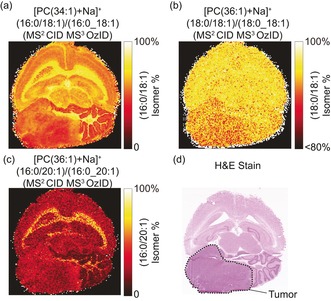
Mass spectrometry imaging (MSI) enables the spatial distributions of molecules possessing different mass-to-charge ratios to be mapped within complex environments revealing regional changes at the molecular level. Even at high mass resolving power, however, these images often reflect the summed distribution of multiple isomeric molecules, each potentially possessing a unique distribution coinciding with distinct biological function(s) and metabolic origin. Herein, this chemical ambiguity is addressed through an innovative combination of ozone-induced dissociation reactions with MSI, enabling the differential imaging of isomeric lipid molecules directly from biological tissues. For the first time, we demonstrate both double bond- and sn-positional isomeric lipids exhibit distinct spatial locations within tissue. This MSI approach enables researchers to unravel local lipid molecular complexity based on both exact elemental composition and isomeric structure directly from tissues.

Keywords: biochemistry; brain; isomers; mass spectrometry imaging; phospholipids.


Conflict of interest statement

The authors declare no conflict of interest.

Figures

Figure 1
Figure 1
a) MALDI‐OzID spectrum of [PC(34:1)+Na]+ ions revealing the presence of n−9 and n−7 db isomers. b) The corresponding full‐scan FTMS image of the [PC(34:1)+Na]+ ion (m/z 782.5680) and c) fractional distribution image of n−7 and n−9 isomers (n−7)/(n−7+n−9)) showing an enrichment of the n−7 isomer in the gray matter. d–f) Analogous spectra and images obtained for [PC(36:1)+Na]+, again revealing an enrichment of the n−7 isomer in the gray matter. OzID and full‐scan‐FTMS data were acquired from consecutive tissue sections. Graphs show the n−7 and n−9 relative isomer percentages for g) PC(34:1) and h) PC(36:1) within the white and gray matter. Error bars represent coefficient of variation from each region (n=5 each for white and gray matter regions).
Figure 2
Figure 2
a) MALDI‐CID/OzID spectrum of [PC(34:1)+Na]+ ions revealing the presence of PC(16:0/18:1) and PC (18:1/16:0) structural isomers. b) The corresponding full‐scan FTMS image of the [PC(34:1)+Na]+ ion and c) fractional distribution image of PC(16:0/18:1) ions as a fraction of PC(16:0_18:1)‐related ions. d) Post‐acquisition stained tissue. e) MALDI‐CID/OZID spectrum and f) full‐scan FTMS image of [PC(36:1)+Na]+ revealing the presence of four distinct sn‐positional isomers (PC(18:0/18:1), PC(18:1/18:0), PC(16:0/20:1) and PC(20:1/16:0). The corresponding fractional distribution images of g) PC(18:0/18:1) as a fraction of PC(18:0_18:1); and h) PC(16:0/20:1) as a fraction of PC(16:0_20:1)‐related ions. i–k) Graphs show relative isomer percentages for (i) the 16:0/18:1 and 18:1/16:1 isomers in PC(34:1); (j) the 18:0/18:1 and 18:1/18:0 isomers for PC(36:1); and (k) the 16:0/20:1 and 20:1/16:0 isomers for PC(36:1) within the white and gray matter. Error bars represent coefficient of variation (n=5 each for white and gray matter).
Figure 3
Figure 3
MALDI‐CID/OzID fractional distribution images of a) PC(16:0/18:1) as a fraction of PC(16:0_18:1) structural isomers from [PC(34:1)+Na]+ b) PC(18:0/18:1) as a fraction of PC(18:0_18:1) from [PC(36:1)+Na]+ and c) PC(16:0/20:1) as a fraction of PC(18:0_18:1) from [PC(36:1)+Na]+. These data were acquired from a mouse brain tissue section containing a medulloblastoma tumor. d) The post‐acquisition H&E stained tissue, the tumor region is outlined in black.

References

    1. None
    1. Zemski Berry K. A., Hankin J. A., Barkley R. M., Spraggins J. M., Caprioli R. M., Murphy R. C., Chem. Rev. 2011, 111, 6491; - PMC - PubMed
    1. McDonnell L. A., Heeren R. M. A., Mass Spectrom. Rev. 2007, 26, 606; - PubMed
    1. Addie R. D., Balluff B., Bovée J. V. M. G., Morreau H., McDonnell L. A., Anal. Chem. 2015, 87, 6426; - PubMed
    1. Schwamborn K., Caprioli R. M., Nat. Rev. Cancer 2010, 10, 639. - PubMed

Publication types

LinkOut - more resources