. 2018 May 21;45(4):450-464.e3.
doi: 10.1016/j.devcel.2018.04.020.

Plasma Membrane Localization of Apoptotic Caspases for Non-apoptotic Functions

Affiliations

Plasma Membrane Localization of Apoptotic Caspases for Non-apoptotic Functions

Alla Amcheslavsky et al. Dev Cell. .

Abstract

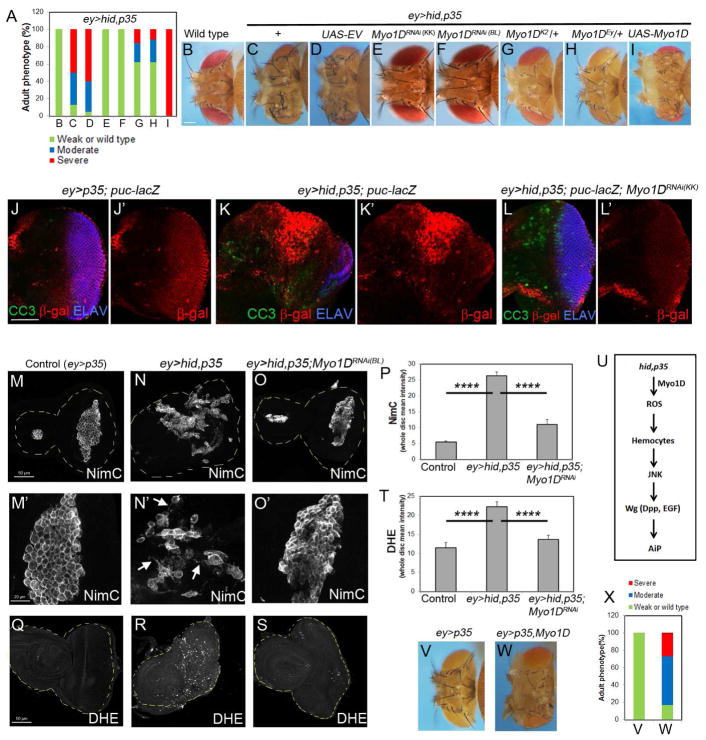
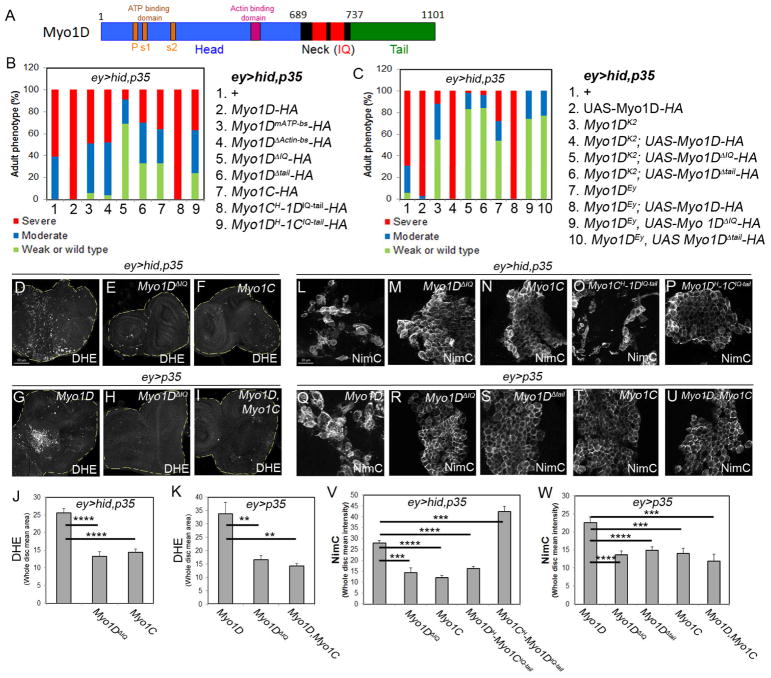
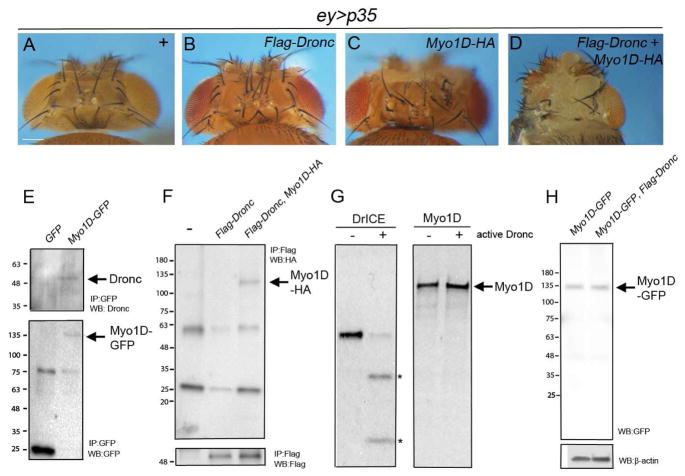
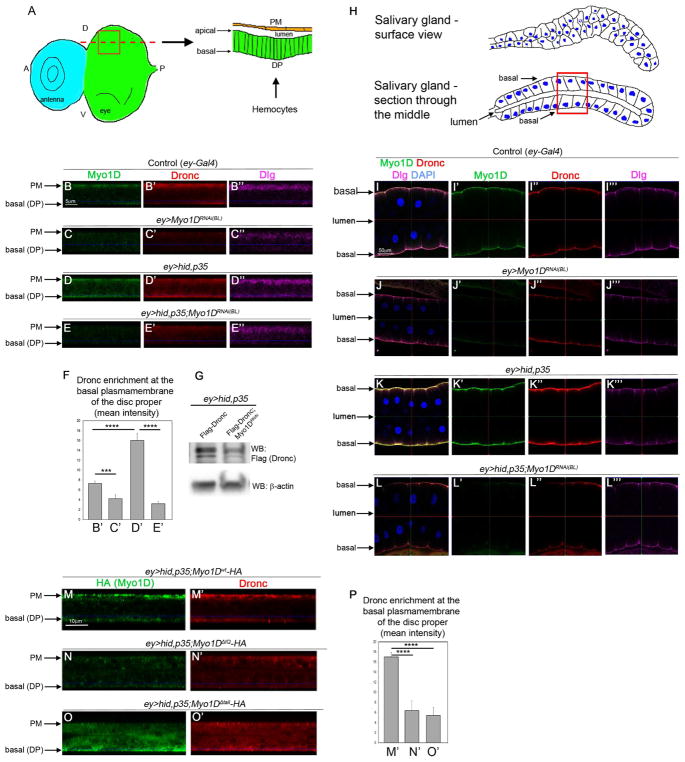
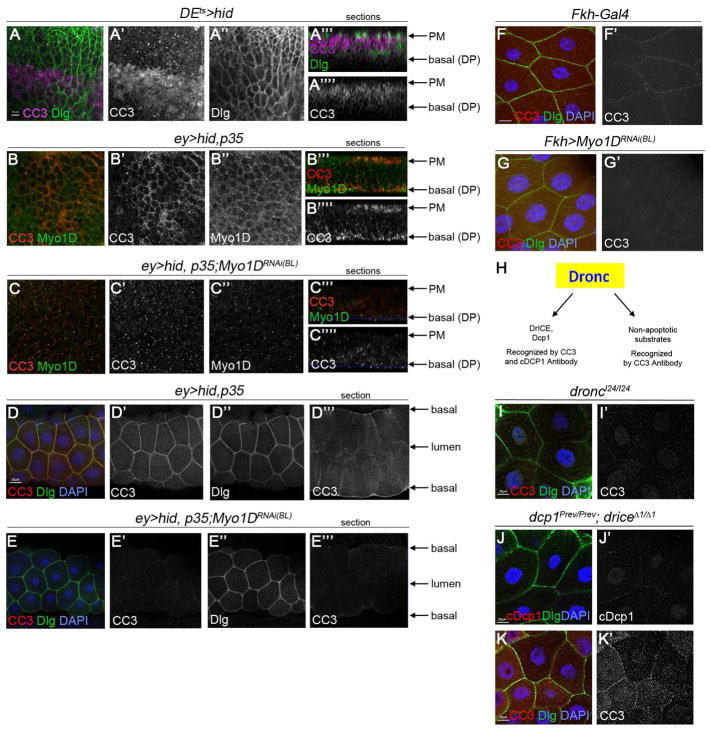
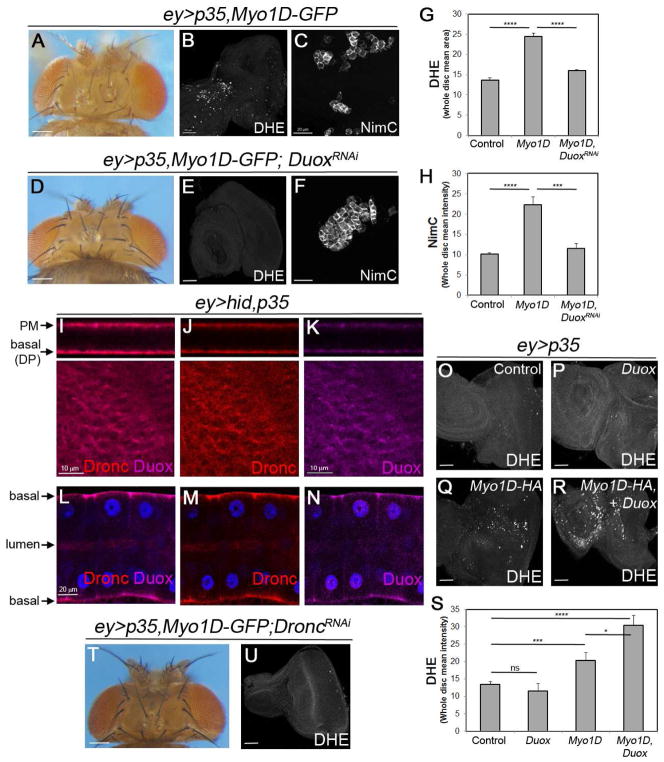
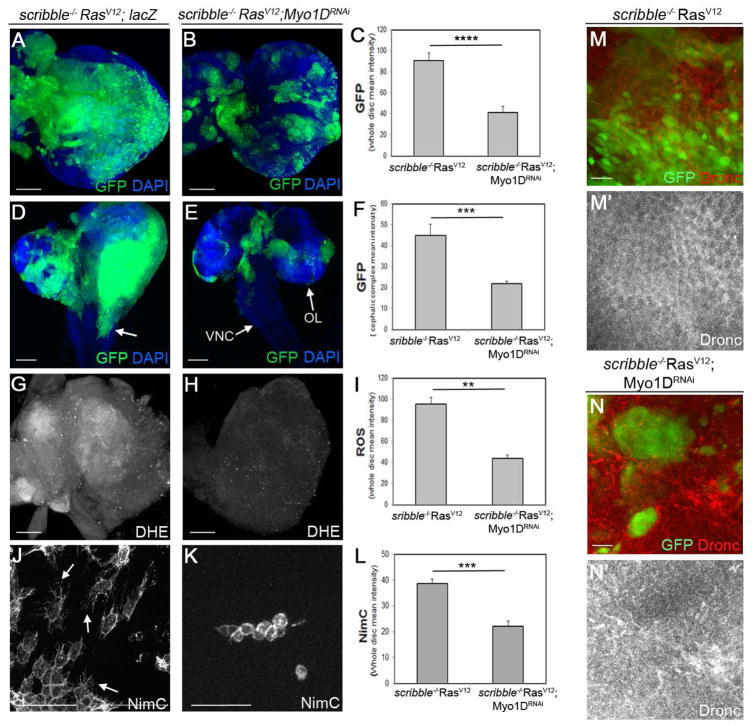
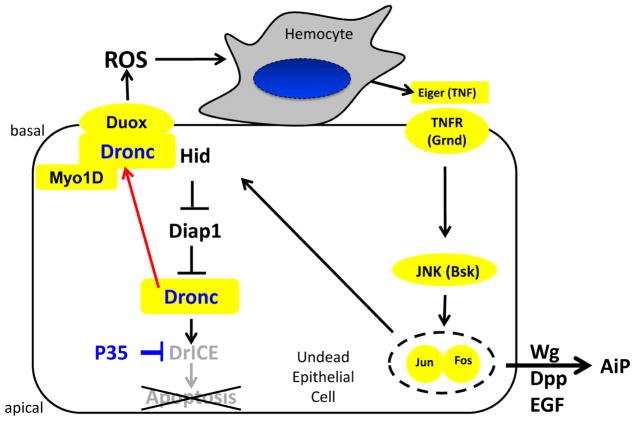
Caspases are best characterized for their function in apoptosis. However, they also have non-apoptotic functions such as apoptosis-induced proliferation (AiP), where caspases release mitogens for compensatory proliferation independently of their apoptotic role. Here, we report that the unconventional myosin, Myo1D, which is known for its involvement in left/right development, is an important mediator of AiP in Drosophila. Mechanistically, Myo1D translocates the initiator caspase Dronc to the basal side of the plasma membrane of epithelial cells where Dronc promotes the activation of the NADPH-oxidase Duox for reactive oxygen species generation and AiP in a non-apoptotic manner. We propose that the basal side of the plasma membrane constitutes a non-apoptotic compartment for caspases. Finally, Myo1D promotes tumor growth and invasiveness of the neoplastic scrib RasV12 model. Together, we identified a new function of Myo1D for AiP and tumorigenesis, and reveal a mechanism by which cells sequester apoptotic caspases in a non-apoptotic compartment at the plasma membrane.

Keywords: Dronc; Drosophila; Myo1D; apoptosis-induced proliferation; non-apoptotic functions; plasma membrane.


Conflict of interest statement

Declaration of Interests

The authors declare no competing interests.

Figures

Figure 1
Figure 1. Myo1D is required for undead tissue overgrowth upstream of ROS production
(A) Quantification of the suppression of head overgrowth of ey>hid,p35 animals by Myo1D RNAi or Myo1D mutants as shown in (C–H). Displayed is also the enhancement by Myo1D misexpression (I). Suppression is determined based on a shift in the percentage from overgrown animals to wild-type. Details to statistics in this and all other figures can be found in STAR Methods. 50–150 flies were counted per genotype. (B) The head capsule of a wild type fly. Scale bar: 200μm. (C,D) Head capsule overgrowth of ey>hid,p35 animals (C) is not suppressed by a control UAS-empty vector (UAS-EV) transgene (D). (E–H) Representative examples of the suppression of ey>hid,p35-induced head overgrowth by Myo1D RNAi (E,F) and Myo1D mutants (G,H). Myo1DRNAi(KK) in (E) is VDRC line KK102456, Myo1DRNAi(BL) in (F) is Bloomington line BL33971. Myo1DEy in (H) is Myo1DEy08859. (I) Strong enhancement of the overgrowth phenotype of ey>hid,p35 animals by Myo1D misexpression. (J–L′) Eye imaginal discs of the indicated genotypes labeled for β-Gal (red, to visualize JNK activity), cleaved caspase3 (CC3, green) and ELAV (blue) which marks photoreceptor neurons in the posterior half of the disc. Scale bar: 50μm. (M–O′) Hemocyte labeling using anti-NimrodC (NimC) antibody (Kurucz et al., 2007) of eye imaginal discs of indicated genotype. Arrows in (N′) indicate cytoplasmic protrusions of activated hemocytes. Scale bars in (N): 50μm; in (N′): 20μm. (P) Quantification of the NimC labelings in (M–O). NimC signal intensity was determined across the entire discs. (Q–S) DHE labeling as ROS marker of imaginal discs of the same genotypes as in (M–O). Scale bar: 50μm. (T) Quantification of DHE labelings in (Q–S). DHE signal intensity was determined across the entire discs. (U) Schematic summary of the placement of Myo1D into the AiP pathway. (V–X) Misexpression of Myo1D in ey>p35 animals triggers head capsule overgrowth (W). Quantified in (X). See also Figure S1, S2 and S3.
Figure 2
Figure 2. The neck (IQ) and tail regions of Myo1D are critical for AiP
(A) Outline of the domain structure of Myo1D. P = P-loop; s1/2 = switch1/2-loop. (B) Summary of the head phenotypes of ey>hid,p35 animals expressing the transgenes numbered and listed on the right. All Myo1D transgenes carry a HA-tag at the C-terminus. (C) Summary of the rescue experiments of Myo1DK2 and Myo1DEY (Myo1DEy08859) mutants with wt and mutant Myo1D transgenes. The key to each genotype is numbered and listed on the right. (D–I) DHE labeling as ROS marker of eye imaginal discs of indicated genotype. Myo1C suppresses Myo1D-induced ROS generation (I). Scale bar: 50μm. (J,K) Quantification of the DHE labelings in (D–F) and (G–I). DHE signal intensity was determined across the entire discs. (L–T) NimC labeling for visualization of hemocytes attached to eye imaginal discs of indicated genotype. Note that the activated hemocyte morphology in (L,O,Q) is absent in (M,N,P,R,S,T,U). Quantifications in (V) and (W). Scale bars: 20μm. (V,W) Quantification of the NimC labelings in (L–P) and (Q–U) reveals that hemocytes recruitment to undead tissue requires the IQ (neck) and tail domains of Myo1D and can be antagonized by Myo1C. NimC signal intensity was determined across the entire discs. See also Figure S4.
Figure 3
Figure 3. Genetic and physical interaction between Myo1D and Dronc
(A–D) Head capsule phenotypes of the indicated genotypes. Scale bar: 200μm. (E) Extracts from ey>hid,p35,GFP and ey>hid,p35;Myo1D-GFP eye/antennal imaginal discs were immunoprecipated with anti-GFP antibodies. Shown are immunoblots of Myo1D-GFP immunoprecipitates probed with anti-Dronc (SK11) (top) and anti-GFP antibodies (bottom). Arrows indicate Myo1D-GFP and Dronc. (F) Extracts from ey-Gal4 (-), ey>Flag-Dronc and ey>Flag-Dronc,Myo1D-HA eye/antennal imaginal discs were immunoprecitated with anti-Flag antibodies. Shown are immunoblots probed with anti-HA antibodies to visualize Myo1D-HA (top, arrow) and with anti-Flag antibodies to reveal Flag-Dronc (bottom). (G) Autoradiographs of in vitro cleavage assays of radio-labeled DrICE (positive control) and radio-labeled Myo1D by unlabeled active Dronc. Asterisks mark the cleavage products of DrICE. (H) Immunoblot analysis of total extracts from ey>hid,p35;Myo1D-GFP eye/antennal imaginal discs using anti-GFP antibodies.
Figure 4
Figure 4. Myo1D localizes Dronc to the basal side of the plasma membrane
(A) Left: surface view of the larval eye-antennal imaginal disc at the disc proper (DP) level. Right: orthogonal section through the red square along the red dotted line. The peripodial membrane (PM; orange) and the DP (green) are separated by a lumen. The apical and basal membranes of the DP are indicated by arrows. Hemocytes approach the disc at the DP side. A-anterior; P-posterior; D-dorsal; V-ventral. (B–E‴) Confocal sections as indicated in the schematic drawing in (A) of eye imaginal discs of the indicated genotype labeled for endogenous Myo1D (green), Dronc (red) and Dlg (magenta). The discs were processed in parallel and imagined under the same settings. The peripodial membrane (PM) and the basal side of the disc proper (DP) are indicated by arrows in the sections. Scale bar: 5 μm. (F) Quantification of the Dronc labelings in (B–E) at the basal side of the plasma membrane of DP cells. Signal intensity was determined only at the basal side of the plasma membrane. (G) Immunoblot analysis of total extracts from larval eye imaginal discs of the indicated genotype suggests that endogenous Dronc protein is destabilized by absence of Myo1D due to Myo1D RNAi (BL33971). (H) Schematic drawings of the morphology of salivary glands in surface view (top) and in sections through the middle of the gland (bottom). The basal sides of the plasma membrane are identified by arrows. The apical sides face the lumen of the gland. Nuclei are in blue. The red square depicts the view in panels (I–L). (I–L‴) Confocal section views as illustrated by the red square in (H) of larval salivary glands of indicated genotypes labeled for endogenous Myo1D (green), Dronc (red), Dlg (magenta) and DAPI (blue). The basal sides of the plasma membrane and the lumen are indicated by arrows. The glands were processed in parallel and imagined under the same settings. Scale bar: 50 μm. (M–O′) Confocal sections according to (A) through eye imaginal discs of the indicated genotypes labeled for HA (to detect Myo1D-HA) and endogenous Dronc. Peripodial membrane (PM) and basal side of disc proper (DP) are indicated by arrows. (P) Quantification of the Dronc labelings in (M′-O′) at the basal side of the plasma membrane of DP cells. Signal intensity was determined only at the basal side of the plasma membrane. See also Figure S5 and S6.
Figure 5
Figure 5. Non-apoptotic activity of Dronc at the plasma membrane
(A–C‴′) Surface (A–A″,B–B″,C–C″) and section views (A‴,A‴′,B‴,B‴′,C‴,C‴′) according to Figure 4A of eye imaginal discs of indicated genotype labeled with cleaved caspase3 (CC3, red), the polarity marker Dlg (in A; green) and endogenous Myo1D (in B,C; green). Peripodial membrane (PM) and the basal side of the disc proper (DP) are indicated by arrows on the right of the sections. In (A), apoptosis was induced by shifting to 30°C for 12 hours prior to dissection (Fan et al., 2014). Scale bar: 10μm. (D–E‴) Surface (D–D″;E–E″) and section views (D‴;E‴) of larval salivary glands (SG) according to Figure 4H of the indicated genotype labeled with CC3 and the polarity marker Dlg. In the sections, the basal sides of the plasma membrane and the lumen are indicated by arrows. (F,G) Surface views of larval SGs of indicated genotype labeled for CC3 (green), the polarity marker Dlg (red) and DAPI (blue). Normal SGs have weak membrane localization of CC3 (F′) that is completely lost upon Myo1D RNAi driven by Fkh-Gal4 (G′). Scale bar: 20μm. (H) Illustration of the specificities of CC3 and cDcp1 antibodies with respect to the apoptotic and non-apoptotic cleavage targets of Dronc. (I,K′) droncI24/I24 (I) mutant and dcpPrev/Prev;drICE Δ1/Δ1 (J,K) double mutant SGs labeled for CC3 in (I,K), cleaved Dcp1 (cDcp1) in (J), the polarity marker Dlg and DAPI. Scale bars: 20μm.
Figure 6
Figure 6. Myo1D requires Duox for its function in apoptosis-induced proliferation
(A–C) The overgrown head capsule (A) of ey>p35,Myo1D-GFP animals correlates with ROS production (DHE labeling in (B)) and activated hemocytes (NimC labeling in (C)) in larval imaginal eye discs. Scale bars: 200, 50 and 20 μm in (A), (B) and (C), respectively. (D–F) Knockdown of Duox in ey>p35,Myo1D-GFP animals suppresses the overgrowth of the head capsule (D), ROS production (E) and hemocytes activation (F). (G,H) Quantification of DHE (G) and NimC (H) labelings in (B,E) and (C,F) panels, respectively. Signal intensities were determined across entire discs. (I–K) Endogenous Duox (magenta) and Dronc (red) proteins co-localize at the PM and basal plasma membrane of DP cells in ey>hid,p35 eye imaginal discs. Scale bar: 10 μm. (L–N) Endogenous Duox (magenta) and Dronc (red) proteins co-localize at the basal side of the plasma membrane of larval ey>hid,p35 SG cells. Blue = DAPI (nuclei). Scale bar: 20 μm. (O–R) Myo1D and Duox synergize for production of ROS in ey>p35 discs. Scale bar: 50 μm. (S) Quantification of DHE labelings in (O–R). Signal intensities were determined across entire discs. ns - not significant. (T,U) dronc RNAi suppresses overgrowth of head capsules of (T) and ROS generation in eye discs (U) of ey>p35,Myo1D-GFP animals (compare to A,B).
Figure 7
Figure 7. Myo1D is required for neoplastic tumor growth and invasion of scrib−/−RasV12 cells
scrib−/−RasV12 mutant clones are generated by the MARCM system and are marked by GFP. UAS-lacZ was used as control transgene in (A,D,G,J). (A–L) Growth of scrib−/−RasV12 clones (A), invasion of mutant tissue into the ventral nerve cord (VNC) of the larval brain (D, arrow), generation of ROS (DHE) by scrib−/−RasV12 mosaic discs (G) and recruitment and activation (arrows in J) of hemocytes (NimC) to scrib−/−RasV12 mosaic discs (J) is prevented by Myo1D RNAi (BL33791) (B,E,H,K). OL – optic lobe. Quantifications in (C,F,I,L). Signal intensities (GFP, DHE, NimC) were determined across entire discs. Scale bars: 50 μm in A,B,G,H,J,K; 100 μm (D,E). (M–N′) Membrane association of Dronc protein in scrib−/−RasV12 mutant clones (M′) is disrupted by Myo1D RNAi (N′). Scale bars: 20 μm.
Figure 8
Figure 8. Model of Myo1D function in apoptosis-induced proliferation
The data presented in this paper suggest that Myo1D is required for membrane localization of Dronc, specifically to the basal side of the plasma membrane of undead epithelial disc proper and salivary gland cells. Here, Dronc is required for activation of Duox for generation of extracellular ROS. Duox-generated ROS attract and activate hemocytes to the basal side of disc proper cells of eye imaginal discs. Hemocytes release Eiger to stimulate JNK activity and AiP in undead epithelial cells.

References

    1. Abbott MK, Lengyel JA. Embryonic head involution and rotation of male terminalia require the Drosophila locus head involution defective. Genetics. 1991;129:783–789. - PMC - PubMed
    1. Andrew DJ, Henderson KD, Seshaiah P. Salivary gland development in Drosophila melanogaster. Mech Dev. 2000;92:5–17. - PubMed
    1. Aram L, Braun T, Braverman C, Kaplan Y, Ravid L, Levin-Zaidman S, Arama E. A Krebs Cycle Component Limits Caspase Activation Rate through Mitochondrial Surface Restriction of CRL Activation. Developmental cell. 2016;37:15–33. - PubMed
    1. Aram L, Yacobi-Sharon K, Arama E. CDPs: caspase-dependent non-lethal cellular processes. Cell Death Differ. 2017;24:1307–1310. - PMC - PubMed
    1. Barylko B, Binns DD, Albanesi JP. Regulation of the enzymatic and motor activities of myosin I. Biochimica et biophysica acta. 2000;1496:23–35. - PubMed

Publication types

MeSH terms

LinkOut - more resources