. 2018 May 21;45(4):496-511.e6.
doi: 10.1016/j.devcel.2018.04.022.

Microtubule Dynamics Scale with Cell Size to Set Spindle Length and Assembly Timing

Affiliations

Microtubule Dynamics Scale with Cell Size to Set Spindle Length and Assembly Timing

Benjamin Lacroix et al. Dev Cell. .

Abstract

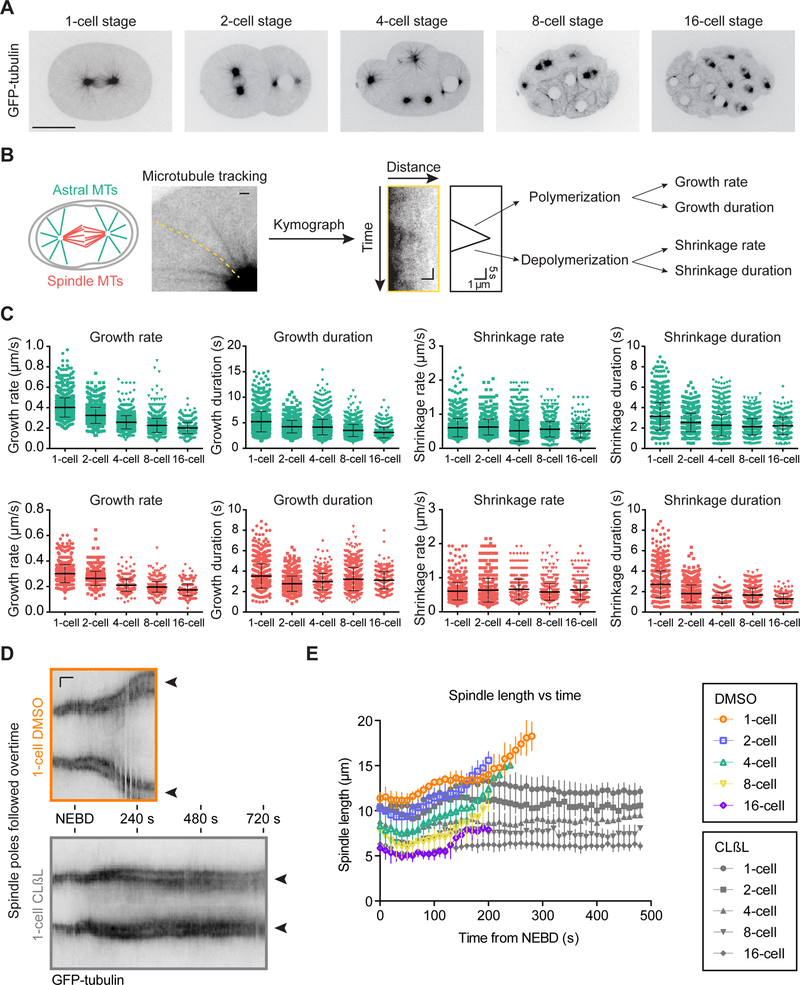
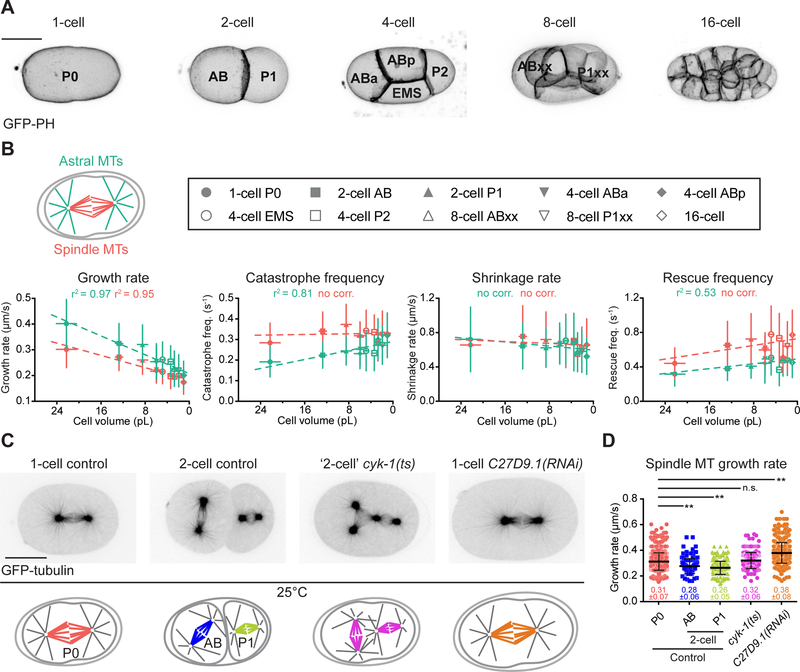
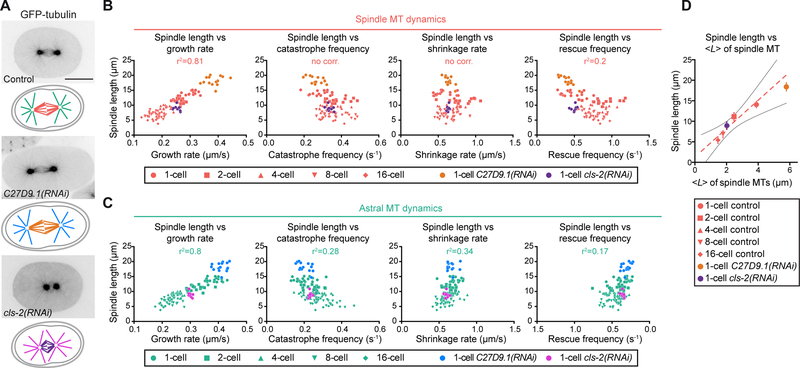
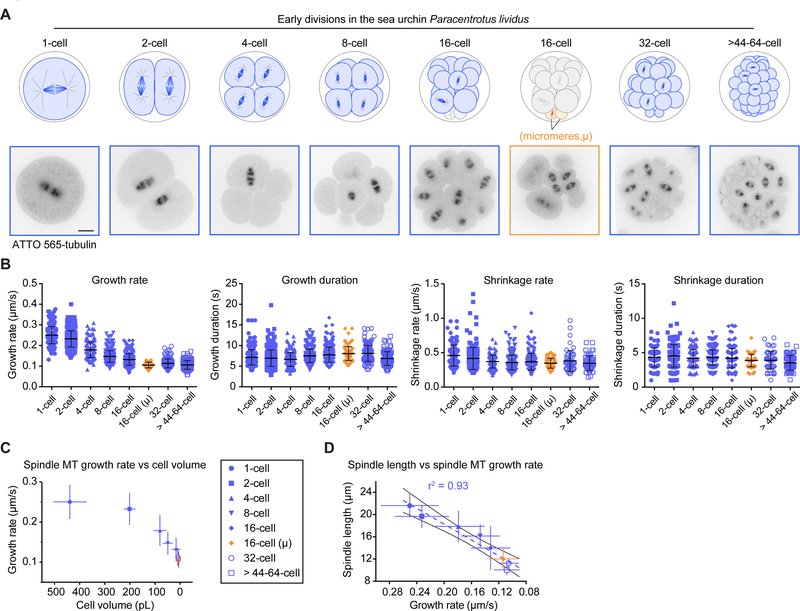
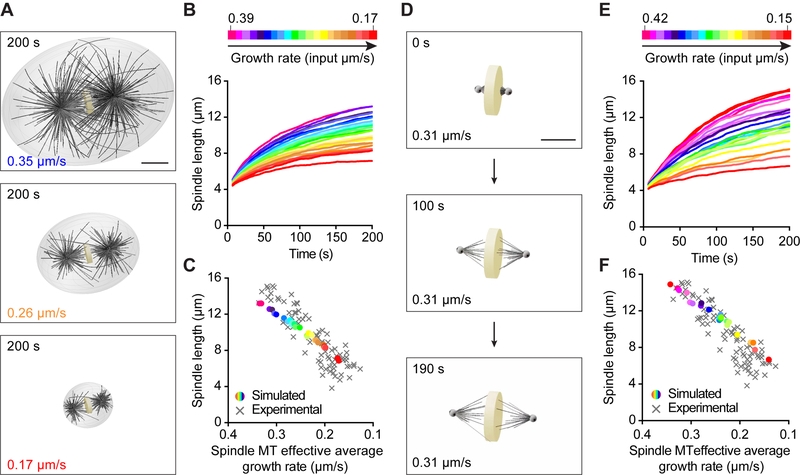
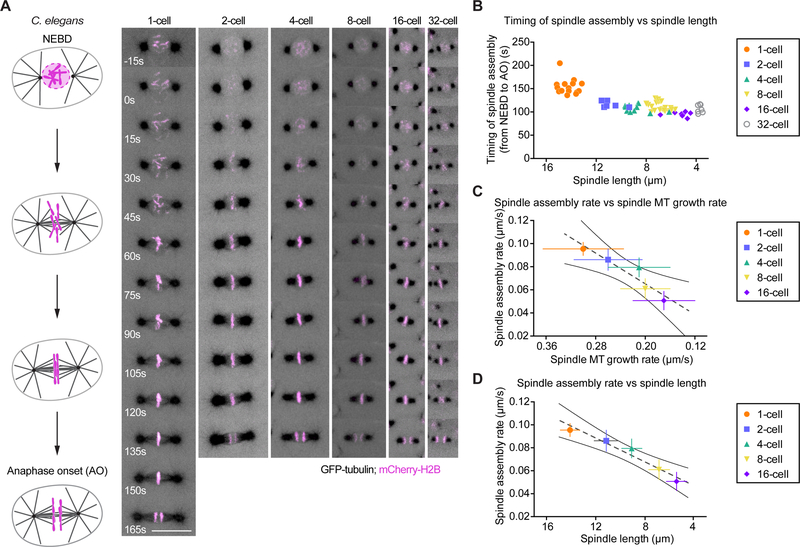
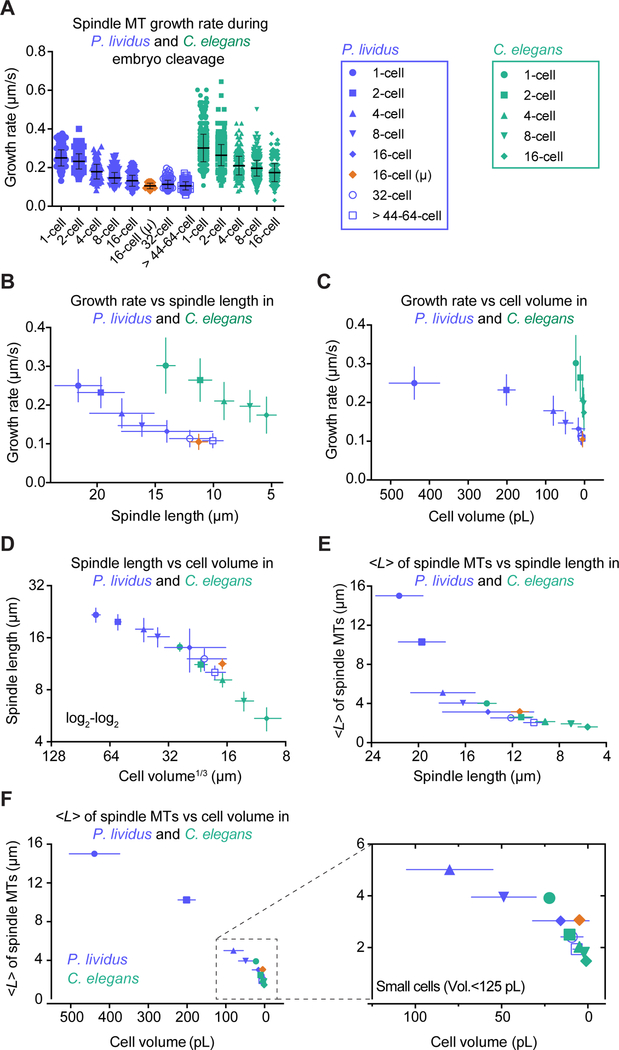
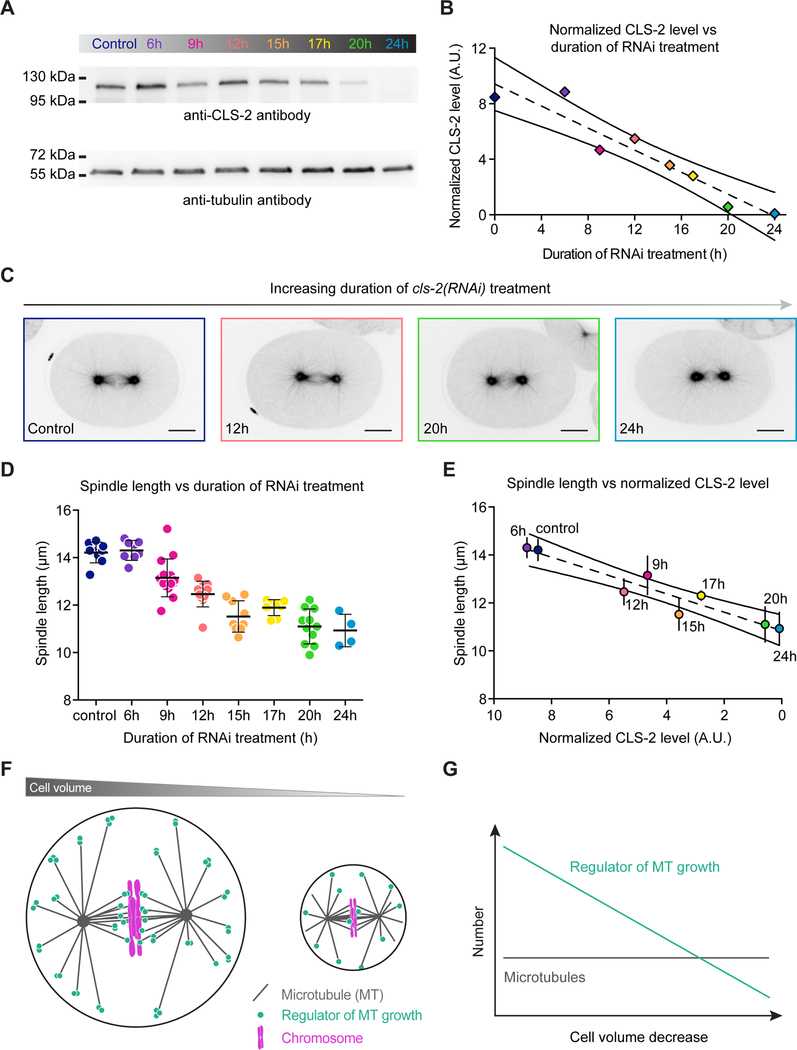
Successive cell divisions during embryonic cleavage create increasingly smaller cells, so intracellular structures must adapt accordingly. Mitotic spindle size correlates with cell size, but the mechanisms for this scaling remain unclear. Using live cell imaging, we analyzed spindle scaling during embryo cleavage in the nematode Caenorhabditis elegans and sea urchin Paracentrotus lividus. We reveal a common scaling mechanism, where the growth rate of spindle microtubules scales with cell volume, which explains spindle shortening. Spindle assembly timing is, however, constant throughout successive divisions. Analyses in silico suggest that controlling the microtubule growth rate is sufficient to scale spindle length and maintain a constant assembly timing. We tested our in silico predictions to demonstrate that modulating cell volume or microtubule growth rate in vivo induces a proportional spindle size change. Our results suggest that scalability of the microtubule growth rate when cell size varies adapts spindle length to cell volume.

Keywords: Caenorhabditis elegans; Paracentrotus lividus; cell division; embryonic development; in silico models; intracellular scaling; microtubule dynamics; microtubules; mitotic spindle; spindle assembly.


Conflict of interest statement

DECLARATION OF INTERESTS

The authors declare no competing interests.

Figures

Figure 1.
Figure 1.. Astral and Spindle Microtubule Dynamics Vary During C. elegans Embryo Cleavage.
(A) Still frames from confocal live imaging of C. elegans embryos expressing GFP-tagged β-tubulin during the first five embryonic divisions (1- to 16-cell stage). Images correspond to a single focal plane. Scale bar, 20 μm. (B) Schematic representation of parameter extraction for microtubule dynamics from individual astral (green) or spindle (red) microtubule kymographs. One representative example of a kymograph shown of an individual astral microtubule tracked over time. Horizontal scale bars, 1 μm, vertical scale bar (kymograph), 5 s. (C) Microtubule dynamics parameters for astral (green) and spindle (red) microtubules plotted at each cleavage stage (1- to 16-cell stage). Each dot corresponds to an individual microtubule. For both microtubule populations, each parameter significantly varies between stages (one-way ANOVA: p<0.01). Only microtubule growth rates of both microtubule populations exhibit significant and continuous decrease at each stage (one-way ANOVA with Tukey’s multiple comparison tests: p<0.01). All parameters including sample size, mean, and SD for the four astral and spindle microtubule dynamics parameters at the different stages are listed in Table S1. (Horizontal bars, mean; error bars, SD; n(microtubules)≥288 per cleavage stage; n (embryos)≥12). (D) Kymographs extracted from confocal live imaging of C. elegans embryos expressing GFP-tagged β-tubulin during the first embryonic division (one-cell stage) treated with DMSO (control, top) or with 20 μM of the proteasome inhibitor Clasto-Lactacystin β-Lactone (CLβL diluted in DMSO, bottom) to inhibit the metaphase-to-anaphase transition. Spindles poles (black arrowheads) are visible as two dark stripes that separate during anaphase in controls and stay at the same distance over time in CLβL-treated embryos. Timings relative to NEBD monitored by diffusion of free GFP-tagged β-tubulin in the nuclear area. Horizontal scale bar, 50s; Vertical scale bar, 5 μm.(E) Spindle length (aster-to-aster distance) plotted over time in DMSO (colors) and CLβL (grey) treated embryos at each cleavage stage (1- to 16-cell stage). Timings relative to NEBD. (n≥5 spindles per stage in each condition; error bars, SD).
Figure 2.
Figure 2.. Astral and Spindle Microtubule Dynamics Vary with Cell Volume During C. elegans Embryo Cleavage
(A) Still frames from live 2-photon imaging of C. elegans embryos expressing a GFP-tagged plasma membrane probe (Pleckstrin Homology (PH) domain) during the first five embryonic divisions (1- to 16-cell stage). Images correspond to maximal projections of z-stacks covering the entire thickness of the embryo. Scale bar, 20 μm. Blastomere names are indicated except for the 16-cell stage. At the 8-cell stage, progeny of AB and P1 were grouped together as ABxx and P1xx respectively. (B) Mean astral (green) and spindle (red) microtubule dynamics parameters: mean microtubule growth rate, catastrophe frequency, shrinkage rate and rescue frequency (from Figure 1C) for each type of blastomere plotted over the corresponding average cell volumes (from Figure S1). Key for different blastomeres shown in the top box. Dotted lines correspond to the linear regression curves. Pearson correlation coefficient (r2) is indicated at the top of each graph if p ≤ 0.01 (no corr. is indicated otherwise). (C) From left to right, still images from confocal live imaging of C. elegans control one-cell embryo, control 2-cell embryo, thermosensitive (ts) mutant embryo of the formin cyk-1 at the ‘2-cell’ stage after P0 cytokinesis failure and abnormally large C27D9.1(RNAi)-treated embryo. All express GFP-tagged β-tubulin. Corresponding schematics with color-coding for spindle microtubules in different conditions shown at the bottom. Scale bar, 20 μm. (D) Spindle microtubule growth rates measured at 25°C (restrictive temperature for the cyk-1(ts) mutant) for the indicated conditions. Color-coding for the different conditions corresponds to the schematics in (C). (Error bars, SD; one-way ANOVA with Dunnett’s multiple comparisons test, **: p≤0.01, n.s.: p>0.05).
Figure 3.
Figure 3.. Spindle Length Scales with Spindle, but not Astral, Microtubule Growth Rate
(A) From top to bottom (left to right), still images from confocal live imaging of C. elegans control one-cell embryo, abnormally large C27D9.1(RNAi)-treated embryo and cls-2(RNAi)-treated embryo. All expressing GFP-tagged β-tubulin. Corresponding schematics with color-coding for astral and spindle microtubules in the different conditions shown underneath each image. Scale bar, 20 μm. (B) Spindle length plotted over spindle microtubule dynamics parameters in the indicated cleavage stage or condition. Key for different stages and conditions indicated at the bottom of the graphs. (Control: red, C27D9.1(RNAi): orange, cls-2(RNAi): purple). Each dot represents the spindle length represented over mean microtubule dynamics parameters measured in an individual blastomere. (n(cells)≥10 with n(events/cell)≥60). Pearson correlation coefficient (r2) for the control condition indicated at the top of each graph if p≤0.01 (no corr. is indicated otherwise). (C) Same as (B) for astral microtubules. (Control: green, C27D9.1(RNAi): blue, cls-2(RNAi): magenta). (D) Average theoretical microtubule length <L> plotted over experimentally measured average spindle length in the indicated conditions (Control: red, C27D9.1(RNAi): orange, cls-2(RNAi): purple). <L>=Vg×VsVs×fc-Vg×fr with Vg: Growth rate, Vs: Shrinkage rate, fc: Catastrophe frequency, fr: Rescue frequency. Dotted red line and black lines represent the linear regression and 95% confidence interval respectively.
Figure 4.
Figure 4.. Spindle Length Scales with Cell Volume and Microtubule Growth Rate During Embryo Cleavage in the Sea Urchin P. lividus
(A) (Top)(Left) Schematic representations of early embryonic divisions of the sea urchin Paracentrotus lividus. Top views schematized for the 2- and 4-cell stages. All other schemes represent side views with the animal pole at the bottom. At the 16-cell stage, micromeres highlighted in orange. (Bottom)(Right) Still frames from confocal live imaging of P. lividus embryos microinjected with ATTO 565-labelled pig brain tubulin during the first six embryonic divisions (1- to >44–64-cell stage). Scale bar, 20 μm. (B) Microtubule dynamics parameters for spindle microtubules plotted at each cleavage stage (1- to >44–64-cell stage). Each dot corresponds to an individual microtubule. Microtubule growth rate significantly varies between stages (one-way ANOVA with Tukey’s multiple comparison tests: p<0.0001), except between the 16-cell micromeres, the 32-cell and the >44–64-cell macromeres (p>0.5 in all cases). However, the 16-cell micromeres and the 32-cell macromeres, as well as the 32-cell and the >44–64-cell macromeres differ significantly using a Student t-test (p=0.0004 and 0.0039 respectively), but the 16-cell micromeres do not when compared to the >44–64-cell macromeres (p=0.85). All parameters including sample size, mean and SD are listed in Table S2. (Horizontal bars, means; error bars, SD; n(cells/stage)≥5, n(microtubules/stage)≥55). (C) Mean growth rate for spindle microtubules plotted at each cleavage stage (1- to >44–64-cell stage) over the average corresponding cell volume. (Error bars, SD). (D) Mean spindle length plotted at each stage (1- to >44–64-cell stage) over the corresponding average spindle microtubule growth rate. Dotted blue line and black lines represent the linear regression and 95% confidence interval respectively. Pearson correlation coefficient (r2) is indicated at the top of the graph because p ≤ 0.01. (Error bars, SD).
Figure 5.
Figure 5.. Microtubule Growth Rate Scales Spindle Length in Computational 3D Spindle Models
(A) Spindle length scaling with microtubule growth rate and cell volume. Astral and spindle microtubules and a cell boundary are included in these simulations. Images correspond to steady state spindles obtained after running the simulations for 200 s. The input growth rate indicated at the bottom left of each image. Scale bar, 5 μm. (B) Simulated spindle length plotted over time at various microtubule growth rates. Color-coding of the growth rate indicated at the top, from magenta (0.39 μm/s) to red (0.17 μm/s). (C) Simulated steady state (200 s) spindle length plotted over the effective average spindle microtubule growth rate. Growth rate color-coded as in (B). Experimental data in grey. (D) Spindle length scaling with microtubule growth rate. Only spindle microtubules are included in these simulations. Images correspond to a spindle obtained with a microtubule growth rate of 0.31 μm/s at the beginning of the simulation (0 s, top) and after running the simulation for 100 s (middle) and 190 s (bottom). Scale bar, 5 μm. (E) Simulated spindle length plotted over time at various effective average spindle microtubule growth rates. Color-coding of growth rate indicated at the top, from magenta (0.42 μm/s) to red (0.15 μm/s). (F) Simulated steady state (200 s) spindle length plotted over spindle microtubule growth rate. Growth rate color-coded as in (E). Experimental data in grey.
Figure 6.
Figure 6.. Spindle Assembly Rate Scales with Spindle Microtubule Growth Rate During C. elegans Embryo Cleavage
(A) Left: Schematics of the spindle assembly process in the C. elegans embryo from NEBD (top) to anaphase onset (bottom). Right: Still frames from live confocal imaging of C. elegans embryos co-expressing mCherry-tagged Histone H2B (Magenta) and GFP-tagged β-tubulin (Grey) during spindle assembly in the first six embryonic divisions (1- to 32-cell stage from left to right). Timings are relative to NEBD. Images correspond to maximum projections of z-stacks. Scale bar, 10 μm. (B) Spindle assembly timing measured from the 1- to the 32-cell stage in C. elegans embryos and plotted over the corresponding spindle length at anaphase onset. Each dot corresponds to an individual spindle. (n≥9 per stage). (C) Mean spindle assembly rate (Spindle length/Spindle assembly timing) measured at each cleavage stage from the 1- to the 16-cell stage plotted over the corresponding average spindle microtubule growth rate. Dotted and solid grey lines represent the linear regression and 95% confidence interval respectively. (D) Mean spindle assembly rate (Spindle length/Spindle assembly timing) measured at each cleavage stage from the 1- to the 16-cell stage plotted over the corresponding average spindle length. Dotted and solid grey lines represent the linear regression and 95% confidence interval respectively.
Figure 7.
Figure 7.. Microtubules and Spindle Length Adaptation to Cell Volume in P. lividus and C. elegans Embryos
(A) Growth rate for spindle microtubules in P. lividus and C. elegans (same as Figure 1C and 4B) plotted at each cleavage stage (1- to >44–64-cell stage in P. lividus and 1- to 16-cell stage in C. elegans). Each dot corresponds to an individual microtubule. Color-coding and symbols shown in the righthand boxes. (Horizontal bars, means; error bars, SD; n(cells/stage)≥5, n(microtubules/stage)≥55) in P. lividus; n(cells/stage)≥12, n(microtubules/stage)≥288) in C. elegans. All parameters including sample size, mean and SD listed in Table S2. (B) Mean growth rate for spindle microtubules plotted at each cleavage stage over the corresponding average spindle length. (Bars, SD). (C) Mean growth rate for spindle microtubules plotted at each cleavage stage over the average corresponding cell volume. (Bars, SD). (D) Mean spindle length plotted over the cube root of the average cell volume on a log2-log2 scale. (Error bars, SD). (E) Average theoretical microtubule length <L> plotted over the experimentally measured spindle length. (Error bars, SD). (F) (Left) Average theoretical microtubule length <L> plotted over the average cell volume. (Right) Magnification of the graph for the smaller cells (volume<125 pL). (Error bars, SD).
Figure 8.
Figure 8.. A Limiting Component(s) Model for Microtubule Growth Rate and Spindle Length Scaling.
(A) (Top) Western blot using an anti-CLS-2 antibody (C2a14) on whole control worm extract or extracts treated with cls-2(RNAi) for increasing times (from 6 to 24h). Duration of the RNAi treatment is indicated above each lane. (Bottom) Western blot using an anti-α-tubulin antibody (DM1α) was used as a loading control. (B) Normalized CLS-2 level plotted over the corresponding duration of RNAi treatment. Dotted and solid black lines represent the linear regression and 95% confidence interval respectively. The color code corresponds to (A). (C) Still images of one-cell C. elegans embryos in metaphase expressing GFP-tagged β-tubulin after progressive depletion of the CLS-2 protein. The duration of the RNAi treatment is color-coded as in (A) and is indicated at the bottom right corner of each image. Scale bar, 10 μm. (D) Spindle length in one-cell C. elegans embryos in metaphase after progressive depletion of the CLS-2 protein plotted over the corresponding duration of RNAi-treatment. The color code corresponds to (A). (Error bars, SD). (E) Mean spindle length plotted over the corresponding level of CLS-2 protein. Dotted and solid black lines represent the linear regression and 95% confidence interval respectively. (Error bars, SD). (F) A limiting component model explains microtubule growth rate and spindle length scaling with respect to cell volume (Decker et al., 2011; Goehring and Hyman, 2012; Good et al., 2013; Hazel et al., 2013; Mitchison et al., 2015; Schmoller and Skotheim, 2015). In this model, one or several positive regulators of spindle microtubule growth (such as CLS-2) bind to microtubule (+)-ends. The microtubule growth rate depends on the number of (+)-end-bound regulators. Across successive divisions, the concentration of regulators remains constant but the absolute number of regulator molecules decreases with cell volume. If in parallel, the number of spindle microtubules remains constant or decreases in a sub-proportional manner across divisions, the number of regulators becomes progressively limiting relative to the number of microtubule (+)-ends. The limited number of regulators in turn restricts spindle microtubule growth rate. (G) Schematic evolution of spindle microtubule and regulator number as cell size decreases. As cells get smaller, microtubules are shorter but their number remains constant (or decreases slower than the number of regulators). In contrast, the absolute number of regulator molecules is directly proportional to cell volume. If the regulator stimulates microtubule growth (such as CLS-2), microtubule growth rate will progressively decrease as cell volume decreases across successive divisions.

Comment in

  • The Incredible Shrinking Spindle.
    Brownlee C, Heald R. Brownlee C, et al. Dev Cell. 2018 May 21;45(4):421-423. doi: 10.1016/j.devcel.2018.05.007. Dev Cell. 2018. PMID: 29787705

References

    1. Agrell I (1956). A mitotic gradient as the cause of the early differentiation in the sea urchin embryo. Zoological Papers in Honour of B Hanstrom, pp. 27–34.
    1. Andersen SS (2000). Spindle assembly and the art of regulating microtubule dynamics by MAPs and Stathmin/Op18. Trends Cell Biol 10, 261–267. - PubMed
    1. Andersen SS, Ashford AJ, Tournebize R, Gavet O, Sobel A, Hyman AA, and Karsenti E (1997). Mitotic chromatin regulates phosphorylation of Stathmin/Op18. Nature 389, 640–643. - PubMed
    1. Angerer LM, and Angerer RC (2000). Animal-vegetal axis patterning mechanisms in the early sea urchin embryo. Dev Biol 218, 1–12. - PubMed
    1. Belmont LD, Hyman AA, Sawin KE, and Mitchison TJ (1990). Real-time visualization of cell cycle-dependent changes in microtubule dynamics in cytoplasmic extracts. Cell 62, 579–589. - PubMed

Publication types

MeSH terms

Substances