

Evidence that divergent selection shapes a developmental cline in a forest tree species complex
- PMID: 29788049
- PMCID: PMC6025196
- DOI: 10.1093/aob/mcy064
Evidence that divergent selection shapes a developmental cline in a forest tree species complex
Abstract
Background and aims: Evolutionary change in developmental trajectories (heterochrony) is a major mechanism of adaptation in plants and animals. However, there are few detailed studies of the variation in the timing of developmental events among wild populations. We here aimed to identify the climatic drivers and measure selection shaping a genetic-based developmental cline among populations of an endemic tree species complex on the island of Tasmania.
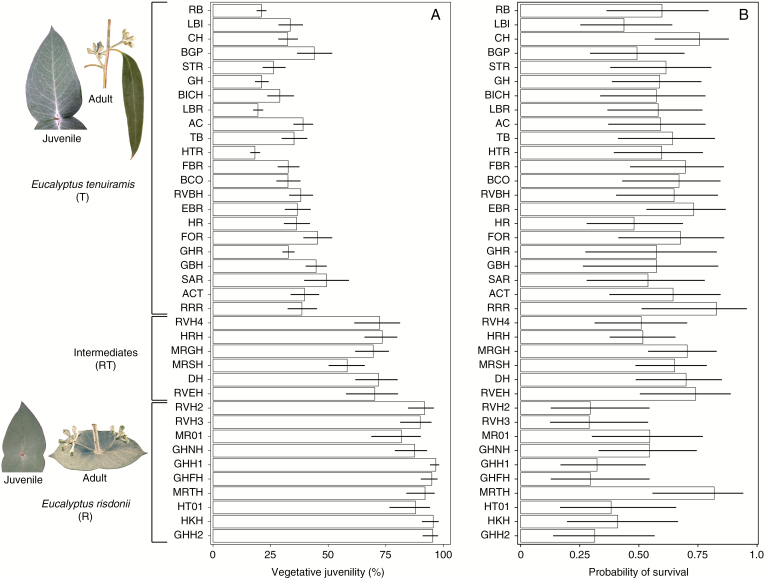
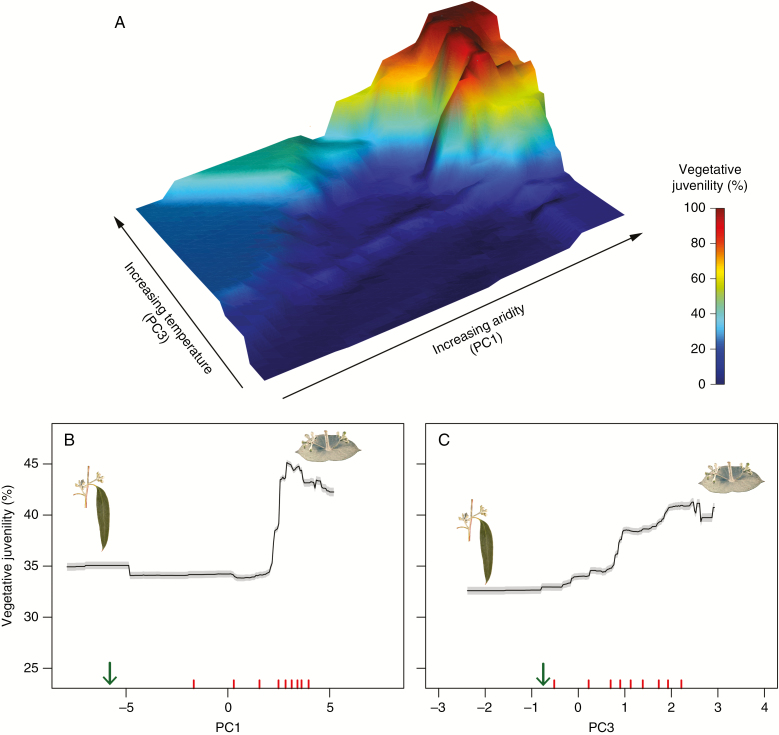
Methods: Seed lots from 38 native provenances encompassing the clinal transition from the heteroblastic Eucalyptus tenuiramis to the homoblastic Eucalyptus risdonii were grown in a common-garden field trial in southern Tasmania for 20 years. We used 27 climatic variables to model the provenance variation in vegetative juvenility as assessed at age 5 years. A phenotypic selection analysis was used to measure the fitness consequences of variation in vegetative juvenility based on its impact on the survival and reproductive capacity of survivors at age 20 years.
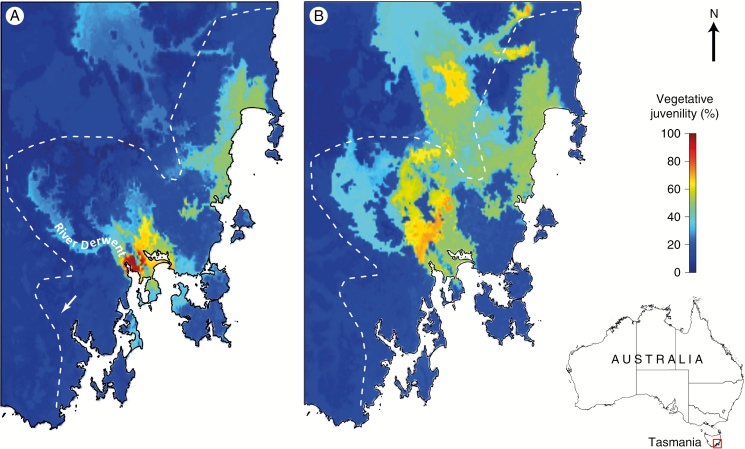
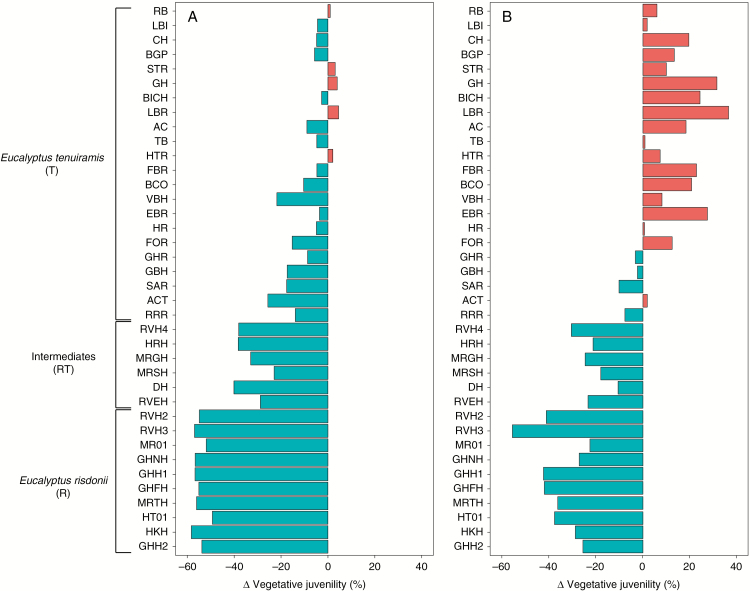
Key results: Significant provenance divergence in vegetative juvenility was shown to be associated with home-site aridity, with the retention of juvenile foliage increasing with increasing aridity. Our results indicated that climate change may lead to different directions of selection across the geographic range of the complex, and in our mesic field site demonstrated that total directional selection within phenotypically variable provenances was in favour of reduced vegetative juvenility.
Conclusions: We provide evidence that heteroblasty is adaptive and argue that, in assessing the impacts of rapid global change, developmental plasticity and heterochrony are underappreciated processes which can contribute to populations of long-lived organisms, such as trees, persisting and ultimately adapting to environmental change.
Figures
Similar articles
-
A climate change context for the decline of a foundation tree species in south-western Australia: insights from phylogeography and species distribution modelling.Ann Bot. 2015 Nov;116(6):941-52. doi: 10.1093/aob/mcv044. Epub 2015 Apr 7. Ann Bot. 2015. PMID: 25851142 Free PMC article.
-
Plasticity of functional traits varies clinally along a rainfall gradient in Eucalyptus tricarpa.Plant Cell Environ. 2014 Jun;37(6):1440-51. doi: 10.1111/pce.12251. Epub 2014 Jan 13. Plant Cell Environ. 2014. PMID: 24329726
-
Genetic control of heterochrony in Eucalyptus globulus.G3 (Bethesda). 2014 May 8;4(7):1235-45. doi: 10.1534/g3.114.011916. G3 (Bethesda). 2014. PMID: 24950963 Free PMC article.
-
Long-distance gene flow and adaptation of forest trees to rapid climate change.Ecol Lett. 2012 Apr;15(4):378-92. doi: 10.1111/j.1461-0248.2012.01746.x. Epub 2012 Feb 28. Ecol Lett. 2012. PMID: 22372546 Free PMC article. Review.
-
The ecology of predispersal insect herbivory on tree reproductive structures in natural forest ecosystems.Insect Sci. 2019 Apr;26(2):182-198. doi: 10.1111/1744-7917.12549. Epub 2017 Dec 27. Insect Sci. 2019. PMID: 29082661 Review.
Cited by
-
Expansion of the rare Eucalyptus risdonii under climate change through hybridization with a closely related species despite hybrid inferiority.Ann Bot. 2022 Jan 8;129(1):1-14. doi: 10.1093/aob/mcab103. Ann Bot. 2022. PMID: 34351372 Free PMC article.
-
Leaf Economic and Hydraulic Traits Signal Disparate Climate Adaptation Patterns in Two Co-Occurring Woodland Eucalypts.Plants (Basel). 2022 Jul 14;11(14):1846. doi: 10.3390/plants11141846. Plants (Basel). 2022. PMID: 35890479 Free PMC article.
-
Mammalian Browsers Disrupt Eco-Evolutionary Dynamics in a Forest Tree Restoration Planting.Evol Appl. 2025 May 7;18(5):e70099. doi: 10.1111/eva.70099. eCollection 2025 May. Evol Appl. 2025. PMID: 40343225 Free PMC article.
-
Linking leaf economic and hydraulic traits with early-age growth performance and survival of Eucalyptus pauciflora.Front Plant Sci. 2022 Nov 8;13:973087. doi: 10.3389/fpls.2022.973087. eCollection 2022. Front Plant Sci. 2022. PMID: 36426150 Free PMC article.
References
-
- Armbruster WS, Schwaegerle KE. 1996. Causes of covariation of phenotypic traits among populations. Journal of Evolutionary Biology 9: 261–276.
-
- Arnold SJ, Wade MJ. 1984. On the measurement of natural and sexual selection: applications. Evolution 38: 720–734. - PubMed
-
- Balmelli G, Simeto S, Torres D, Castillo A, Altier N, Diez JJ. 2014. Susceptibility to Teratosphaeria nubilosa and precocity of vegetative phase change in Eucalyptus globulus and E. maidenii (Myrtaceae). Australian Journal of Botany 61: 583–591.
-
- Billingsley P. 1986. Probability and measure. New York: John Wiley & Sons, Inc.
Publication types
MeSH terms
LinkOut - more resources
Full Text Sources
Other Literature Sources
