. 2018 Aug 1;41(8):zsy100.
doi: 10.1093/sleep/zsy100.

Exploiting metamerism to regulate the impact of a visual display on alertness and melatonin suppression independent of visual appearance

Affiliations

Exploiting metamerism to regulate the impact of a visual display on alertness and melatonin suppression independent of visual appearance

Annette E Allen et al. Sleep. .

Abstract

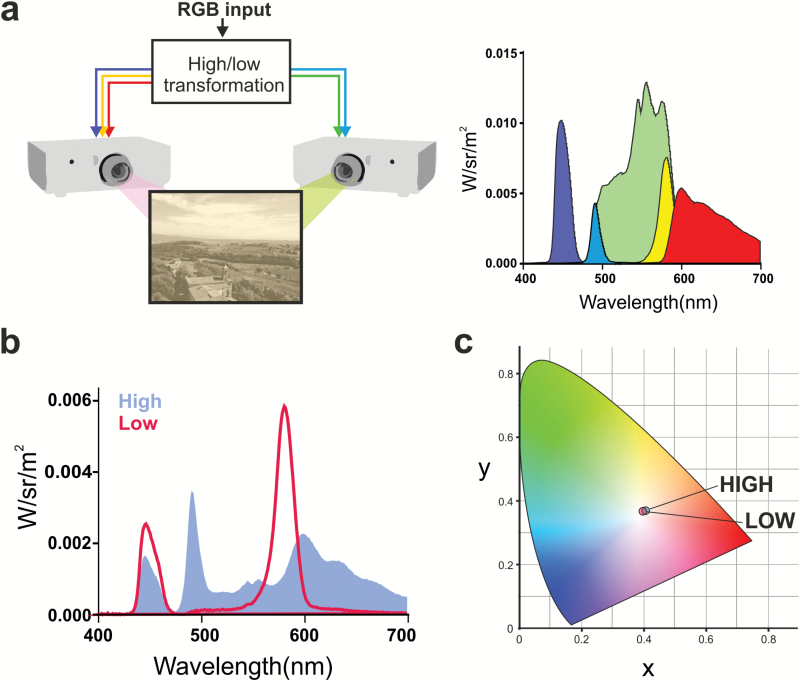
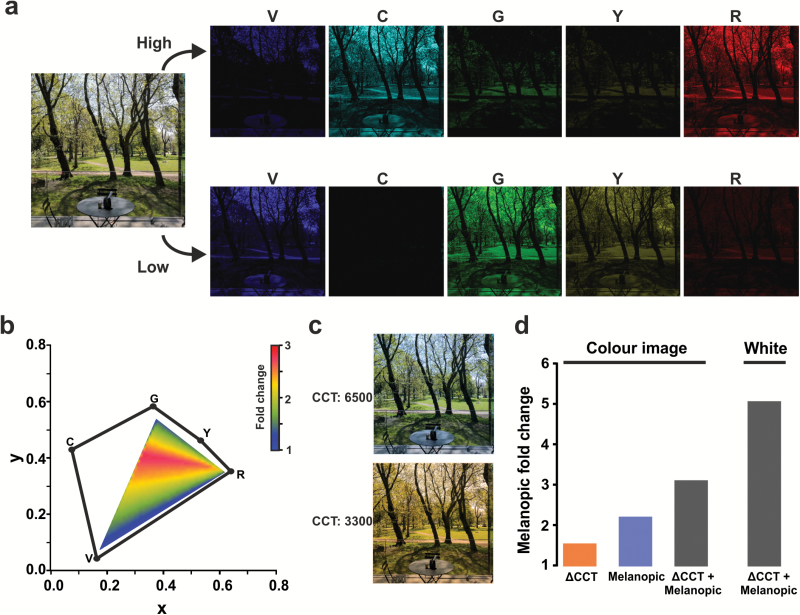
Objectives: Artificial light sources such as visual display units (VDUs) elicit a range of subconscious and reflex light responses, including increases in alertness and suppression of pineal melatonin. Such responses employ dedicated retinal circuits encompassing melanopsin photoreceptors. Here, we aimed to determine whether this arrangement can be exploited to modulate the impact of VDUs on melatonin onset and alertness without altering visual appearance.

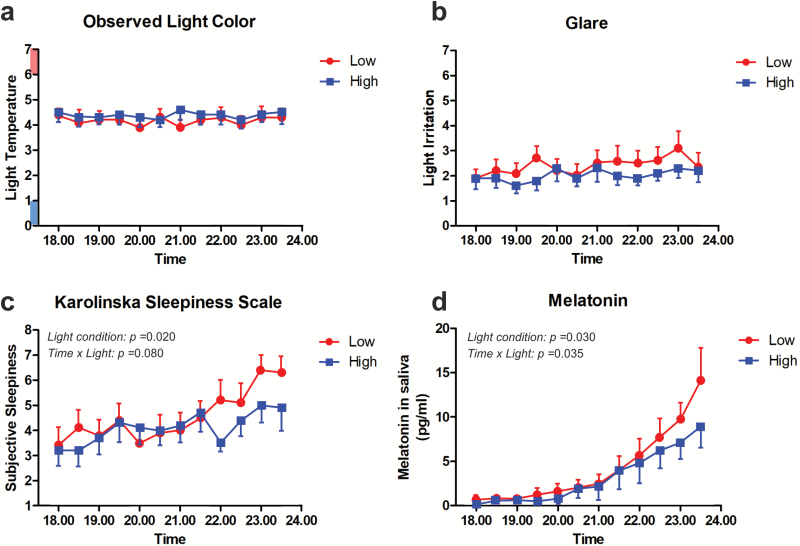
Methods: We generated a five-primary VDU capable of presenting metameric movies (matched for color and luminance) but varying in melanopic-irradiance. Healthy human participants (n = 11) were exposed to the VDU from 18:00 to 23:00 hours at high- or low-melanopic setting in a randomized cross-over design and measured salivary melatonin and self-reported sleepiness at 30-minute intervals.

Results: Our VDU presented a 3× adjustment in melanopic-irradiance for images matched photometrically for color and luminance. Participants reported no significant difference in visual appearance (color and glare) between conditions. During the time in which the VDU was viewed, self-reported sleepiness and salivary melatonin levels increased significantly, as would be expected in this phase of the diurnal cycle. The magnitude of the increase in both parameters was significantly enhanced when melanopic-irradiance was reduced.

Conclusions: Our data demonstrate that melatonin onset and self-reported sleepiness can be modulated independent of photometric parameters (color and luminance) under a commonly encountered light exposure scenario (evening use of a VDU). They provide the first demonstration that the impact of light on alertness and melatonin production can be controlled independently of visual experience, and establish a VDU capable of achieving this objective.


Figures

Figure 1.
Figure 1.
Using a five-primary display to generate images varying in melanopic and irradiance. A melanopic display was produced by superimposing images from two projectors (shown in schematic, a; left hand panel) fitted with interference filters to modulate their spectral output in such a way as to produce a total of five independently controllable spectrally distinct output channels (primaries) across the two projectors (shown as blue, cyan, green, yellow, and red spectral power distributions in right hand panel of a). The five primaries were combined to produce high- and low-melanopic settings (blue and red spectral power distributions respectively in b), which were calculated to differ in melanopic irradiance (77.7 vs. 24.7 melanopic lux). High- and low-melanopic stimuli also differed in rhodopic irradiance (71.8 vs. 34.8 rhodopic lux). High- and low-melanopic settings were matched for color (CIE xy coordinates for both high- and low-melanopic = 0.40 and 0.36; shown in CIE 10-degree xy color space against approximate palate in c) and luminance (79 cd/m2).
Figure 2.
Figure 2.
Modifying melanopic irradiance alters sleepiness and melatonin production without impacting visual appearance. Time course of self-reported ratings of observed color temperature (a; lower ratings correspond to “bluer” and higher ratings more “orange” appearance), glare (b; higher ratings correspond to more discomfort), and sleepiness (c; Karolinska Sleepiness Scale, higher ratings correspond to more sleepy) and of salivary melatonin (d) levels as a function of clock time across the study period under low-melanopic (red) and high-melanopic (blue) conditions. Data were collected at half-hourly intervals and are depicted as mean ± SEM (n = 11).
Figure 3.
Figure 3.
Application of the melanopic display to present a color image. (a) At left is a color image and to the right the five individual color planes that combine to render it in low- (top) and high-melanopic (bottom) radiance using the melanopic display in Figure 1. The color of each pixel is determined by its relative intensity at each color plane. Although melanopic radiance varies from pixel to pixel according to its color and intensity, there is an overall 2.5× difference in melanopic-irradiance between low- and high-melanopic images. The spectral power distribution of individual color planes determines the available gamut and the difference in melanopic-irradiance achievable between low- and high-melanopic settings. (b) An xy color space with the location of the five primaries (violet, cyan, green, yellow and red; VCGYR) in the melanopic display shown in black. The area encompassed by the pentagon comprises the available gamut for this display, and the triangle in the center is the RGB gamut of the unmodified projector. The fold-difference in melanopic radiance between high- and low-melanopic metamers (high melanopic/low melanopic) available with the display described in Figure 1 across the RGB gamut is depicted as a heat map (scale bar to side). Optimization of the color planes to maximize melanopic contrast could lead to increases in these values across the color gamut. (c) Adjustments in correlated color temperature (CCT; “screen yellowing”) are widely used in the hope of adjusting the impact of RGB displays on reflex light responses. The effect on appearance of a natural scene of a typical adjustment from CCT of 6500 to 3300 is shown (e.g. as used by f.lux; https://justgetflux.com/). (d) Bar graph plotting the fold change in melanopic excitation of the color image shown in (c) after: changing CCT; using the melanopic display at high- vs. low-melanopic settings (retaining color and luminance); and combining the melanopic display with a change in CCT. Also shown is the resultant change in melanopic excitation for white (xy coordinate 0.33, 0.33) when combining the two approaches.

References

    1. Lucas RJ, et al. Measuring and using light in the melanopsin age. Trends Neurosci. 2014;37(1):1–9. - PMC - PubMed
    1. Chang AM, et al. Evening use of light-emitting eReaders negatively affects sleep, circadian timing, and next-morning alertness. Proc Natl Acad Sci U S A. 2015;112(4):1232–1237. - PMC - PubMed
    1. Hatori M, et al. Global rise of potential health hazards caused by blue light-induced circadian disruption in modern aging societies. NPJ Aging Mech Dis. 2017;3:9. - PMC - PubMed
    1. Czeisler CA. Perspective: casting light on sleep deficiency. Nature. 2013;497(7450):S13. - PubMed
    1. Touitou Y, et al. Association between light at night, melatonin secretion, sleep deprivation, and the internal clock: health impacts and mechanisms of circadian disruption. Life Sci. 2017;173:94–106. - PubMed

Publication types