Clinical Trial
. 2018 Oct 1;110(10):1123-1132.
doi: 10.1093/jnci/djy033.

Constitutive Interferon Pathway Activation in Tumors as an Efficacy Determinant Following Oncolytic Virotherapy

Affiliations
Clinical Trial

Constitutive Interferon Pathway Activation in Tumors as an Efficacy Determinant Following Oncolytic Virotherapy

Cheyne Kurokawa et al. J Natl Cancer Inst. .

Abstract

Background: Attenuated measles virus (MV) strains are promising agents currently being tested against solid tumors or hematologic malignancies in ongoing phase I and II clinical trials; factors determining oncolytic virotherapy success remain poorly understood, however.

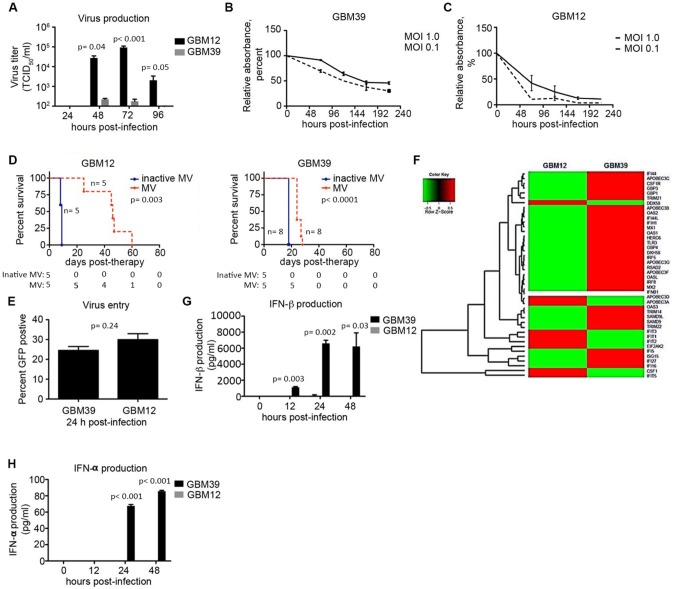
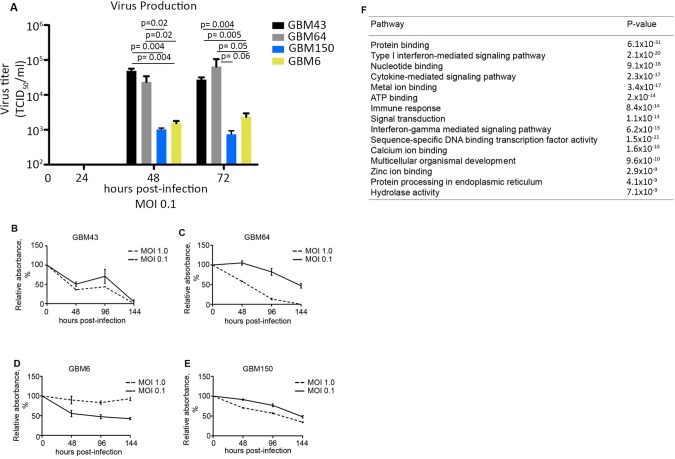
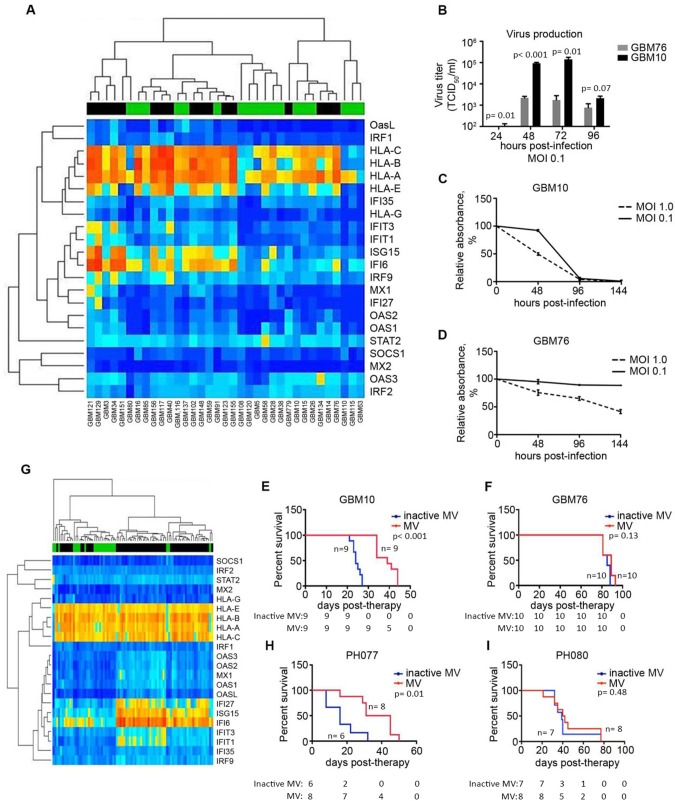
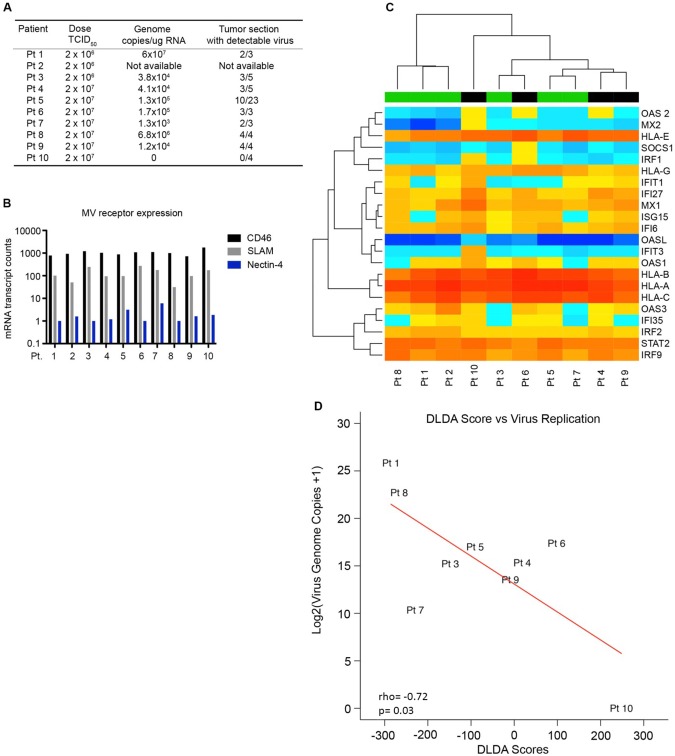
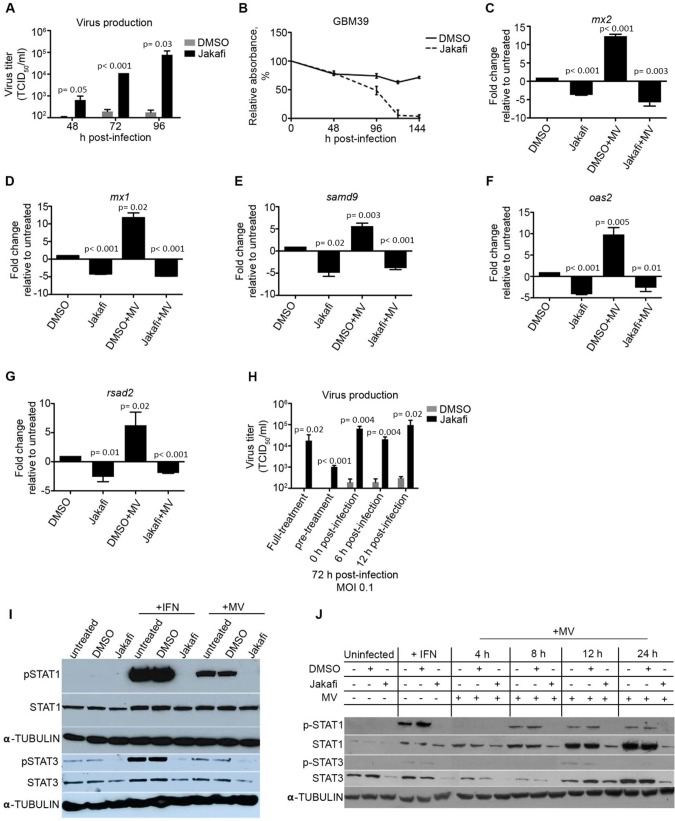
Methods: We performed RNA sequencing and gene set enrichment analysis to identify pathways differentially activated in MV-resistant (n = 3) and -permissive (n = 2) tumors derived from resected human glioblastoma (GBM) specimens and propagated as xenografts (PDX). Using a unique gene signature we identified, we generated a diagonal linear discriminant analysis (DLDA) classification algorithm to predict MV responders and nonresponders, which was validated in additional randomly selected GBM and ovarian cancer PDX and 10 GBM patients treated with MV in a phase I trial. GBM PDX lines were also treated with the US Food and Drug Administration-approved JAK inhibitor, ruxolitinib, for 48 hours prior to MV infection and virus production, STAT1/3 signaling and interferon stimulated gene expression was assessed. All statistical tests were two-sided.

Results: Constitutive interferon pathway activation, as reflected in the DLDA algorithm, was identified as the key determinant for MV replication, independent of virus receptor expression, in MV-permissive and -resistant GBM PDXs. Using these lines as the training data for the DLDA algorithm, we confirmed the accuracy of our algorithm in predicting MV response in randomly selected GBM PDX ovarian cancer PDXs. Using the DLDA prediction algorithm, we demonstrate that virus replication in patient tumors is inversely correlated with expression of this resistance gene signature (ρ = -0.717, P = .03). In vitro inhibition of the interferon response pathway with the JAK inhibitor ruxolitinib was able to overcome resistance and increase virus production (1000-fold, P = .03) in GBM PDX lines.

Conclusions: These findings document a key mechanism of tumor resistance to oncolytic MV therapy and describe for the first time the development of a prediction algorithm to preselect for oncolytic treatment or combinatorial strategies.


Figures

Figure 1.
Figure 1.
Constitutive expression of interferon-stimulated genes measured in measles virus (MV)–resistant glioblastoma (GBM) cells. A) GBM12 and GBM39 cells were infected with MV-NIS (multiplicity of infection [MOI] = 0.1) and virus production measured at 24–96 hours (n = 3). B and C) GBM12 and GBM39 cells were infected with MV-NIS (MOI = 1.0 and 0.1), and cell viability was assessed by MTT assay (n = 3). D) Athymic nude mice were implanted orthotopically with GBM12 or GBM39 cells and received MV therapy (1 × 105 TCID50/mL) once every three days for a total of three or five doses, respectively. E) GBM12 and GBM39 cells were infected with MV-GFP at an MOI of 1.0, and virus entry efficiency was measured by GFP-positive cells assessed by flow cytometry at 24 hours postinfection (n = 2). F) RNA was extracted from uninfected GBM12 and GBM39 cells, and gene expression was analyzed by RNA-Seq. A heat map illustrates the expression of several antiviral interferon-stimulated genes overexpressed in GBM39 cells relative to GBM12. G and H) GBM39 and GBM12 cells were untreated or infected with MV-NIS (MOI = 5), and supernatant was harvested at 12, 24, and 48 hours postinfection (n = 2). IFN-α and IFN-β concentrations were measured by enzyme-linked immunosorbent assay. In vitro experiments were repeated two or more times. A two-sided Student t test was used to determine statistically significant differences. Kaplan-Meier survival curves and log-rank tests were used to obtain median survival times and compare survival between animal groups. Data are presented as the mean and standard deviation (A–C, E, G, and H). GBM = glioblastoma; MOI = multiplicity of infection; MV = measles virus.
Figure 2.
Figure 2.
Gene-set enrichment analysis (GSEA) identifies important interferon-stimulated genes differentially expressed between measles virus (MV)–resistant and permissive glioblastoma (GBM) lines. A) Additional primary GBM lines were infected with MV at a multiplicity of infection (MOI) of 0.1, and virus production was measured by titration on Vero cells 24–72 hours postinfection. B–E) Cell viability was measured by MTT assay in GBM64 and GBM43 cells following infection with MV-NIS (MOI = 1.0 and 0.1; n = 3). F) Gene expression for GBM64, GBM43, GBM150, and GBM6 cells was measured by RNA-Seq. Cells were grouped according to their response to MV. The resistant group consists of GBM39, GBM6, and GBM150, while the permissive group consists of GBM43 and GBM64. GSEA was performed on the MV-resistant and -permissive groups to identify pathways differentially activated between the two groups (expression of 19 835 genes was included in the analysis). The top 15 pathways overrepresented in the resistant group are listed; 2.14 × 10-20). In vitro experiments were repeated two or more times. A two-sided Student t test was used to determine statistically significant differences. Data are presented as the mean and SD (A–E). GBM = glioblastoma; MOI = multiplicity of infection.
Figure 3.
Figure 3.
Application of the diagonal linear discriminant analysis (DLDA) algorithm in primary glioblastoma (GBM) and ovarian cancer (OvCa) xenografts. A) Expression of the 22-gene signature was analyzed and illustrated in a heat map consisting of 35 primary GBM lines (predicted responders and nonresponders are indicated by a green or black bar, respectively). B) Representative lines classified as permissive (GBM10) or resistant (GBM76), based on the DLDA analysis, were infected with MV-NIS (multiplicity of infection [MOI] = 0.1), and virus production was measured by titration on Vero cells 24–96 hours postinfection (n = 3). C and D) GBM10 and GBM76 cells were infected with MV-NIS (MOI = 1.0 and 0.1), and cell viability was measured by MTT assay (n = 3). E and F) Athymic nude mice were implanted orthotopically with either GBM10 or GBM76 cells. Mice were treated with MV-NIS (1 × 105 TCID50/mL) once every three days for a total of three (GBM10) or five (GBM76) doses. G) The DLDA scoring algorithm was applied in gene expression data obtained from primary patient-derived OvCa tumors passaged in mice. H) Low interferon-stimulated gene (ISG)–expressing OvCa line, PH077, and (I) a high-ISG expressing line, PH080, were implanted intraperitoneally in SCID beige mice. In vitro experiments were repeated two or more times. A two-sided Student t test was used to determine statistically significant differences. Kaplan-Meier survival curves and log-rank tests were used to obtain median survival times and compare survival between animal groups. Data are presented as the mean and SD (B–D). GBM = glioblastoma; MOI = multiplicity of infection; MV = measles virus.
Figure 4.
Figure 4.
Expression of the interferon gene signature in MV-treated GBM patients. A) GBM patients were treated with MV-CEA (2 × 106 patients 1–3 or 2 × 107 TCID50 for patients 4–10) on day 0, and tumors were resected on day 5. RNA was extracted from multiple regions of the treated tumors, and virus replication was assessed by quantitative real-time polymerase chain reaction for viral genome copies. B) RNA was extracted from the primary tumors of GBM patients scheduled to receive MV therapy in an ongoing phase I trial. Gene expression was assessed by Nanostring analysis using a custom gene panel that assessed the interferon-stimulated gene (ISG) profile and virus entry receptor expression. C) Expression of the 22 ISG panel is depicted in the heat map. The diagonal linear discriminant analysis (DLDA) scoring system was applied to the patients, and classification was assigned to each individual patient (black bar = resistant, green bar = permissive). D) DLDA scores calculated for each patient were assessed for correlation to virus replication measured from the treated tumors. Pearson coefficients were utilized to evaluate the correlation between virus replication and DLDA scores. DLDA = diagonal linear discriminant analysis; MV = measles virus.
Figure 5.
Figure 5.
Inhibition of JAK/STAT signaling in MV resistant primary GBM lines. A) Resistant glioblastoma (GBM) 39 cells were treated with the JAK1 inhibitor Ruxolitinib (Jakafi; 3 µM) or DMSO for 48 hours prior to infection. Treated cells were infected with MV-NIS (multiplicity of infection [MOI] = 0.1), and virus production was measured at 48, 72, and 96 hours postinfection (n = 3). B) MV-mediated cell killing was assessed in GBM39 cells pretreated with Jakafi (3 µM) or DMSO control by MTT assay (n = 3). C–G) RNA was extracted from GBM39 cells under the indicated conditions, and interferon-stimulated gene (ISG) expression was assessed by quantitative real-time polymerase chain reaction (n = 2, run in technical triplicates). Pretreatment with Jakafi decreased baseline ISG expression, as well as ISG induction upon MV infection. H) Protein was extracted from GBM39 cells and (I) GBM12 cells under the indicated conditions, and p-STAT1/3 activation was measured by immunoblot. J) Jakafi (3 µM) was added at different points during the course of infection (MOI = 0.1), and virus production was assessed at 48 hours postinfection (n = 3). In vitro experiments were repeated two or more times. A two-sided Student t test was used to determine statistically significant differences. Data are presented as the mean +/- SD (A–H). MV = measles virus.

Comment in

References

    1. Russell SJ, Federspiel MJ, Peng KW, et al. Remission of disseminated cancer after systemic oncolytic virotherapy. Mayo Clinic Proc. 2014;897:926–933. - PMC - PubMed
    1. Andtbacka RH, Kaufman HL, Collichio F, et al. Talimogene laherparepvec improves durable response rate in patients with advanced melanoma. J Clin Oncol. 2015;3325:2780–2788. - PubMed
    1. Galanis E, Atheron PJ, Maurer MJ, et al. Oncolytic measles virus expressing the sodium iodide symporter to treat drug-resistant ovarian cancer. Cancer Res. 2015;751:22–30. - PMC - PubMed
    1. Muhlebach MD, Mateo M, Sinn PL, et al. Adherens junction protein nectin-4 is the epithelial receptor for measles virus. Nature. 2011;4807378:530–533. - PMC - PubMed
    1. Dorig RE, Marcil A, Chopra A, et al. The human Cd46 molecule is a receptor for measles-virus (Edmonston strain). Cell. 1993;752:295–305. - PubMed

Publication types