. 2018 Jul 18;69(16):4065-4082.
doi: 10.1093/jxb/ery190.

Hormonal regulation in adventitious roots and during their emergence under waterlogged conditions in wheat

Affiliations

Hormonal regulation in adventitious roots and during their emergence under waterlogged conditions in wheat

Tran-Nguyen Nguyen et al. J Exp Bot. .

Abstract

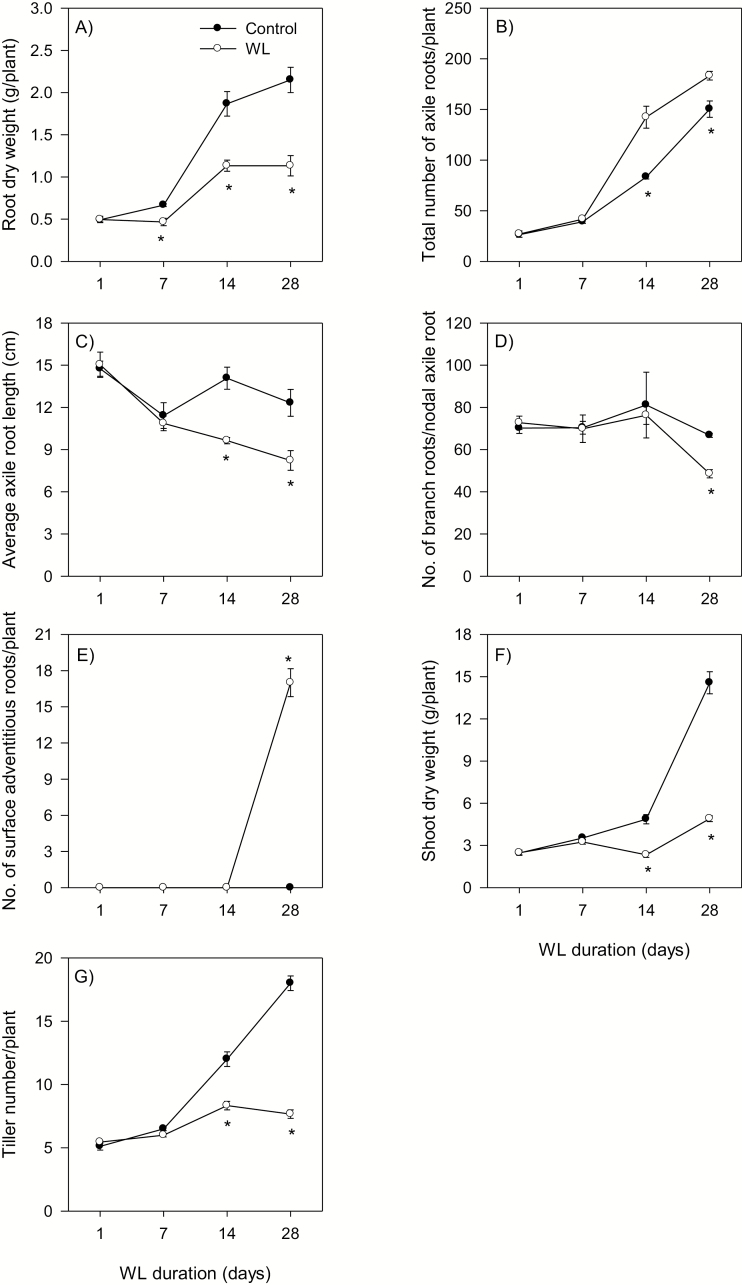
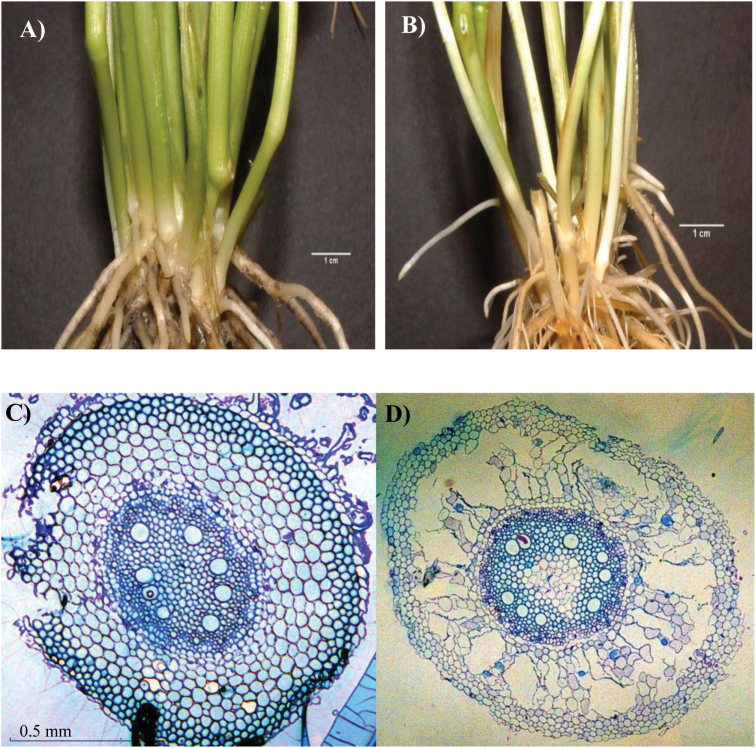
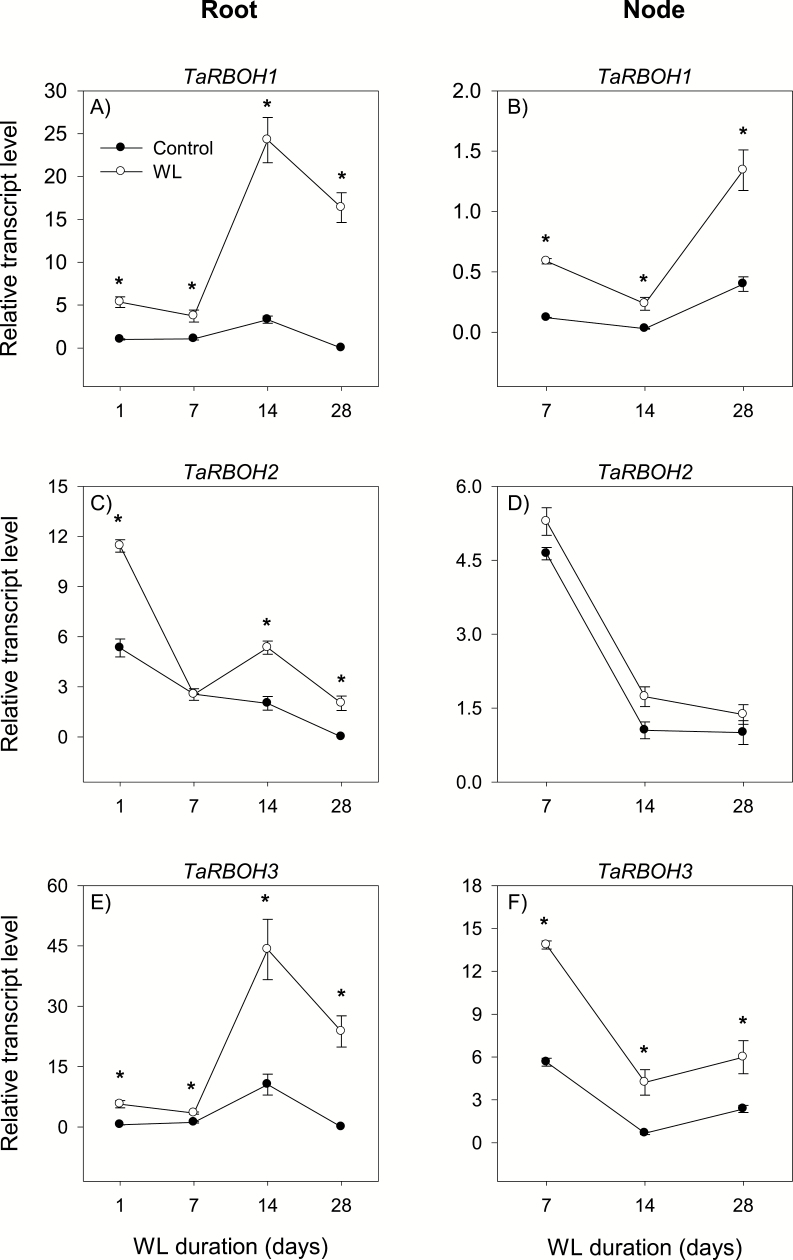
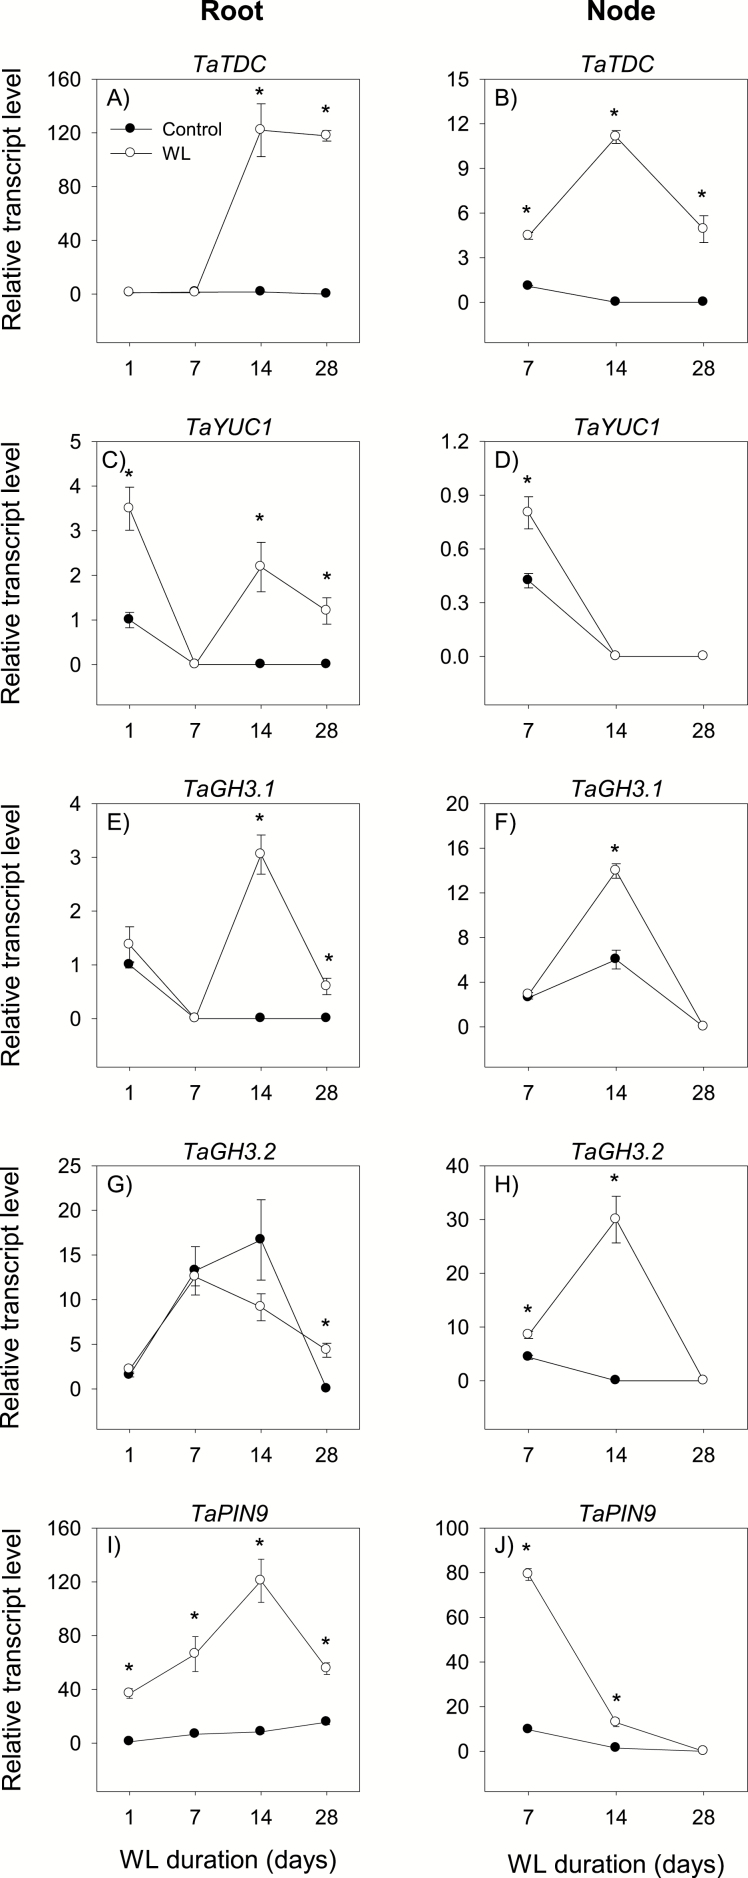
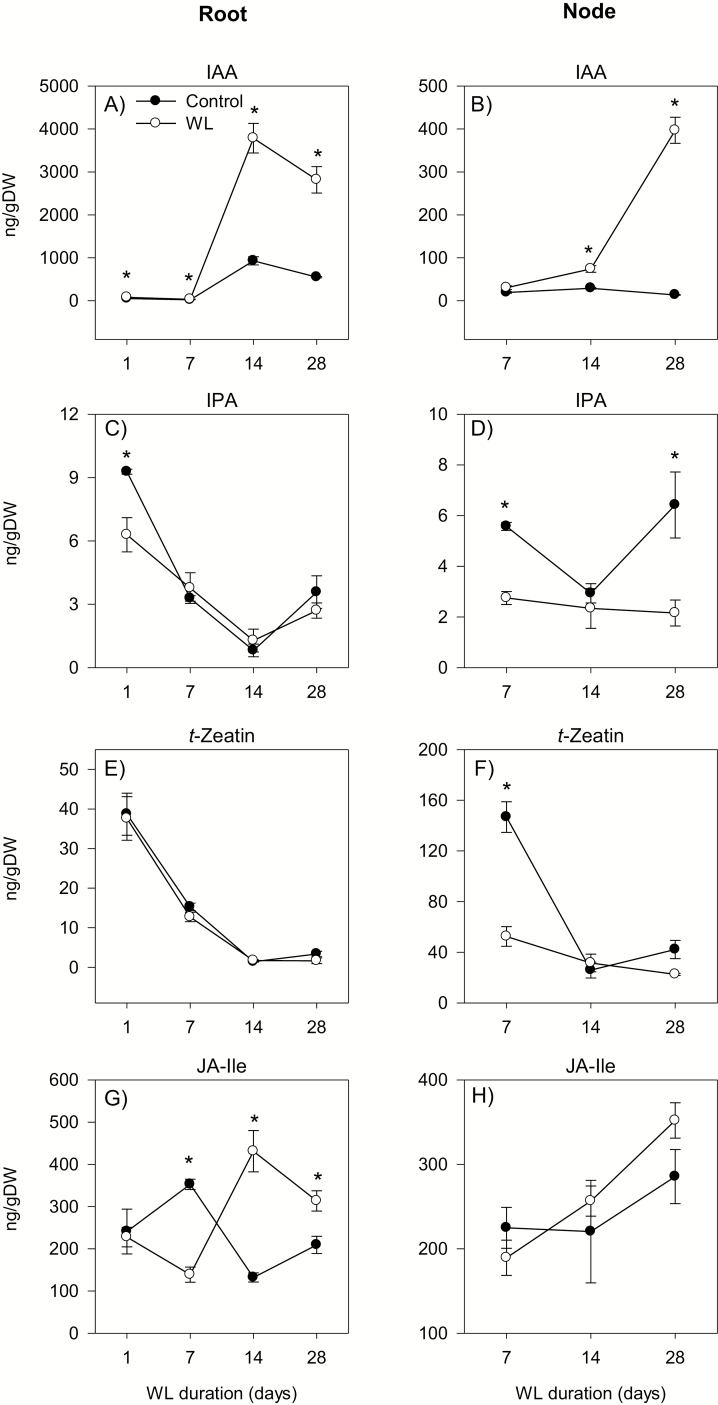
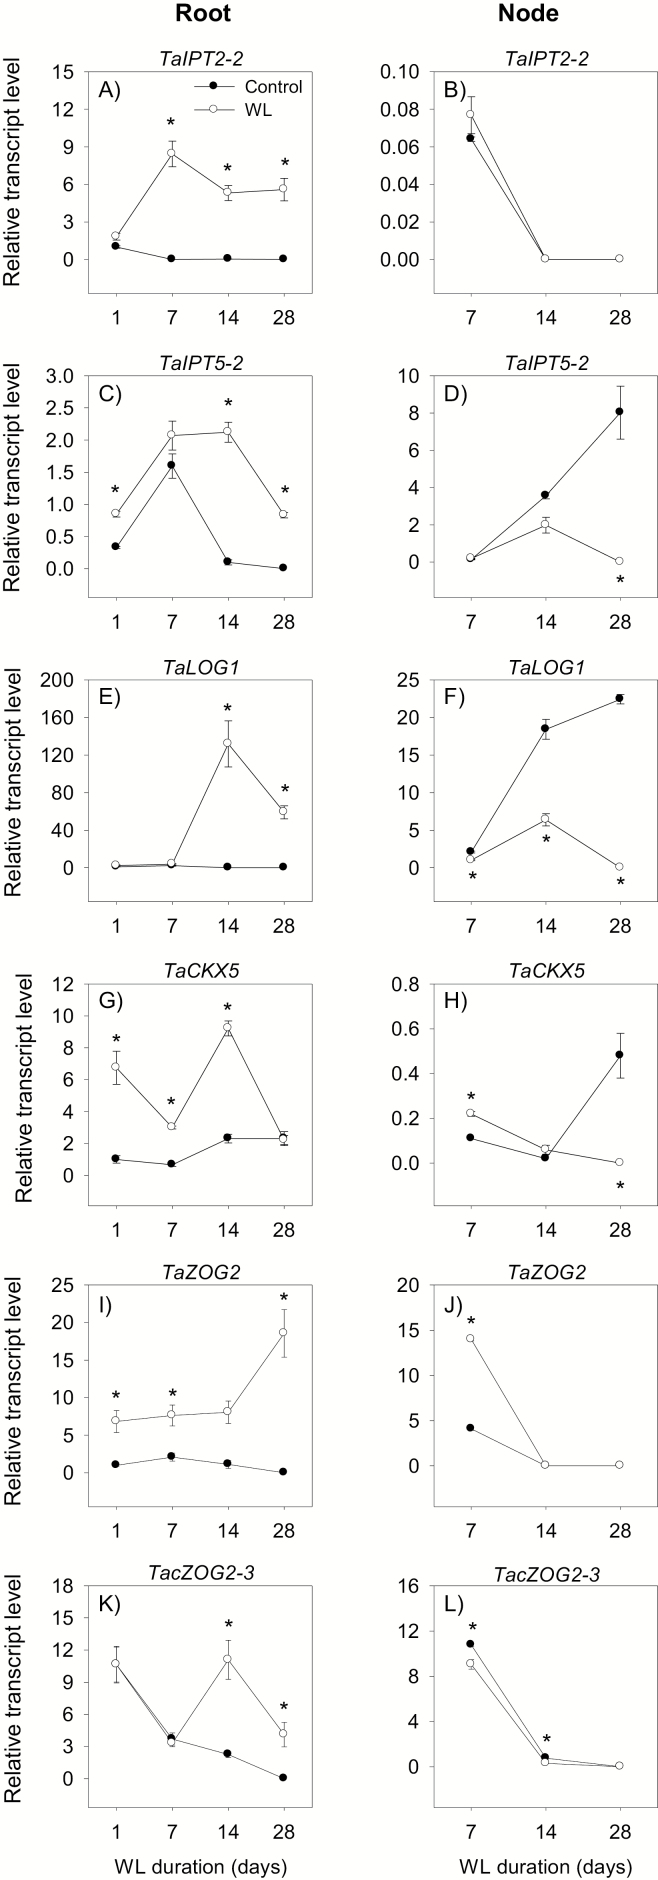
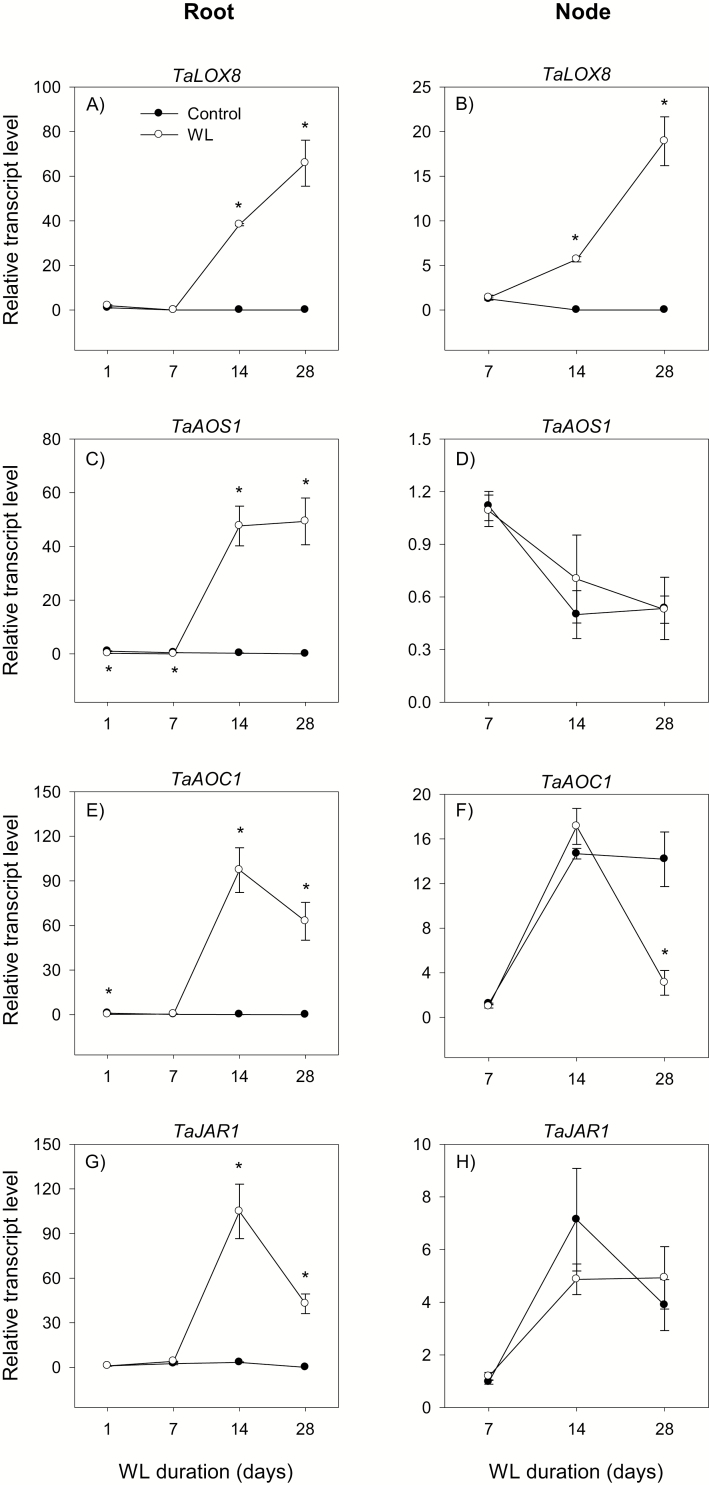
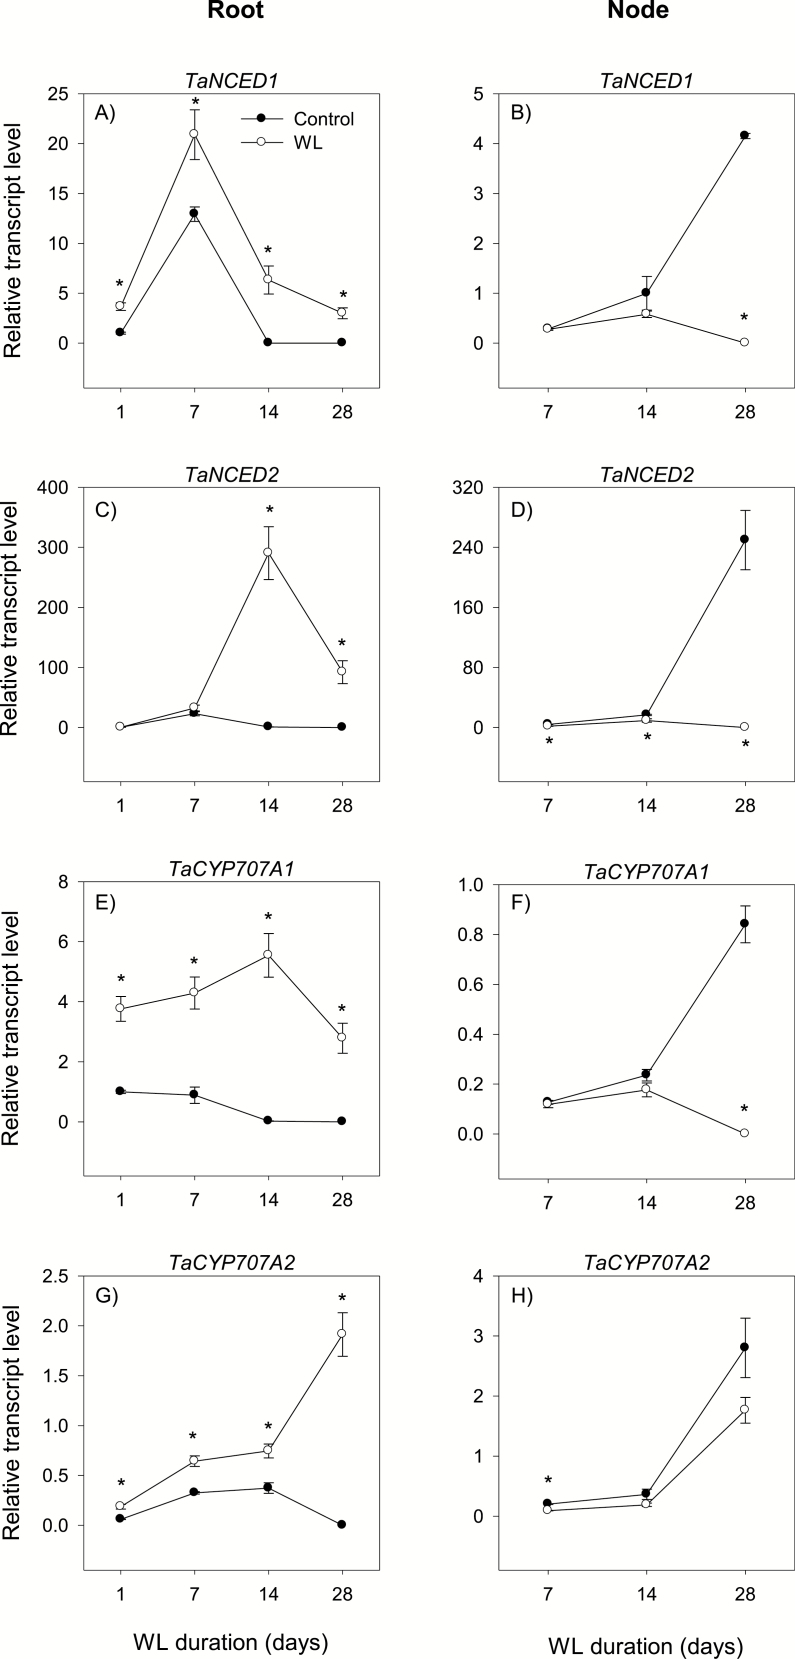
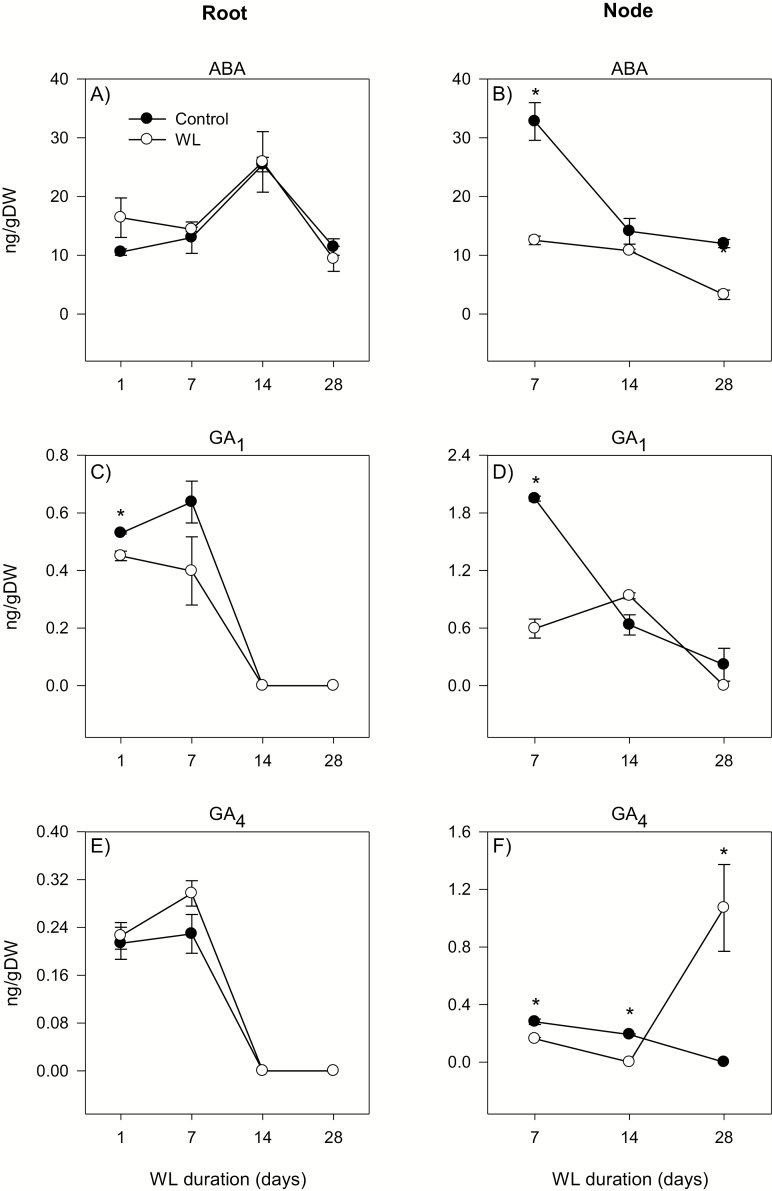
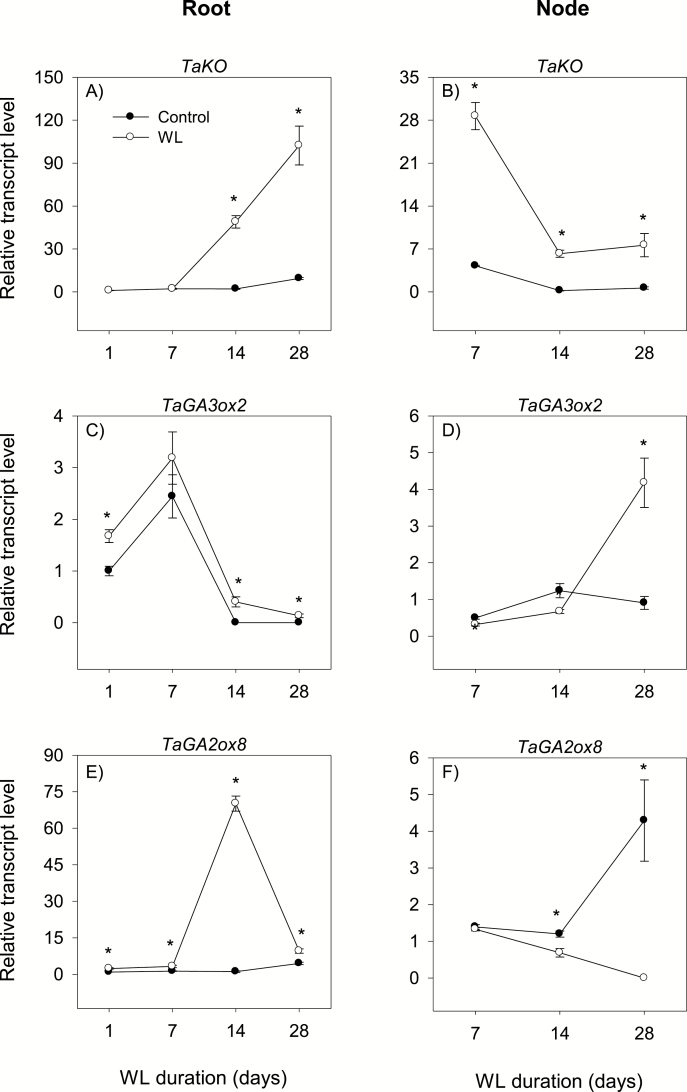
To gain insights into the molecular mechanisms underlying hormonal regulation in adventitious roots and during their emergence under waterlogged conditions in wheat, the present study investigated transcriptional regulation of genes related to hormone metabolism and transport in the root and stem node tissues. Waterlogging-induced inhibition of axile root elongation and lateral root formation, and promotion of surface adventitious and axile root emergence and aerenchyma formation are associated with enhanced expression levels of ethylene biosynthesis genes, ACS7 and ACO2, in both tissues. Inhibition of axile root elongation is also related to increased root indole acetic acid (IAA) and jasmonate (JA) levels that are associated with up-regulation of specific IAA biosynthesis/transport (TDC, YUC1, and PIN9) and JA metabolism (LOX8, AOS1, AOC1, and JAR1) genes, and transcriptional alteration of gibberellin (GA) metabolism genes (GA3ox2 and GA2ox8). Adventitious root emergence from waterlogged stem nodes is associated with increased levels of IAA and GA but decreased levels of cytokinin and abscisic acid (ABA), which are regulated through the expression of specific IAA biosynthesis/transport (TDC, YUC1, and PIN9), cytokinin metabolism (IPT5-2, LOG1, CKX5, and ZOG2), ABA biosynthesis (NCED1 and NCED2), and GA metabolism (GA3ox2 and GA2ox8) genes. These results enhance our understanding of the molecular mechanisms underlying the adaptive response of wheat to waterlogging.


Figures

Fig. 1.
Fig. 1.
Root and shoot phenotype under control and waterlogged conditions. Root dry weight (A), total number of axile roots per plant (B), average length of axile root (C), number of branch roots per nodal axile root (D), number of surface adventitious roots per plant (E), shoot dry weight (F), and tiller number (G) of plants waterlogged for 1, 7, 14, and 28 d, and their respective controls. Data are means of three independent replicates (roots of three individual plants per replicate) ±SE. Asterisks denote a statistically significant difference between samples derived from control and waterlogged plants within each duration of waterlogging (P<0.05; Student t-test). WL, waterlogged.
Fig. 2.
Fig. 2.
Emergence of surface adventitious root and aerenchyma formation. Comparison of surface adventitious root emergence in control (A) and waterlogged (B) plants at 28 d after waterlogging. Lateral sections of control (C) and 28 d waterlogged (D) nodal root segments (4 cm from the root apex) at ×4 magnification. Aerenchyma formation is evident in the cortical cells of roots waterlogged for 28 d.
Fig. 3.
Fig. 3.
Expression of ethylene biosynthesis genes. Relative transcript levels of ACS4 (A and B), ACS7 (C and D), ACO2 (E and F), and ACO4 (G and H) in the root tissue waterlogged for 1, 7, 14, and 28 d (A, C, E, and G) and stem node tissue waterlogged for 7, 14, and 28 d (B, D, F, H), and their respective controls. Transcript levels of the ACS and ACO genes in both tissues were determined using Ta18SrRNA as the reference gene and expressed relative to the transcript levels of ACS4 and ACO2 in control roots at 1 d after the start of waterlogging, respectively, which were arbitrarily set a value of 1. Data are means of three biological replicates ±SE. Asterisks denote a statistically significant difference in transcript levels between tissue samples derived from control and waterlogged plants within each duration of waterlogging (P<0.05; Student t-test). WL, waterlogging. ACS2 and ACO5 exhibited either very minimal or undetectable levels of expression irrespective of the tissue type or growth conditions, as shown in Supplementary Table S3.
Fig. 4.
Fig. 4.
Expression of respiratory burst oxidase homolog genes. Relative transcript levels of RBOH1 (A and B), RBOH2 (C and D), and RBOH3 (E and F) in the root tissue waterlogged for 1, 7, 14, and 28 d (A, C, and E) and stem node tissue waterlogged for 7, 14, and 28 d (B, D, and F), and their respective controls. Transcript levels of each gene in both tissues were determined as described in Fig. 3, and are expressed relative to the transcript level of RBOH1 in control roots at 1 d after the start of waterlogging, which was arbitrarily set a value of 1. Other data descriptions are as indicated in Fig. 3.
Fig. 5.
Fig. 5.
Expression of auxin metabolism and transport genes. Relative transcript levels of TDC (A and B), YUC1 (C and D), GH3.1 (E and F), GH3.2 (G and H), and PIN9 (I and J) in root tissue waterlogged for 1, 7, 14, and 28 d (A, C, E, G, and I) and stem node tissue waterlogged for 7, 14, and 28 d (B, D, F, H, and J), and their respective controls. Transcript levels of TDC, YUC1, GH3, and PIN9 genes in both tissues were determined as described in Fig. 3, and are expressed relative to the respective transcript levels of TDC, YUC1, GH3.1, and PIN9 in control roots at 1 d after the start of waterlogging, respectively, which were arbitrarily set a value of 1. Other data descriptions are as indicated in Fig. 3. No transcript of TAA1, AAO, YUC10, and PIN5 was detected irrespective of tissue type or growth conditions, as shown in Supplementary Table S3.
Fig. 6.
Fig. 6.
Auxin, cytokinin, and jasmonate levels. Indole acetic acid (IAA; A and B), N6-isopentenyladenine (IPA; C and D), trans-zeatin (t-zeatin, E and F), and jasmonoyl-l-isoleucine (JA-Ile; G and H) levels in the root tissue waterlogged for 1, 7, 14, and 28 d (A, C, E, and G) and stem node tissue waterlogged for 7, 14, and 28 d (B, D, F, and H), and their respective controls. Data are means of three biological replicates ±SE. Asterisks denote a statistically significant difference in hormone levels between samples derived from control and waterlogged plants within each duration of waterlogging (P<0.05; Student t-test). WL, waterlogging.
Fig. 7.
Fig. 7.
Expression of cytokinin metabolism genes. Relative transcript levels of IPT2-2 (A and B), IPT5-2 (C and D), LOG1 (E and F), CKX5 (G and H), ZOG2 (I and J), and cZOG2-3 (K and L) in the root tissue waterlogged for 1, 7, 14, and 28 d (A, C, E, G, I, and K) and stem node tissue waterlogged for 7, 14, and 28 d (B, D, F, H, J, and L), and their respective controls. Transcript levels of IPT genes, LOG1, CKX5, and ZOG genes in both tissues were determined as described in Fig. 3, and are expressed relative to the transcript levels of IPT2-2, LOG1, CKX5, and ZOG2 in control roots at 1 d after the start of waterlogging, respectively, which were arbitrarily set a value of 1. Other data descriptions are as indicated in Fig. 3. Expression levels of LOG3 in both tissues, and IPT2-2 and LOG5 in the stem node were either minimal or undetectable irrespective of growth conditions, as shown in Supplementary Table S3.
Fig. 8.
Fig. 8.
Expression of jasmonate metabolism genes. Relative transcript levels of LOX8 (A and B), AOS1 (C and D), AOC1 (E and F), and JAR1 (G and H) in the root tissue waterlogged for 1, 7, 14, and 28 d (A, C, E, and G) and stem node tissue waterlogged for 7, 14, and 28 d (B, D, F, and H), and their respective controls. Transcript levels of each gene in both tissues were determined as described in Fig. 3, and are expressed relative to their respective transcript levels in control roots at 1 d after the start of waterlogging, which were arbitrarily set a value of 1. Other data descriptions are as indicated in Fig. 3. LOX2 in both tissues, AOS2 in the root, and AOC2 in the stem node exhibited either relatively lower levels of expression than their respective homologs or undetectable levels of expression irrespective of growth conditions, as shown in Supplementary Table S3.
Fig. 9.
Fig. 9.
Expression of abscisic acid metabolism genes. Relative transcript levels of NCED1 (A and B), NCED2 (C and D), CYP707A1 (E and F), and CYP707A2 (G and H) in the root tissue waterlogged for 1, 7, 14, and 28 d (A, C, E, and G) and stem node tissue waterlogged for 7, 14, and 28 d (B, D, F, and H), and their respective controls. Transcript levels of the NCED and CYP707A genes in both tissues were determined as described in Fig. 3, and are expressed relative to the transcript levels of NCED1 and CYP707A1 in control roots at 1 d after the start of waterlogging, respectively, which were arbitrarily set a value of 1. Other data descriptions are as indicated in Fig. 3.
Fig. 10.
Fig. 10.
Abscisic acid and gibberellin levels. ABA (A and B), GA1 (C and D), and GA4 (E and F) levels in the root tissue waterlogged for 1, 7, 14, and 28 d (A, C, and E) and stem node tissue waterlogged for 7, 14, and 28 d (B, D, and F), and their respective controls. Other data descriptions are as indicated in Fig. 6.
Fig. 11.
Fig. 11.
Expression of gibberellin metabolism genes. Relative transcript levels of KO (A and B), GA3ox2 (C and D), and GA2ox8 (E and F) in the root tissue waterlogged for 1, 7, 14, and 28 d (A, C, and E) and stem node tissue waterlogged for 7, 14, and 28 d (B, D, and F), and their respective controls. Transcript levels of each gene in both tissues were determined as described in Fig. 3, and are expressed relative to their respective transcript levels in control roots at 1 d after the start of waterlogging, which were arbitrarily set a value of 1. Other data descriptions are as indicated in Fig. 3. No transcript of TaGA3ox3 was detected irrespective of tissue type or growth conditions, as shown in Supplementary Table S3.

References

    1. Arbona V, Gómez-Cadenas A. 2008. Hormonal modulation of citrus responses to flooding. Journal of Plant Growth Regulation 27, 241.
    1. Armstrong W. 1979. Aeration in higher plants. In: Woolhouse HW, ed. Advances in botanical research. London: Academic Press, 225–332.
    1. Bailey-Serres J, Lee SC, Brinton E. 2012. Waterproofing crops: effective flooding survival strategies. Plant Physiology 160, 1698–1709. - PMC - PubMed
    1. Blilou I, Xu J, Wildwater M, et al. . 2005. The PIN auxin efflux facilitator network controls growth and patterning in Arabidopsis roots. Nature 433, 39–44. - PubMed
    1. Boerjan W, Cervera MT, Delarue M, et al. . 1995. Superroot, a recessive mutation in Arabidopsis, confers auxin overproduction. The Plant Cell 7, 1405–1419. - PMC - PubMed

Publication types

MeSH terms